若虫杂交种是若虫科仙女的多年生水生草本植物。它是芬芳,多彩,不可缺少的主植物在净水功能。Nymphaea hybrid is a perennial aquatic herb of Nymphaea in Nymphaeaceae. It is fragrant, colourful and indispensable as the main plant in features of water purification. The content of the paper includes the extraction from Nymphaea hybrid, isolation, structural characterization and evaluation of antioxidant capacity in vitro.
- Nymphaea hybrid
- ultrasound-assisted
- cellulase
1. 引言
1. Introduction
Nymphaea hybrid is a perennial aquatic herb of Nymphaea in Nymphaeaceae [1]. It is fragrant, colorful and indispensable as the main plant in features of water purification [2][3]. In-depth study of flavonoids and polyphenols of Nymphaea has widespread application prospects in functional food, medicine and cosmetics industries. However, the studies about Nymphaea hybrid have been focused on the aromatic components for fragrance application, while there are only a few studies about flavonoids and polyphenols and other active ingredients.
2. Extraction of active substances
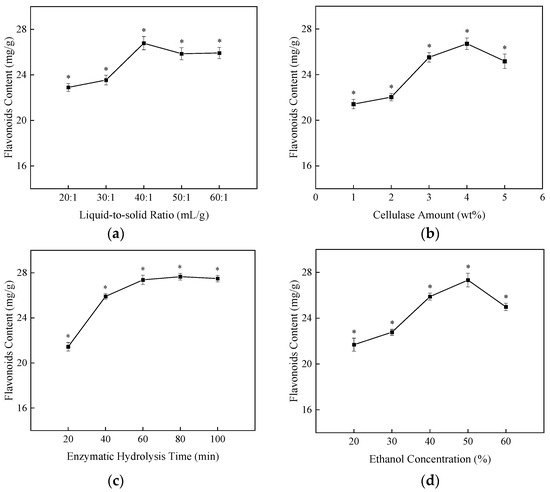
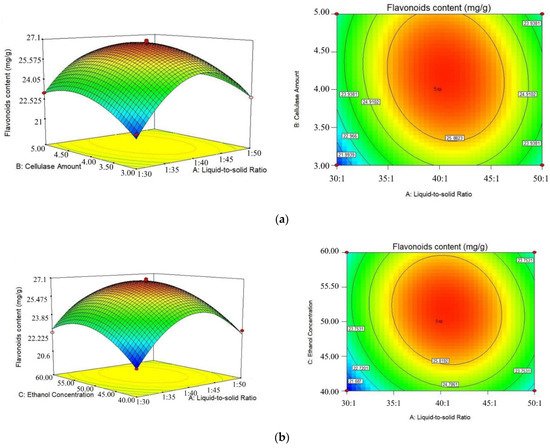
Ultrasonic-assisted cellulase extraction (UCE) was applied to extract flavonoids and polyphenols from the Nymphaea hybrid flower. The extraction conditions were optimized using the response surface method (RSM) coupled with a Box-Behnken design. According to the response surface experiment, the optimal process conditions for extraction were as follows: the liquid-to-solid ratio was 40.45:1 (mL/g), cellulase amount was 5.23% (w/w), the ethanol concentration was 52% (v/v). Under such conditions, the predicted flavonoid of NHE was 26.92 mg/g. To verify these optimal conditions, the experiment was repeated five times and the average actual flavonoid content of NHE was 27.26 ± 0.64 mg/g (n = 5), which was close to the predicted value and proved the validity of the models.
3. AB-8 Macroporous Resin
NHEP was prepared by the purification of NHE with AB-8 macroporous resin. As shown in Table 1, the content of flavonoids and polyphenols in the NHEP sample was higher than in the NHE sample with the same dry weight. After purification, the contents of flavonoids and polyphenols in NHEP increased from 55.60 mg/g to 157.39 mg/g and from 414.97 mg/g to 888.63 mg/g, respectively. This result showed that it was efficient for the enrichment of flavonoids and polyphenols of NHE by AB-8 macroporous resin.
2. 单因素实验
. The content of flavonoids and polyphenols in the NHE and NHEP with the same dry weight.
|
Sample |
Compound |
|
|
Flavonoids Content (mg/g) |
Polyphenols Content (mg/g) |
|
|
NHE |
55.60 ± 0.38 |
414.97 ± 2.95 |
|
NHEP |
157.39 ± 1.18 * |
888.63 ± 4.41 * |
The data shows as the mean ± S.D. (n = 3). *: p < 0.05 compared to NHE.
4. Activity Determination by Chemical Method
To explore in vitro antioxidant activity of NHE and NHEP, the free radical scavenging abilities against ABTS, DPPH, and reduction power, were detected compared with VC. As shown in Figure 1, the IC50 values of the DPPH radical of NHE, NHEP and VC were 11.09 ± 0.15 μg/mL, 3.28 ± 0.03 μg/mL and 5.18 ± 0.06 μg/mL, respectively. The IC50 values of the ABTS radical of NHE, NHEP and VC were 18.21 ± 0.05 μg/mL, 10.50 ± 0.10 μg/mL and 7.77 ± 0.04 μg/mL, respectively. The reduction power of NHE, NHEP, VC for Fe3+ were strong with high absorbances [4]. The absorbances were 2.20 ± 0.04, 2.36 ± 0.04 and 2.60 ± 0.07 in the 1 mg/mL concentration, respectively. This result indicated that the scavenging free radical abilities and reduction power of NHEP were similar to VC and stronger than that of NHE. NHE and NHEP were also evaluated for the anti-inflammatory activity by using hyaluronidase inhibition assays. The IC50 value of NHE and NHEP in hyaluronidase inhibition assay was 0.55 ± 0.01 mg/mL and 0.32 ± 0.01 mg/mL. The inhibition rate of 10 μg/mL dipotassium glycyrrhizinate (Dg) was 94.23 ± 1.72%. This result showed that both NHE and NHEP display an anti-inflammatory effect, and NHEP has a stronger anti-inflammatory effect than NHE. Hence, in vitro bioactivity evaluation by chemical assays showed that both NHE and NHEP displayed strong free radical scavenging abilities against the DPPH and ABTS radicals, good reduction power, and anti-inflammatory effect.
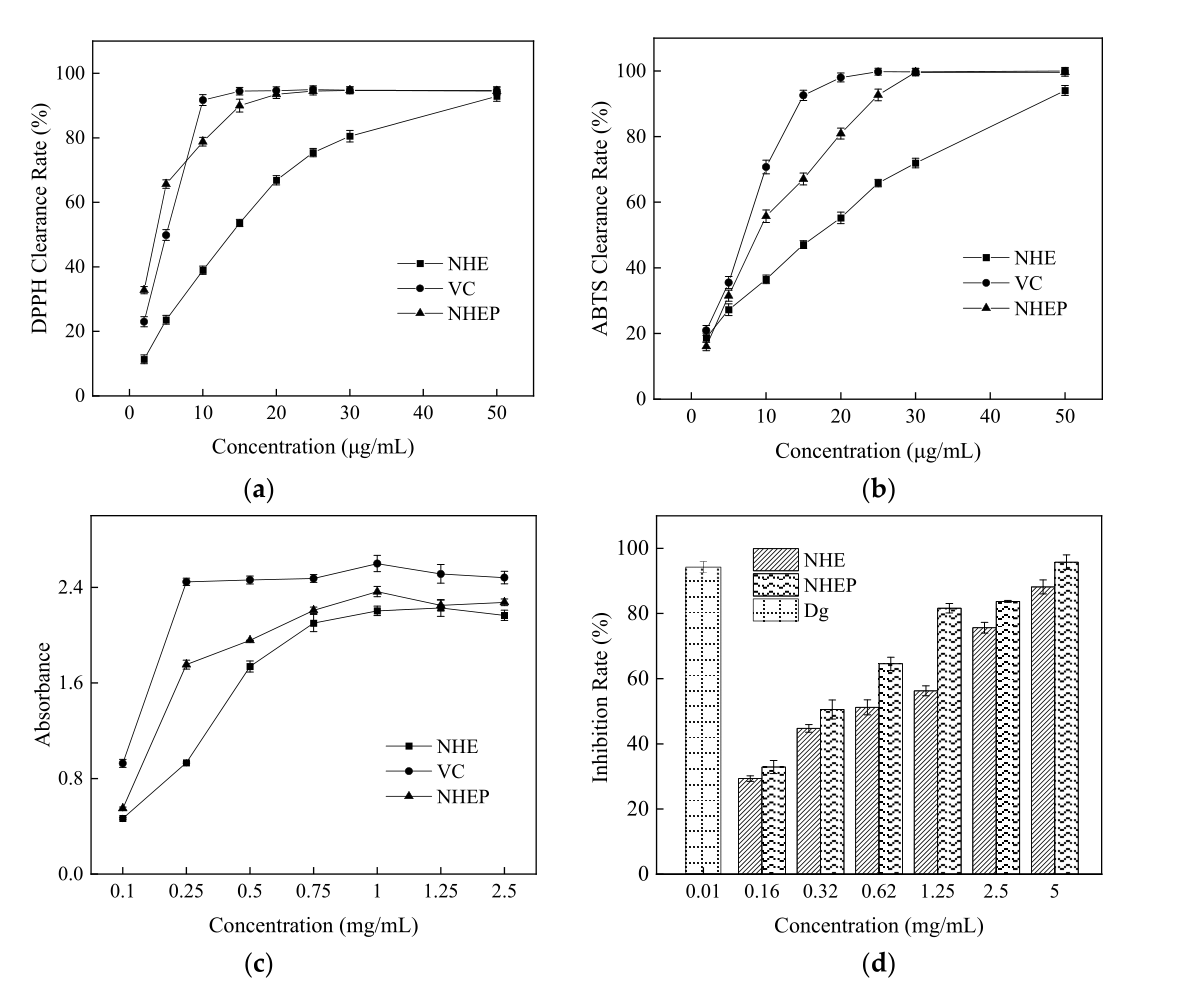
Activities of the NHE, NHEP and positive control by chemical method. (
) DPPH, (
) ABTS, (
) Reduction power, (
3. Response Surface Design
) Hyaluronidase inhibition assay. Dg stands for Dipotassium glycyrrhizinate, and the concentration is 10 μg/mL. The date is shown as the mean ± S.D. (n = 3).
5. Characterization of FTIR and HPLC
Infrared spectroscopy analysis can be used as a powerful tool to characterize and identify functional groups present in the compounds. As shown in Figure 2, the absorption peak at the vicinity of 3424 cm−1 is relatively wide and strong, which is attributed to the stretching vibration of O−H. The signal in wavelength of 2930 cm−1 is assigned to the absorption peak of stretching vibration of the C−H bond of aliphatic hydrocarbon. The band at 3000-3100 cm−1 is due to the stretching vibration of C−H of the aromatic ring. The aromatic C−H bond was out-of-plane bending vibration, resulting in absorption peaks at 834 and 760 cm−1 wavelengths [5]. A characteristic absorption peak at 1718 cm−1 may be assigned to the carboxylic acid of a sharp stretching band of the C=O. The peaks at 1613 and 1449 cm−1 wavelength belong to the C=C bond of the aromatic ring vibrates [6]. The absorption peaks at 1512 cm−1 may be assigned to the aromatic skeletal vibrations, ring breathing with C−O starching vibration [5]. The adsorption peaks at 1449 and 1349 cm−1 are assigned to the bending vibrations of −CH3 and −CH2. The peaks at 1210 and 1038 cm−1 wavelength belong to the stretching vibration of C−H and C−O bonds [6]. The characteristic peaks of the benzene ring, C−O stretching vibration and stretching vibration of O−H, indicate the presence of phenolic hydroxy groups [7].
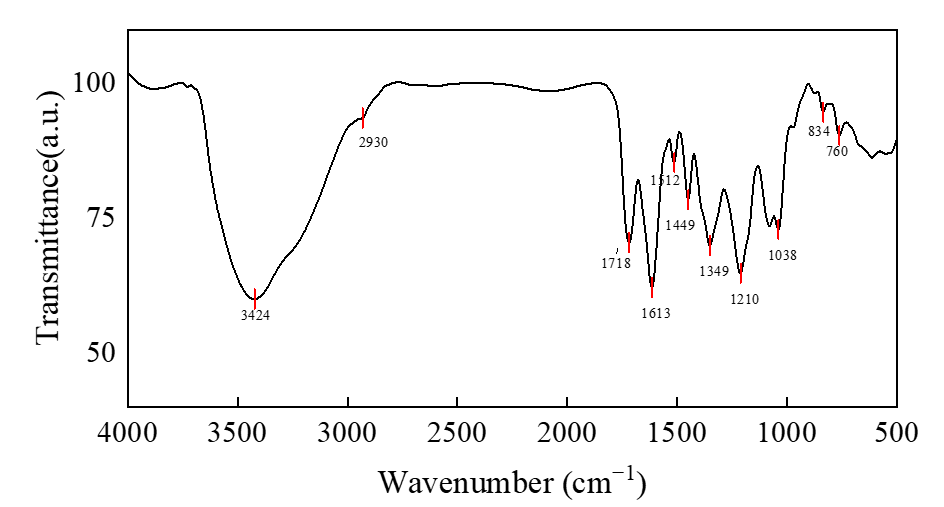
Figure 2. 1
FTIR-NHEP illustrating structural features.
The total polyphenol and flavonoid compositions of NHEP were identified by the characterization of HPLC in Figure 3 and Table 2. This result showed some of the main NHEP bioactive phytochemicals, including gallic acid (1.60 ± 0.36 mg/g), corilagin (65.60 ± 3.36 mg/g), ellagic acid (97.72 ± 0.92 mg/g), rutin (34.41 ± 4.24 mg/g), myricetin (3.13 ± 0.87 mg/g), quercetin (4.64 ± 0.15 mg/g), naringin (4.03 ± 0.24 mg/g) etc. The contents of corilagin, ellagic acid and rutin in NHEP were higher among these components. These standard substances have been reported to have excellent antioxidant activity, which further indicated that NHEP has great potential as a natural antioxidant. Uddin et al. identified 9 bioactive phytochemicals from methanolic extract of Nymphaea nouchali using an HPLC system [8]. Among these compounds, rutin (39.44 mg/g), myricetin (30.77 mg/g), ellagic acid (11.05 mg/g), gallic acid (5.33 mg/g) and quercetin (0.90 mg/g) were polyphenols or flavonoids, which were also identified as bioactive ingredients of NHEP in this work. We found the ellagic acid content (97.72 ± 0.92 mg/g) of NHEP was much greater than that (11.05 mg/g) of Nymphaea nouchali and that (6.16 ± 0.019 mg/g) of ethanolic extract of Water Lily (Nymphaea Tetragona Georgi) [9].
. Polyphenols and flavonoids compositions of NHEP by the characterization of HPLC.
| 23.52 |
| Source | Sum of Squares | df | Mean Squares | F-Value | p-Value | |
|---|---|---|---|---|---|---|
| Model | 71.7596 | 9 | 7.9733 | 67.6019 | <0.0001 *** | |
| A | 1.6801 | 1 | 1.6801 | 14.2445 | 0.0069 ** | |
| B | 2.2521 | 1 | 2.2521 | 19.0949 | 0.0033 ** | 5 |
|
Standard |
Retention Time (min) |
Regression Equation |
R2 |
NHEP Compound (mg/g) |
= Coefficients of determination. The data shows as the mean ± S.D. (n = 3).
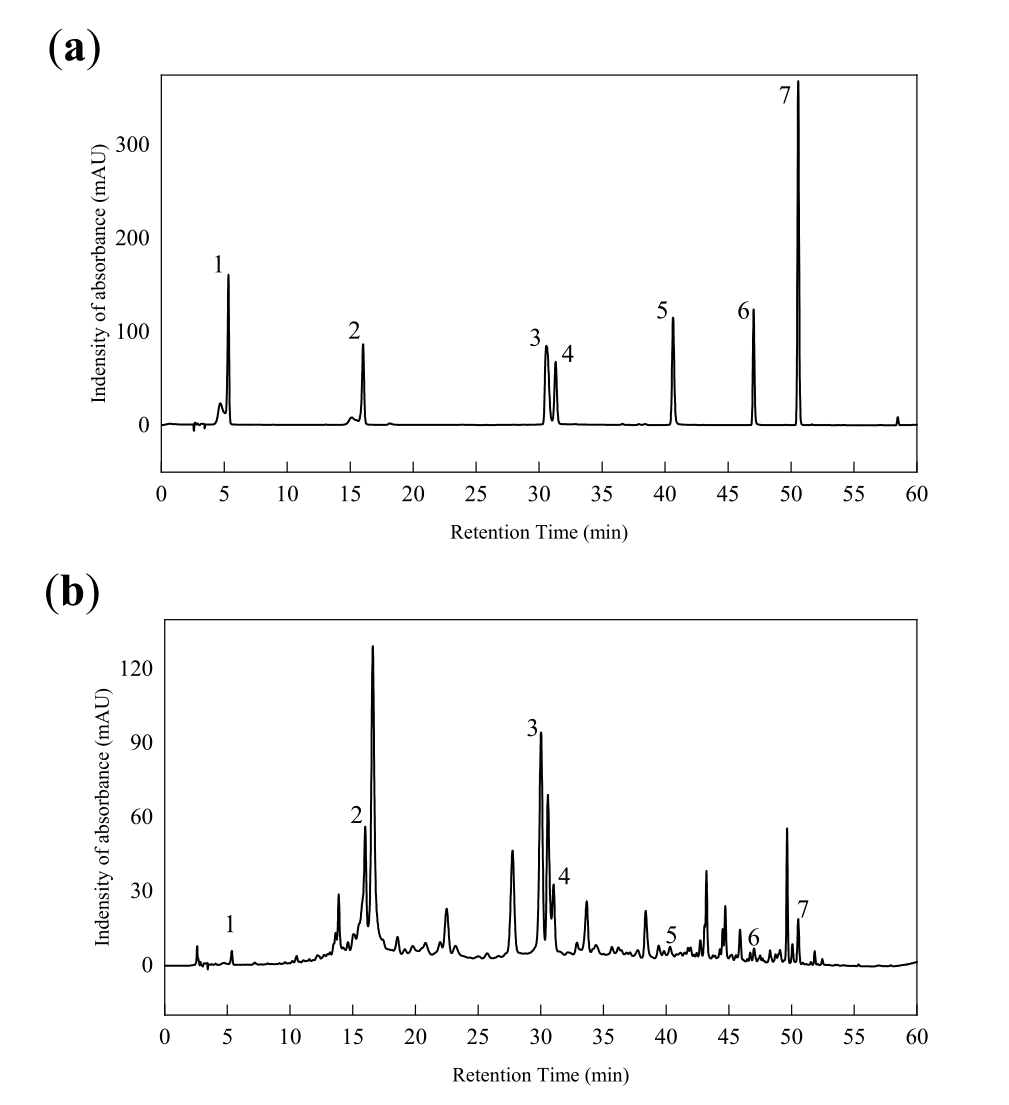
Figure 13.
| NO. | A/(mL/g) | B/(%) | C/(%) | Flavonoids Content (mg/g) | ||||||
|---|---|---|---|---|---|---|---|---|---|---|
| 1 | 40:1 | 4 | 50 | 26.62 | ||||||
| 2 | 40:1 | 5 | 60 | 25.66 | ||||||
| 3 | 30:1 | 3 | 50 | 21.30 | ||||||
| 4 | 40 | 23.34 | ||||||||
| C40:1 | 2.7817 | 1 | 2.7817 | 23.5852 | 0.0018 ** | 5 | 40:1 | 3 | 40 | 22.83 |
| AB | 0.8540 | 1 | 0.8540 | 7.2411 | 0.0310 * | 6 | 50:1 | 4 | 60 | |
| AC | 22.73 | |||||||||
| 0.5987 | 1 | 0.5987 | 5.0763 | 0.0589 | 7 | 40:1 | 4 | 50 | 26.40 | |
| BC | 0.6680 | 1 | 0.6680 | 5.6636 | 0.0489 * | 8 | 40:1 | 4 | 50 | 27.06 |
| A2 | 38.6989 | 1 | 38.6989 | 328.1105 | <0.0001 *** | 9 | 30:1 | 4 | 60 | 22.30 |
| 10 | 50:1 | 4 | 40 | 22.65 | ||||||
| 11 | ||||||||||
| C2 | 11.7205 | 1 | 11.7205 | 99.3726 | <0.0001 *** | 30:1 | 4 | 40 | 20.67 | |
| 12 | ||||||||||
| B2 | 6.9468Residual | 0.8256 | 7 | 0.1179 | 40:1 | 4 | 50 | 26.92 | ||
| Lack of Fit | 0.5251 | 3 | 0.1750 | 2.3293 | 0.2159 | 13 | 30:1 | 5 | 50 | 23.02 |
| Pure Error | 0.3006 | 14 | 50:1 | 3 | 50 | 22.85 | ||||
| 1 | 6.9468 | 58.8986 | 0.0001 ***4 | 0.0751 | 15 | 40:1 | 4 | 50 | 26.95 | |
| Cor Total | 72.5852 | 16 | ||||||||
| R2 | 0.9886 | 16 | 50:1 | 5 | 50 | 22.72 | ||||
| 17 | 40:1 | 3 | 60 | |||||||
|
Gallic acid |
5.33 |
y = 28.696 x − 6.5794 |
0.9997 |
1.60 ± 0.36 |
|
Corilagin |
16.21 |
y = 14.902 x − 40.435 |
0.9992 |
65.60 ± 3.36 |
|
Ellagic acid |
30.58 |
y = 10.3 x − 11.978 |
0.9999 |
97.72 ± 0.92 |
|
Rutin |
31.32 |
y = 10.71 x − 9.2865 |
0.9999 |
34.41 ± 4.24 |
|
Myricetin |
40.86 |
y = 12.76 x + 4.3092 |
0.9996 |
3.13 ± 0.87 |
|
Quercetin |
47.15 |
y = 11.001 x + 2.6758 |
0.9999 |
4.64 ± 0.15 |
|
Naringin |
50.69 |
y = 34.715 x + 24.424 |
0.9999 |
4.03 ± 0.24 |
Y = The peak area (mAU*s); X = The concentration of standards (μg/mL); R
HPLC of mixed standards (
) and NHEP (
). 1-gallic acid, 2-corilagin, 3-ellagic acid, 4-rutin, 5-myricetin, 6-quercetin, 7-naringin.
6. HaCaT Cells and B16 Cells Experiments
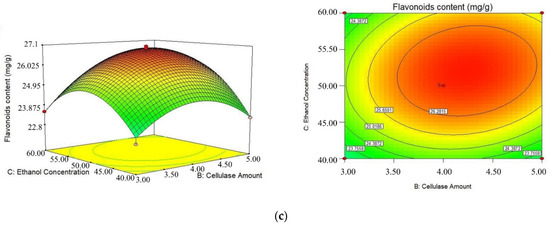
As shown in Figure 4-7, the cell viability by CCK-8 assays showed that NHEP had no significant cytotoxicity for B16 and HaCaT cells when the concentration was below 100 μg/mL and 120 μg/mL, respectively. NHEP with a concentration of 20-160 μg/mL can more effectively reduce the ROS level in H2O2 damaged HaCaT cells compared with 10 μg/mL of VC. The 40 μg/mL of NHEP had similar activity against intracellular melanin production in the B16 melanoma cells compared with 20 μg/mL Kojic acid. Good activities of antioxidation, whitening and protective effect against H2O2-induced oxidative damage promote the potential for NHEP as a functional raw material in the field of cosmetics and medicine.
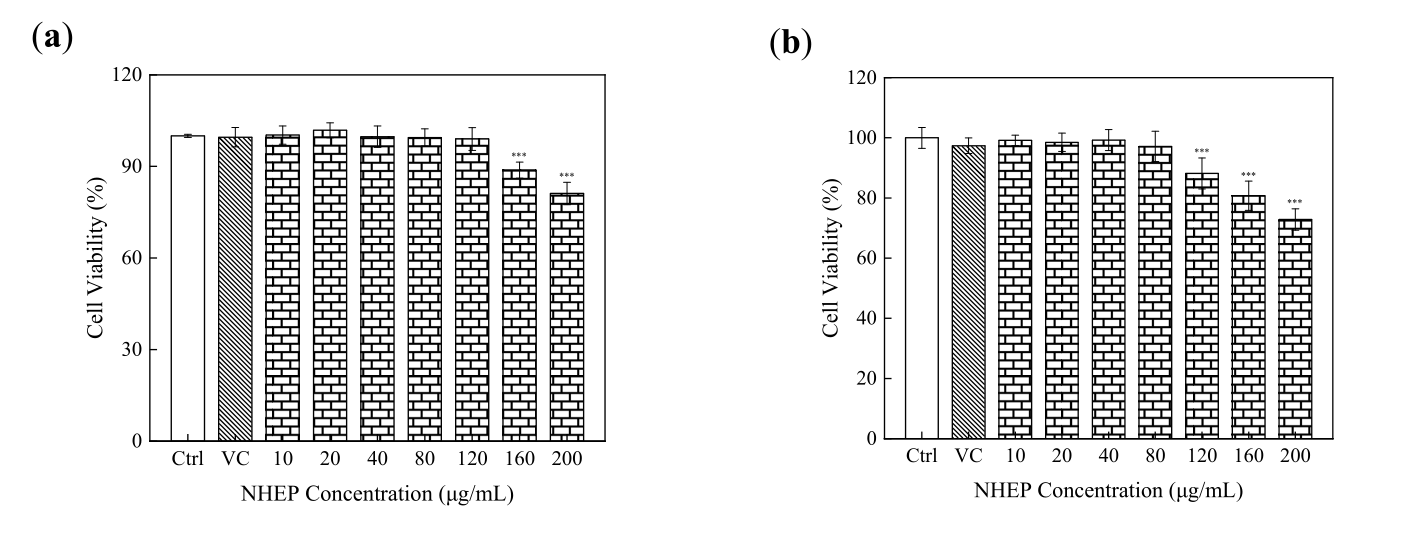
4. Cytotoxicity of NHEP on HaCaT cells. (a) cell viability of the HaCaT cells cultured with the NHEP for 24 h, (b) cell viability of the HaCaT cells cultured with the NHEP for 48 h. VC stands for Vitamin C, and the concentration is 10 μg/mL. Significance: compared with the control group, *** p < 0.001. The data shows as the mean ± S.D. (n = 5).
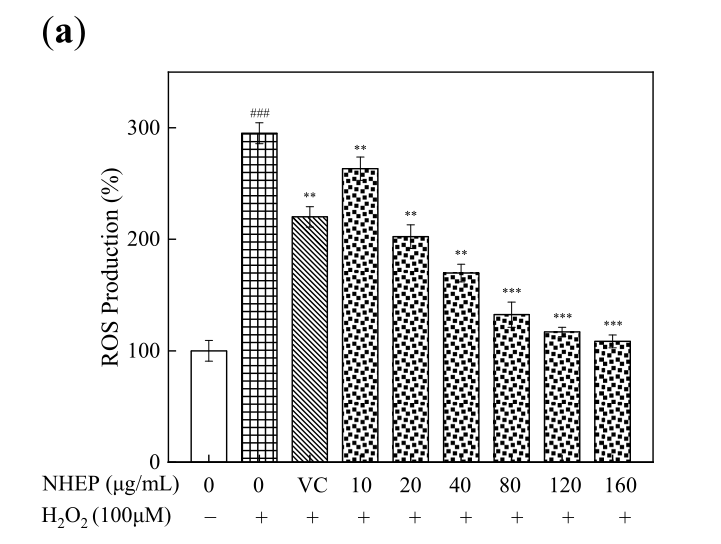
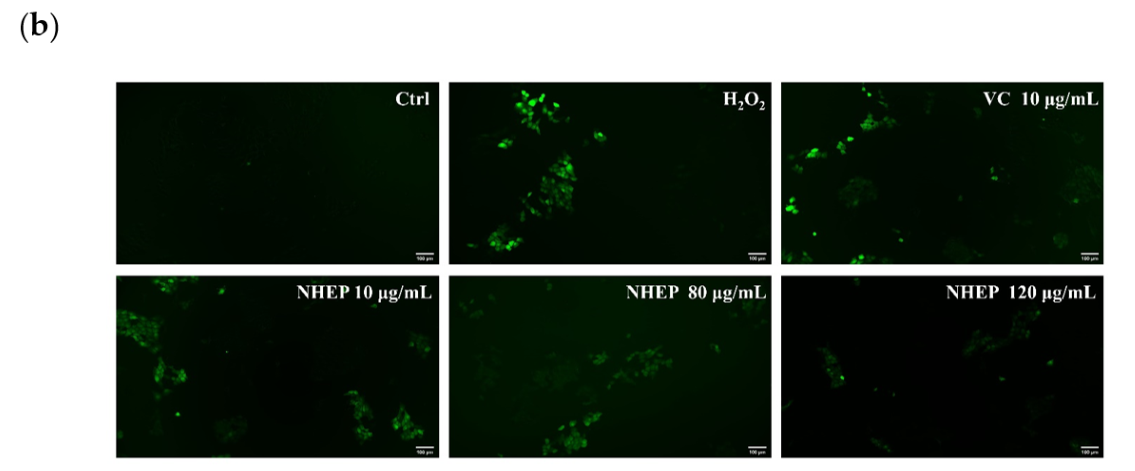
5. Effects of NHEP on the ROS level of HaCaT cells with stimulation of H2O2: (a) ROS production, (b) fluorescence intensity by detected the DCFH-DA. VC stands for Vitamin C, and the concentration is 10 μg/mL (scale bar is 100 μm). Significance: ### p < 0.001 compared with the control group. ** p < 0.01, *** p < 0.001 compared with the H2O2 stimulation group. The data are shown as the mean ± S.D. (n = 5).
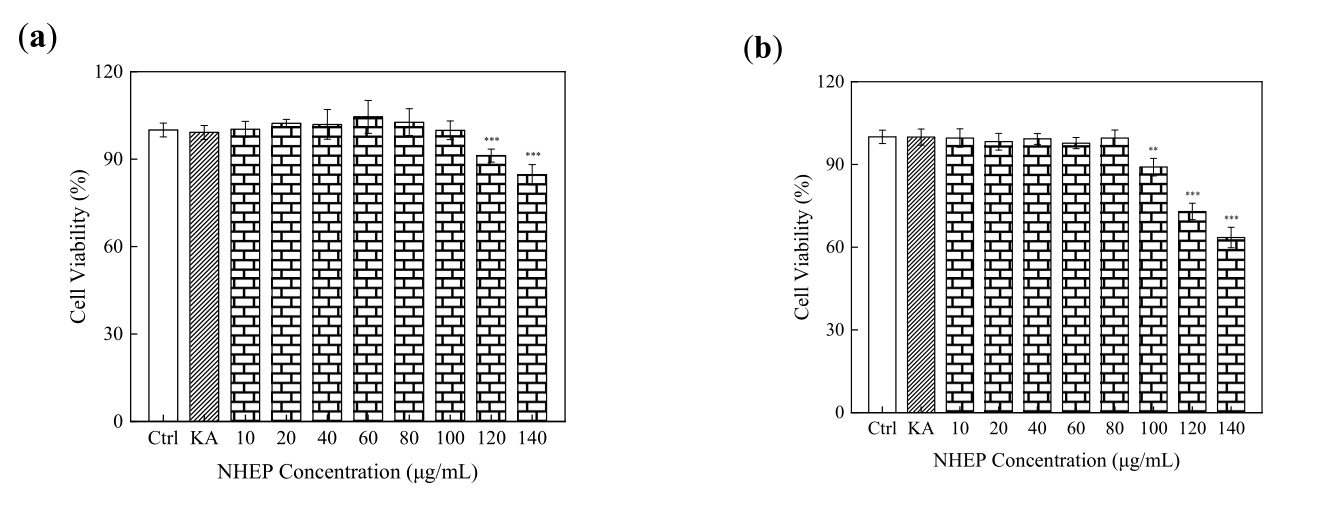
Cytotoxicity of NHEP on B16 cells: (a) viability of the B16 cells cultured with the NHEP for 24 h, (b) viability of the B16 cells cultured with the NHEP for 48 h. Significance: compared with the control group, ** p < 0.01, *** p < 0.0001. The data shows as the mean ± S.D. (n = 5). KA stands for Kojic acid, and the concentration is 20 μg/mL.
Effects of the NHEP on B16 cells melanin production. Significance: compared with the control group, * p < 0.05, ** p < 0.01, *** p < 0.001. The data shows as the mean ± S.D. (n = 5). KA stands for Kojic acid, and the concentration is 20 μg/mL.
This entry is adapted from 10.3390/molecules27061914
References
- Huihui Zhang; Huaiyan Wu; Qi Zhou; Runan Zhao; Qianqian Sheng; Zunling Zhu; Flowering characteristics and reproductive biology of Nymphaea hybrid, a precious water lily. Scientia Horticulturae 2021, 287, 110268, 10.1016/j.scienta.2021.110268.
- Kai Uwe Nierbauer; Birgit Kanz; Georg Zizka; The widespread naturalisation of Nymphaea hybrids is masking the decline of wild-type Nymphaea alba in Hesse, Germany. Flora - Morphology, Distribution, Functional Ecology of Plants 2014, 209, 122-130, 10.1016/j.flora.2013.12.005.
- N.S. Abd Rasid; M.N. Naim; H. Che Man; N.F. Abu Bakar; M.N. Mokhtar; Evaluation of surface water treated with lotus plant; Nelumbo nucifera. Journal of Environmental Chemical Engineering 2019, 7, 103048, 10.1016/j.jece.2019.103048.
- Duraisamy Gomathi; Ganesan Ravikumar; Manokaran Kalaiselvi; Balasubramaniam Vidya; Chandrasekar Uma; In vitro free radical scavenging activity of ethanolic extract of the whole plant of Evolvulus alsinoides (L.) L.. Chinese Journal of Integrative Medicine 2014, 21, 453-458, 10.1007/s11655-014-1763-0.
- Danny E. García; Nacarid Delgado; Francisca L. Aranda; Mariela A. Toledo; Gustavo Cabrera-Barjas; Eduard Maury Sintjago; Danilo Escobar-Avello; Sebastian Paczkowski; Synthesis of maleilated polyflavonoids and lignin as functional bio-based building-blocks. Industrial Crops and Products 2018, 123, 154-163, 10.1016/j.indcrop.2018.06.065.
- Danilo Escobar-Avello; Javier Avendaño-Godoy; Jorge Santos; Julián Lozano-Castellón; Claudia Mardones; Dietrich von Baer; Javiana Luengo; Rosa Lamuela-Raventós; Anna Vallverdú-Queralt; Carolina Gómez-Gaete; et al. Encapsulation of Phenolic Compounds from a Grape Cane Pilot-Plant Extract in Hydroxypropyl Beta-Cyclodextrin and Maltodextrin by Spray Drying. Antioxidants 2021, 10, 1130, 10.3390/antiox10071130.
- Samir Felhi; Hafedh Hajlaoui; Marwa Ncir; Sana Bakari; Naourez Ktari; Mongi Saoudi; Néji Gharsallah; Adel Kadri; Nutritional, phytochemical and antioxidant evaluation and FT-IR analysis of freeze dried extracts of Ecballium elaterium fruit juice from three localities. Food Science and Technology 2016, 36, 646-655, 10.1590/1678-457x.12916.
- Nazim Uddin; Abdus Samad; Abu Zubair; Zahurul Haque; Kanika Mitra; Tanzir Ahmed Khan; MdAmir Hossain; Ashikujaman Syed; Aklima Afroze; Potential bioactive phytochemicals, antioxidant properties and anticancer pathways of Nymphaea nouchali. Asian Pacific Journal of Tropical Biomedicine 2020, 10, 555, 10.4103/2221-1691.297055.
- Gunhyuk Park; Yeomoon Sim; Wonil Lee; Sang Hyun Sung; Myung Sook Oh; Protection on Skin Aging Mediated by Antiapoptosis Effects of the Water Lily (Nymphaea Tetragona Georgi) via Reactive Oxygen Species Scavenging in Human Epidermal Keratinocytes. Pharmacology 2016, 97, 282-293, 10.1159/000444022.