Landscape Changes in Protected Areas in Poland: Comparison
Please note this is a comparison between Version 3 by Lindsay Dong and Version 2 by Lindsay Dong.

Land-Use Cover Changes (LUCCs) are one of the main problems for the preservation of landscapes and natural biodiversity. Protected Areas (PAs) do not escape this threat. Poland is among the European leaders in terms of the variety of landscapes and the share of an area designated as a protected area. However, as many as 78% of the habitats have poor or bad conservation status based on EEA reports. The changes in PAs were usually smaller than in the surrounding buffer zones, which may indicate their effectiveness. The scale of land-cover flows (LCFs) changed within particular forms of protected areas, though afforestation and deforestation predominating in all area types. National reserves and parks were the most stable in terms of land cover structures. However, human settlements increased around the protected areas, potentially increasing threats to their ecological integrity.

  • landscape change
  • protected area
  • urban pressure
  • deforestation
  • land use
  • CORINE land cover
  • Poland

1. Introduction

Protected areas (PAs) are the cornerstone of global biodiversity conservation strategies [1][2]. They are a key for mitigating climate change, providing ecosystem services, and fostering human well-being [3][4]. There is considerable evidence that well-managed protected areas are effective in reducing biodiversity loss [5][6][7][8][9][10][11]. However, not all protected areas are fulfilling their conservation objectives [12][13][14][15]. As the human population increases, pressures on habitats are intensifying with unknown consequences for protected area effectiveness [16][17][18][19][20], and recent work has identified a range of drivers of biodiversity loss in protected areas [18][19][20][21][22].
The inception and growth of a protected area network are one of the major global responses to rapid habitat loss and fragmentation, to counter the threats of the propagation of invasive species, deforestation, climate change, and urban and agricultural pressure. In 1990, PAs covered 8.6% of the Earth’s surface [23], and now occupy 16.44% of the Earth’s land surface, and 7.73% of the marine area [23]. According to the World Database of Protected Areas (WDPA) [23], they have expanded from 84,577 individual sites in 2003 to 258,133 in 2021, covering 245 countries and territories. The highest coverage of protected areas is in the Polar region (over 41% terrestrial and 44% marine) (Table 1). Europe has the largest number of sites, but they cover only 13% of the land area and 8% of the marine area [23].
Table 1. Protected areas in the world.
Region Total Protected Areas With Management Effectiveness Evaluations Number of Countries Terrestrial Protected Area Coverage % Marine Protected Area Coverage %

23].

Sustainability 14 00753 g003 550
Figure 3. Protected areas in Poland according to the International Union for Conservation of Nature (IUCN). (a) Management Categories; (b) growth in protected area coverage in Poland (status years 1950 = 0) (source: https://www.protectedplanet.net/country/POL, accessed on 7 May 2021) UNEP-WCMC, May 2021).
Table 2. List of nature conservation forms in Poland.
No. Nature Conservation Form Number of Sites Area [Thousand Hectares] *
LSI 2000 2020 2000 2020
Asia & Pacific 34,710 2821 56 15.37
1. Nature reserves 130718.56
1499
9.
Monuments of nature
33 094 34 890 x x
10. Plants, animals, and fungi species protection 715 plants species

322 fungi species

801 animals species
x x
SPAs—special protection sites (Birds Directive) (PLB). SACs—special sites of conservation (Habitats Directive) (PLH). * Terrestrial area only (do not include information about marine areas), due to the overlapping of the boundaries of various forms of nature conservation, the areas do not correspond to the sum of the total area designated as a terrestrial protected area. x—not applicable. Data in points 1–9—Source: Central Register of the Forms of Nature Protection, crfop.gdos.gov.pl (3 March 2021, regularly updated data); data in points 10—Source: General Directorate for Environmental Protection (January 2015)—data refer to native species.

2. Landscape Changes 

2.2. Landscape Changes 

In the analyzed period of 2000–2018, the share of nature conservation areas in the territory of Poland increased from 38% to almost 44%, mainly due to the implementation of a new form of nature protection (European Ecological Network Natura 2000 sites) and the establishment of a new national park in 2001 (Ujscie Warty). 

The land cover structure on PAs underwent slight changes. Out of 44 land cover classes identified at level 3 CLC, 32 classes were identified in Poland, including 28 different classes of land cover forms in protected areas. They are dominated by forests (classes 312 and 313) and arable land (class 211), together covering about 92% of the PAs area in 2000. The matrix of transformations between land cover classes in PAs is presented in Figure 4. From 2000 to 2018, the most frequently transformed CLC class was 312 (coniferous forest). It was transformed into class 324 (transitional woodland shrubs). Slightly less intense but also quite frequent were transformations in the opposite direction—from class 324 to classes 312 and 313 (mixed forest). However, the area covered by such flows was almost 35% smaller than that of flows 312–324. Even so, the total forest area increased by 2.43% between 2000 and 2018 (Table 3). Besides artificial surfaces (group 1 in level 1 CLC), water bodies (group 5) were the most stable over time. Small changes were also observed in classes 411 (inland marshes) and 412 (peatbogs). They constituted, respectively, 0.05% and 0.01% of all transformations and covered 0.1% of the areas in class 411 and 0.3% of areas classified as 412. As for the transformations towards anthropogenic areas (classes 1xx), they mainly concerned agricultural land, in particular classes 211 (non-irrigated arable land) and 242 (complex cultivation patterns). The area of urbanized areas increased by as much as 85% and agricultural land decreased by 16%, including the reduction of the area of meadows, pastures, and mixed crops by almost 10% (Table 43).

Sustainability 14 00753 g007 550
Figure 4. Matrix for Land Use-Cover Changes in PAs between two dates (2000–2018), in line with Level 3 of CORINE Land Cover (CLC) with the classification of major change processes: urbanization (red), afforestation (green), deforestation (brown), intensification of agriculture (orange), extensification of agriculture (yellow), formation of water bodies (blue) and naturalization or land reclamation (yellow-green), and non-classified changes (grey). In the rows are the CLC classes for the starting year (t1, 2000). In columns, the CLC classes for the final year (t2, 2018). The meaning of the codes for the CLC classes can be consulted in Jager et al., 2012 [32]. Values in italics mean the percentage share of transformations of individual pairs of classes between 2000 and 2018 (rows sum up to 100). The “Total” value shows the percentage of the area transformed from a given CLC class (Total 1) or into a given CLC class (Total 2) in the total area undergone transformation between 2000 and 2018.
Table 43. Changes in selected area-edge metrics between two dates (2000–2018) calculated at the class level for protected areas (PAs) and 1 km buffer zones (PABs).
Land Cover Type CA [ha] (%) PLAND [%] AREA_MN [ha] TE [m]
PAs PABs PAs PABs PAs PABs PAs PABs
148.7
Urban areas +188,517 (85.3) +158,290 (49.0)169.6
1.41 2.98 2.3 Africa 8559 1000 58 14.11 12.35
Europe 158,452 15,719 62 13.14 8.44
Latin America&Caribbean 9971 1282 52 24.21 23.04
Polar 35 3 5 41.28 44.78
North America 45,272 117 3 11.85 16.51
West Asia 378 65 12 3.82 1.11
UNEP-WCMC (2021). Protected Area Profile from the World Database of Protected Areas, May 2021. Available at: www.protectedplanet.net, accessed on 5 May 2021. These values may be slightly different from the national data. According to the European Environment Agency (EEA) in 2020, protected areas covered 26% of EU land, with 18% designated as Natura 2000 sites and 8% as other national designations [24]. The area and number of terrestrial protected areas in Europe has grown steadily over time, where the biggest increases were in the 1990s (Figure 1) [24][25]. In EEA-38 countries (plus the United Kingdom), this coverage is lower and amounts to 23%. In Poland—one of the largest countries in the European Union (EU) selected as the study area for further detailed analyses—the number of PA objects according to WDPA is 3091, covering 39.54% of the land area [23]. National data indicate that there are 10,884 sites (surface forms of national legal nature protection) and 995 sites protected under the European Natura 2000 Network, covering a total of 43.88% of the country’s land area [26][27].
Sustainability 14 00753 g001 550
Figure 1. Increase in the number and size of nationally designated protected areas in Europe (EEA-38 + UK), 1950–2020 (Source: Nationally designated areas (CDDA) reported in 2020, provided by the European Environment Agency (EEA)).
To achieve the target of legally protecting a minimum of 30% of EU land, as set out in the EU biodiversity strategy for 2030, further expansion of terrestrial protected areas will be needed. However, the designation of protected areas is not in itself a guarantee of biodiversity conservation. Unfortunately, the increase in the number and area of protected areas does not directly transpose to the conservation status of habitats. At the EU level, only 23.87% of habitat assessments have good conservation status, with 72.39% having poor or bad conservation status [28]. Grasslands, dunes, and bog, mire, and fen habitats show strong deteriorating trends, while forests have the most improving trends. Intensive agriculture, urban sprawl, and pollution are the top reported pressures on habitats. Against this background, Poland (PL) looks even worse. As many as 78.26% of the habitats have poor or bad conservation status (Figure 2) [28]. Even though Poland is among the European leaders in terms of the share of an area designated as a terrestrial protected area (fourth place out of 32 EEA member countries [24]), it ranks only 16th in terms of the conservation status of habitats [28].
Sustainability 14 00753 g002 550
Figure 2. Conservation status of habitats at EEA Member State level (EU27+UK) and in Poland (PL), 2013–2018 (based on the conservation status of habitat type datasets from Article 17, Habitats Directive 92/43/EEC report provided by EEA).
Many protected areas may not be adequately safeguarding biodiversity from human activities on surrounding lands and global change. The magnitude of such change agents and the sensitivity of ecosystems to these agents vary among protected areas [29][30]. Thus, there is a need to assess vulnerability across networks of protected areas to determine those most at risk.

2. Landscape Changes in Protected Areas in Poland

2.1. Area

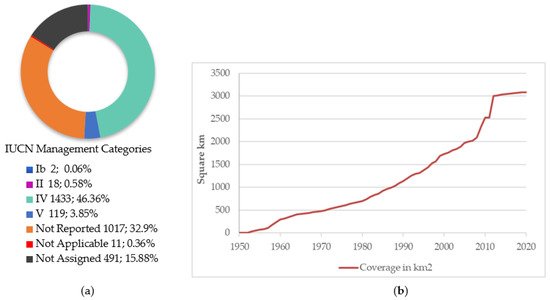
According to the Nature Conservation Act, there are 10 forms of nature conservation in Poland (Table 2): 8 forms of surface protection and 2 forms of individual protection (objects or species) [31]. The Polish definitions of these areas do not always coincide with International Union for Conservation of Nature (IUCN) categories of protected areas (Figure 3). For example, according to the criteria used by the IUCN, none of the 1499 Polish nature reserves has been classified as a Strict Nature Reserve (category I), and only 1 is classified as Ib (Wilderness area). The remaining majority was classified into the “Not Reported” group. Furthermore, only 16 of 23 Polish national parks have the status of an “international” national park (category II), while the rest are classified as category V, a protected landscape area, or not reported [

PAs PABs PAs PABs PAs PABs PAs PABs PAs PABs PAs PABs
−4.83 +20,840,050 17,308,300
2. National parks 22
Urban greenery +8020 (61.5) +4804 (25.5)23 306.5 315.1
0.06 0.09 0.54 −1.62 +691,700 +607,600 3. Landscape parks 120 124
Urban areas +53,952 +99,985 0.4 1.88 0.35 −4.15 6 078 4 252 −2,786,047 −100,039 54.23 38.73
Urban greenery +3431 +2846 0.03 0.05 0.17 −1.35 271 250 −29,208,137 −1,661,509 7.68 5.96
2446.9 2531.8
−2.63 −12,651,400 −6,680,300
Arable land 4. Natura 2000 areas x
Arable land −244,672 (−6.5) −132,426 (−5.1) −157,168 −110,277−1.83 −1.18−2.93 0.99 −2.43 0.68 −2.29 −2 365 −644 2212 2403 −10.45 145 (SPAs)

849 (SACs)
x 4911.4 (SPAs)

3491.3 (SACs)
−4.63 Pastures 1 −250,453 (−9.5) −127,760 (−13.9) −1.87 5. Protected landscape areas
Pastures 1 −148,921 −83,988−2.58 −4.14 −2.01 −14,049,450 −1.11−13,180,100
−1.7 −2.77 −1.32 −1 428 −2 306 10,274 43,977 −12.93 −17.89 407 407 7137.7 6925.6
Forests +145,255 (2.4)
Forests+83,128 (7.0) 1.09 1.41 −1.4 1.04 +6,282,250 +5,323,100
+87,605 +64,426 450 1 312 21 −3085 5.54 5.54 6. Landscape-nature complexes 170 263 78.1 118.8
Shrubs and scrub
Shrubs and scrub+143,136 (66.1) +58,284+50,960 (97.2) +33,4931.07 0.440.97 0.63−8.4 −7.62−0.71 −0.71+12,803,300 2 650+5,295,800
1 858 203,713 −2,027,190 36.72 24.97 7. Open spaces −2529 (−18.4) −895 (−22.2) −0.02 −0.02 20.39 −0.79 −228,700 −126,700
0.66 1.09 −2.77 0.81 Ecological areas 6113 7654 44.9
Open spaces −1000 −537 −0.01 −0.01 12.41 −0.45 −54 −68 2,151,017 −7,603,132 −3.13 −2.59 Wetland +2680 (2.8) −386 (−6.2) 0.02 −0.01 −7.13 −2.73 +372,400 −22,800
Water +10,047 (2.2) +5872 (7.3) 0.08 0.1 2.82 1.9 +529,750 +357,400
1 Pastures and mixed crops.
The increase in the urbanized areas observed in the protected areas was even greater than in the surrounding buffer zone (Table 3). In contrast to the buffer zone (PABs), in the protected areas (PAs) the average area of urbanized patches (AREA_MN) increased, while the Splitting Index (SPLIT) value decreased, which indicates that these areas are more consolidated. At the same time, the increases in Total Core Area (TCA) and Core Area Percentage of Landscape (CPLAND) shown in Table 4 revealed a 77.4% increase in urban core areas in PAs and 44.9% in PABs. In addition, the mean size of urban core areas (CORE_MN) increased by 0.35 ha in PAs and decreased by 4.15 ha in PABs. The rate of increase of urban core areas in PAs and PABs was lower than the rate of increase for the total urban area (Table 3), suggesting that the emergence of isolated urban areas contributes to urban expansion more than the sprawl from existing urban areas. The phenomenon is more intense in the buffer zone. This is also confirmed by the increase in the value of the Landscape Shape Index, which indicates a more irregular shape of built-up areas compared to 2000. Table 4. Changes in selected core area and aggregation metrics between two dates (2000–2018) calculated at the class level for protected areas (PAs) and 1 km buffer zones (PABs).
Land Cover Type TCA [ha] CPLAND [%] CORE_MN [ha] NP SPLIT
55.4
8.
Documentation sites
103
178 1.0 1.0
Wetland 180 −274 0 −0.01 −6.15 −1.77 67 56 −24,042 2,601,001 2.21 0.04
Water +4919 +4557 0.04 0.08 1.41 1.47 −7 36 486 −808 1.03 1.27
1 Pastures and mixed crops.
The core area and aggregation metrics reveal that although the total forest area increased between 2000 and 2018, the average area of the patches (AREA_MN) and the average area of the core (CORE_MN) decreased in PAs. Furthermore, the number of patches increased by 450 within the PAs and by 1312 in the PABs. In addition, the 20.7 increase in Splitting Index shows that there is now more forest patches as compared to 2000, a sign of fragmentation. In the buffer zone, the mean patch and core size increased. Coupled with the declining Splitting Index, this indicates a lesser fragmentation problem. In contrast to forest areas and urban areas, agricultural areas experience decreases in their core and total area. This is the case both within the protected areas and in the buffer zone. Metrics pertaining to aggregation (Table 4) reveal that arable areas and pastures did not only shrink between 2000 and 2018, but it also became more fragmented. It is true that the number of patches (NP) decreased as a result of a reduction in the total arable land area of 6.5% (in PAs) and 5.10% (in PABs), and of pastures, meadows, and mixed crops by 9.5% and 13.8%. However, the splitting index, which increases with more fragmented patches, rose by more than 2000 for arable land and more than 10,000 for pastures and mixed crops in PAs. In the PABs, the splitting index of pastures and mixed crops increased by over 43,000 from 2000 to 2018. These changes in value suggest an increasing fragmentation of these areas. Overall, land cover changes within protected areas were less frequent than outside (Figure 5), although they still amounted to 143,859 hectares (1.24% of all national forms of protected areas) from 2012 to 2018. In some parts of Europe, urbanization and intensification of agriculture still accounted for up to 25% of land cover changes within protected areas [21]. There is no such problem in Poland. Urbanization and intensification of agriculture accounted only for 5.6%, 7.2%, and 5.3% of land cover changes within protected areas in three analyzed periods.
Sustainability 14 00753 g009 550
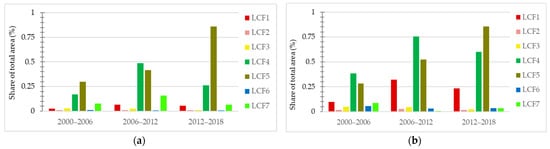
Figure 5. Land cover flows (LCFs) in protected areas (PAs) (a) and 1 km protected area buffers (PABs) (b) as shares of total areas. LCF1 = Urbanization, LCF2 = Intensification of agriculture, LCF3 = Extensification of agriculture, LCF4 = Afforestation, LCF5 = Deforestation, LCF6 = Formation of water bodies, LCF7 = naturalization or land reclamation.
The results of land cover flows (LCFs) in various forms of protected areas and 1 km protected area buffers (PABs) showed that land cover changes were the most frequent in Natura 2000 sites (altogether for bird and habitat sites, it was 3.8% of the area in the period 2012–2018 and 4.5% of the area in the period 2006–2012) (Figure 6). This is understandable to some extent, as economic and construction activities are permitted in these areas as long as it does not endanger the habitat or species for which they are established. It is worrying that these changes are greater than in unprotected (buffer) sites.
Sustainability 14 00753 g010 550
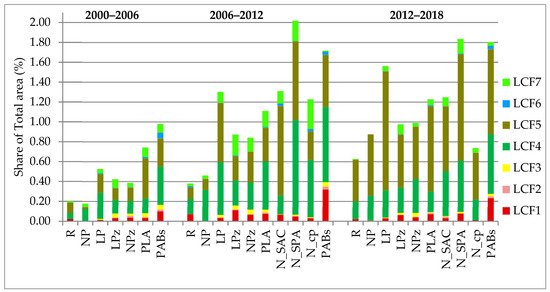
Figure 6. Land cover flows (LCFs) in various forms of protected areas and 1 km protected area buffers (PABs) as shares of total modeled areas. R = Nature reserves, NP = National parks, LP = Landscape parks, LPz/ NPz = parks buffer zones, PLA = Protected landscape areas, N_SAC = Natura 2000 Habitats Special Areas of Conservation, N_SPA = Natura 2000 Birds Special Protection Areas, N_cp = Natura 2000 common part of Bird and Habitat Areas. LCF1 = Urbanization, LCF2 = Intensification of agriculture, LCF3 = Extensification of agriculture, LCF4 = Afforestation, LCF5 = Deforestation, LCF6 = Formation of water bodies, LCF7 = Naturalization/Land reclamation.
Nevertheless, the national forms of nature protection adopted in Polish law can be considered effective. National reserves, national parks, and landscapes are subject to slight urbanization changes (LCF 1). The transformations of agricultural and forest areas into anthropogenic areas are the greatest threat and the image of urbanization pressure. In this context, the greatest pressures were recorded in the buffer areas. However, on the other hand, human settlements increased around almost every protected area, potentially increasing human activity along the edges of protected areas and threatening their ecological integrity. Urban expansion around protected areas varied, but overall, their area increased by almost 49% between 2000 and 2018. In protected areas, this increase was even greater (85%), so that the share of urbanized areas in the structure of land use increased by almost 1.5%.

References

  1. Watson, J.E.M.; Dudley, N.; Segan, D.B.; Hockings, M. The performance and potential of protected areas. Nature 2014, 515, 67–73.
  2. Loomis, J.; Echohawk, J. Using GIS to identify under-represented ecosystems in the National Wilderness Preservation System in the USA. Environ. Conserv. 1999, 26, 53–58.
  3. DeFries, R.; Hansen, A.; Turner, B.L.; Reid, R.; Liu, J. Land use change around protected areas: Management to balance human needs and ecological function. Ecol. Appl. 2007, 17, 1031–1038.
  4. Costanza, R.; d’Arge, R.; De Groot, R.; Farber, S.; Grasso, M.; Hannon, B.; Van Den Belt, M.; Paruelo, J.; Raskin, R.G.; Sutton, P.; et al. The value of the world’s ecosystem services and natural capital. Nature 1997, 387, 253–260.
  5. Gray, C.L.; Hill, S.L.L.; Newbold, T.; Hudson, L.N.; Börger, L.; Contu, S.; Hoskins, A.J.; Ferrier, S.; Purvis, A.; Scharlemann, J.P.W. Local biodiversity is higher inside than outside terrestrial protected areas worldwide. Nat. Commun. 2016, 7, 12306.
  6. Stolton, S.; Dudley, N.; Belokurov, A.; Deguignet, M.; Burgess, N.D.; Hockings, M.; Leverington, F.; MacKinnon, K.; Young, L. Lessons learned from 18 years of implementing the management effectiveness tracking tool (Mett): A perspective from the mett developers and implementers. Parks 2019, 25, 79–92.
  7. Eken, G.; Bennun, L.; Brooks, T.; Darwall, W.R.T.; Fishpool, L.D.C.; Foster, M.; Knox, D.; Langhammer, P.; Matiku, P.; Radford, E.; et al. Key Biodiversity Areas as Site Conservation Targets. BioScience 2004, 54, 1110–1118.
  8. Hansen, A.J.; DeFries, R. Land Use Change around Nature Reserves: Implications for Sustaining Biodiversity. Ecol. Appl. 2007, 17, 972–973.
  9. Le Saout, S.; Hoffmann, M.; Shi, Y.; Hughes, A.; Bernard, C.; Brooks, T.M.; Bertzky, B.; Butchart, S.H.M.; Stuart, S.N.; Badman, T.; et al. Protected Areas and Effective Biodiversity Conservation. Science 2013, 342, 803–805.
  10. Barnes, M.D.; Craigie, I.D.; Harrison, L.B.; Geldmann, J.; Collen, B.; Whitmee, S.; Balmford, A.; Burgess, N.D.; Brooks, T.; Hockings, M.; et al. Wildlife population trends in protected areas predicted by national socio-economic metrics and body size. Nat. Commun. 2016, 7, 12747.
  11. Geldmann, J.; Coad, L.; Barnes, M.D.; Craigie, I.D.; Woodley, S.; Balmford, A.; Burgess, N.D.; Knights, K.; Masica, M.; McRae, L.; et al. A global analysis of management capacity and ecological outcomes in terrestrial protected areas. Conserv. Lett. 2018, 11, e12434.
  12. Kearney, S.; Adams, V.; Fuller, R.; Possingham, H.; Watson, J. Estimating the benefit of well-managed protected areas for threatened species conservation. Oryx 2020, 54, 276–284.
  13. Craigie, I.D.; Baillie, J.E.M.; Balmford, A.; Carbone, C.; Collen, B.; Green, R.E.; Hutton, J.M. Large mammal population declines in Africa’s protected areas. Biol. Conserv. 2010, 143, 2221–2228.
  14. Figueroa, F.; Sánchez-Cordero, V. Effectiveness of natural protected areas to prevent land use and land cover change in Mexico. Biodivers. Conserv. 2008, 17, 3223.
  15. Liu, J.; Linderman, M.; Ouyang, Z.; An, L.; Yang, J.; Zhang, H. Ecological Degradation in Protected Areas: The Case of Wolong Nature Reserve for Giant Pandas. Science 2011, 292, 5514.
  16. Clark, N.E.; Boakes, E.H.; McGowan, P.J.K.; Mace, G.M.; Fuller, R.A. Protected Areas in South Asia Have Not Prevented Habitat Loss: A Study Using Historical Models of Land-Use Change. PLoS ONE 2013, 8, e65298.
  17. Reisig, D.; Mullan, K.; Hansen, A.; Powell, S.; Theobald, D.; Ulrich, R. Natural amenities and low-density residential development: Magnitude and spatial scale of influences. Land Use Policy 2021, 102, 105285.
  18. Zydron, A.; Antkowiak, M.; Lisiak, M.; Szczepański, P. The analysis of urban pressure on protected areas on the example of Puszczykowo commune. Studia I Pr. WNEIZ US 2016, 46, 409–422.
  19. Karen, B.M.; McCleery, R.A.; Binford, M.W.; Zweig, C. Land-cover change within and around protected areas in a biodiversity hotspot. J. Land Use Sci. 2015, 11, 154–176.
  20. Adhikari, A.; Hansen, A.J. Land use change and habitat fragmentation of wildland ecosystems of the North Central United States. Landsc. Urban Plan. 2018, 177, 196–216.
  21. Hellwig, N.; Walz, A.; Markovic, D. Climatic and socioeconomic effects on land cover changes across Europe: Does protected area designation matter? PLoS ONE 2019, 14, e0219374.
  22. Fan, X.; Jiaa, Z.; Daib, X.; Sun, N.; Han, F.; Lu, J. Ecological quality dynamics around marine reserves in the Bohai Sea coastal zone and their relationship with landscape artificialization. Glob. Ecol. Conserv. 2019, 20, e00778.
  23. UNEP-WCMC; IUCN. Protected Planet: The World Database on Protected Areas (WDPA). Protected Area Profile for Poland. May 2021. Available online: www.protectedplanet.net (accessed on 5 May 2021).
  24. Nationally designated areas (CDDA) Reported 2020 provided by European Environment Agency (EEA). Available online: https://www.eea.europa.eu/data-and-maps/data/nationally-designated-areas-national-cdda-15 (accessed on 7 May 2021).
  25. Jongman, R.H.G. Nature conservation planning in Europe: Developing ecological networks. Landsc. Urban Plan. 1995, 32, 169–183.
  26. Formy Ochrony Przyrody (EN: Forms of Nature Protection). General Directorate for Environmental Protection. Available online: https://www.gov.pl/web/gdos/formy-ochrony-przyrody (accessed on 10 May 2021).
  27. Central Register of the Forms of Nature Protection. Available online: crfop.gdos.gov.pl (accessed on 29 March 2021).
  28. Conservation Status of Habitat Types Datasets from Article 17, Habitats Directive 92/43/EEC Reporting Provided by EEA. Available online: https://www.eea.europa.eu/data-and-maps/data/article-17-database-habitats-directive-92-43-eec-2 (accessed on 10 May 2021).
  29. Luque, Z.S.; Kostecka, J. Biodiversity loss, the causes, the state and basic form of nature protection in Spain and Poland. Pol. J. Sustain. Dev. 2018, 22, 75–84.
  30. Hansen, A.J.; Piekielek, N.; Davis, C.; Haas, J.; Theobald, D.M.; Gross, J.E.; Monahan, W.B.; Olliff, T.; Running, S.W. Exposure of U.S. National Parks to land use and climate change 1900–2100. Ecol. Appl. 2014, 24, 484–502.
  31. The Nature Conservation Act of 16 April 2004. Journal of Laws No. 151, Item 1220, as Amended. Available online: https://isap.sejm.gov.pl/isap.nsf/download.xsp/WDU20040920880/U/D20040880Lj.pdf (accessed on 10 May 2021).
  32. Jager, A.L. Preparing CORINE Land cover Data for use. JRS Scientific and Technical Reports; Publications Office of the European Union: Luxembourg, 2012; Available online: https://core.ac.uk/download/pdf/38627375.pdf (accessed on 4 April 2021).
More
Video Production Service