Under the Kyoto Protocol which is international law since 2005, 15 EU member countries (the "EU-15") committed to reducing their collective emissions of a set of six greenhouse gases in the 2008-2012 period to 8% below the 1990 level. The EU established the first cap-and-trade system for carbon dioxide emissions in the world in 2005. This entry uinvestigates the effect of the European Union Emissions Trading System (EU ETS) on carbon dioxide (CO2) emissions for the European Union using a cross-country panel data set consisting of 12 countries extracted from the EU-15 from 1980 to 2009.
- Sustainable Development
- Carbon Dioxide Emission
- European Union Emissions Trading System
- Environmental Kuznets Curve
1. Introduction
The relationship between development and the planet’s atmosphere has been a highly controversial issue since the 1990s (Uğurlu,2019a, Uğurlu 2019b)[1][2]. Development is one of the main goals of economies within a framework of economic growth and increasing international trade, and it must be sustainable to achieve.
One main problem in this context refers to the question, “What is sustainable development?” The Brundtland Report (1987) refers to sustainable development as "development that meets the needs of the present without compromising the ability of future generations to meet their own needs," and Chichilnisky (1977)[3] introduced the concept of basic needs. That is the core of sustainable development Solow (1993)[4] stated that sustainability has been mainly an occasion for the expression of emotions and attitudes with very little formal analysis of sustainability or sustainable paths for a modern industrial economy (Chichilnisky, 1997)[5] defined sustainable development in formal, analytical terms.
2. Theory
The Rio 1992 and Kyoto 1997 UN conferences have outlined concerns of the environmental effects of sustainable development, especially for developing countries. The carbon market of the United Nations Kyoto Protocol that was designed and authored by Graciela Chichilnisky in 1997 was voted by 165 nations in Kyoto (Chichilnisky, 2010)[6]. The objective of the 1997 Kyoto protocol was to reduce greenhouse gases (GHG) to the 1990 level during the period from 2008 to 2012.
Although the overall structure comes from the USA in the Kyoto Protocol, the USA did not have enough support to pass federal cap-and-trade legislation. Also, Japan and Australia are in the same situation (World Bank, 2011)[7]. However, in 2012 California launched its cap-and-trade program and it is expected that the program will reduce greenhouse gas emissions from regulated entities by more than 16 percent between 2013 and 2020.
In 2005, 15 EU member countries (the "EU-15") committed to reducing their collective emissions and the European Union Emissions Trading System was launched on January 1, 2005, the Kyoto Protocol entered into force six weeks later as international law. The UK’s voluntary emission trading scheme, which started in March 2002, is the longest operating GHG trading program in the World (World Bank, 2005)[8]. In the USA California has had a mandatory carbon market since 2013. The first phase of EU ETS continues to December 31, 2007, and regulates CO2 emissions from installations representing some 40% of the EU emissions. Germany has almost one-quarter of all the European Union Allowances (EUAs), while the UK, Poland and Italy have almost 10% each (World Bank, 2006)[9]. Norway, Liechtenstein and Iceland, all part of the European Economic Area, joined the EU ETS in Phase II in 2005-2007 (World Bank, 2008)[10].
The EU ETS works on the 'cap and trade' principle. Definition of a cap is set on the total amount of certain greenhouse gases that can be emitted by the factories, power plants and other installations in the system[1]. Absolute limit on the amount of GHG is set by the government which is in the ETS. The true cost of carbon emissions is tried to estimate to provide price signals. Koop and Tole (2012)[11] stated that carbon permits can be traded on financial markets. If companies’ CO2 emissions exceed their allowable limit they can purchase additional permits. Although in this paper impact of the carbon market on CO2 emission is investigated there is growing literature to investigate carbon permits in the carbon market as a financial asset.
Indeed the overall structure follows a market strategy, is modified by a more favourable treatment of the developing nations in terms of no emission limits and the addition of the Clean Development Mechanism (CDM). The CDM as a tool for nations to receive credits for proven emission reduction projects that are carried out in developing nations:
“The CDM is the crucial link between emissions reduction and the broader goal of sustainable development. The Kyoto Protocol stipulates that all CDM projects must be able to demonstrate tangible sustainable development benefits for the host country.”(Chichilinsky, 2009)[12]
The CDM connects global emissions reduction to the broader goal of sustainable development. The World Energy Outlook 2010 has estimated that within one year the global cost of keeping average global temperature warming below 2˚C in comparison to preindustrial levels has increased by $1 trillion over the 2010–2030 period. Because GHGs mix uniformly in the atmosphere, reducing emissions is the equivalent problem of any country in the world, and several governments have taken steps to achieve it. Most of the regulations constraining GHG emissions take advantage of this property of “sustainability.”
The link between economic growth and environmental degradation is deep and is frequently discussed both in the theoretical and empirical literature. As a part of global environmental degradation, global warming is one of the main concerns of the world. Holtz-Eakin and Selden (1995)[13] state the existence of proponents and opponents of reducing the emission of greenhouse gases. Opponents argue that efforts to control emissions may also reduce economic growth and development. The relations[14] Selden and Song (1994)[15], Shafik and Bandyopadhyay (1992)[16], Panayotou (1993)[17] and many other authors found an inverted U-shaped relationship between income and environmental pollution and Panayotou named the inverted U-shaped relationship as an environmental Kuznets (1965)[18] curve (EKC). After the 1990s, this relationship was addressed under the name of EKC and the majority of papers empirically use the panel data approach.
However, according to the International Energy Agency (IEA) (2012)[19] global CO2 emissions rose by 4.6% in 2010, after having declined in 2009 due to the impact of the financial crisis. Another research supports that CO2 is increasing globally; Marland et al. (2012)[20] present global annual CO2 emission estimates using the methods of Marland and Rotty (1984) and show that CO2 emissions are increasing in industrial motion. Although many studies support the EKC hypothesis, Stern (2004)[21] asserts the weakness of the econometric method of most of the EKC literature; in particular, these studies have paid no attention to serial dependence or stochastic trends in time series. Stern (2004)[21] investigates econometric criticisms of the EKC in four main categories: heteroskedasticity, simultaneity, omitted variables bias, and cointegration issues. Stern and Common (2001)[22] find that the EKC is an inadequate model and that estimates of the EKC in levels can suffer from significant omitted variables bias. Moreover, Fosten et al. (2012) mention that because of the absence of unit root tests and cointegration analysis there is the possibility of the ‘spurious’ regression problem in previous studies. Another study asserting the claim that these studies have problems in terms of econometric estimation is the one by Pao and Tsai (2011)[23].
Since this topic has been a widely investigated issue in the past two decades and there is an extensive review of previous literature, we do not review all previous studies. Considering CO2 emissions and global warming are increasing globally, our expectations are twofold: to show income level and CO2 emissions are positively sloped and to find a signal that indicates a decrease in CO2 emissions after 2005 in the EU due to the ETS commitment.
3. The Data
The researchers use two variables: CO2, CO2 emissions (metric tons per capita); GDPP, GDP per capita (constant 2005 international $) as an income level. We use a panel data set consisting of 12 countries[2] which are extracted from the EU15 excluding Germany, Ireland and Luxembourg covering the period 1980-2009. This sample period was selected for data availability, and Germany and Ireland were omitted because of missing data in the data source. All of these data are collected from The World Bank World Development Indicators (WDI).
Figure 1 is the scatter diagram of GDP per capita and CO2 emissions (metric tons per capita) and shows that Luxembourg is an outlier for the panel of the countries.
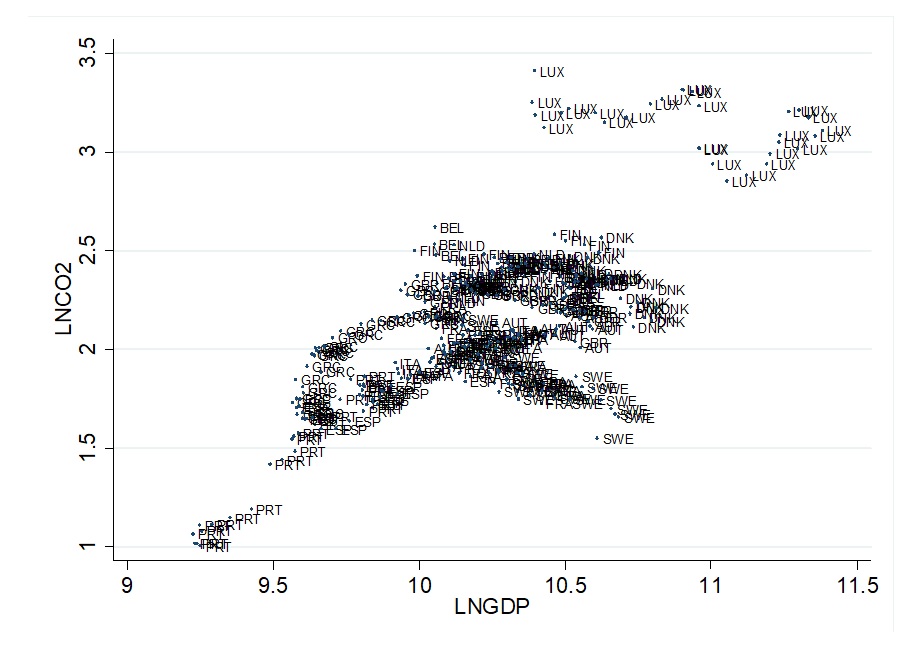
Figure 1:Scatter Diagram LNCO2 with LNGDP
Figure 2 shows the country by country graph. The graph is useful to understand the different movements of the countries. While some countries have an increasing trend some others have a decreasing trend.
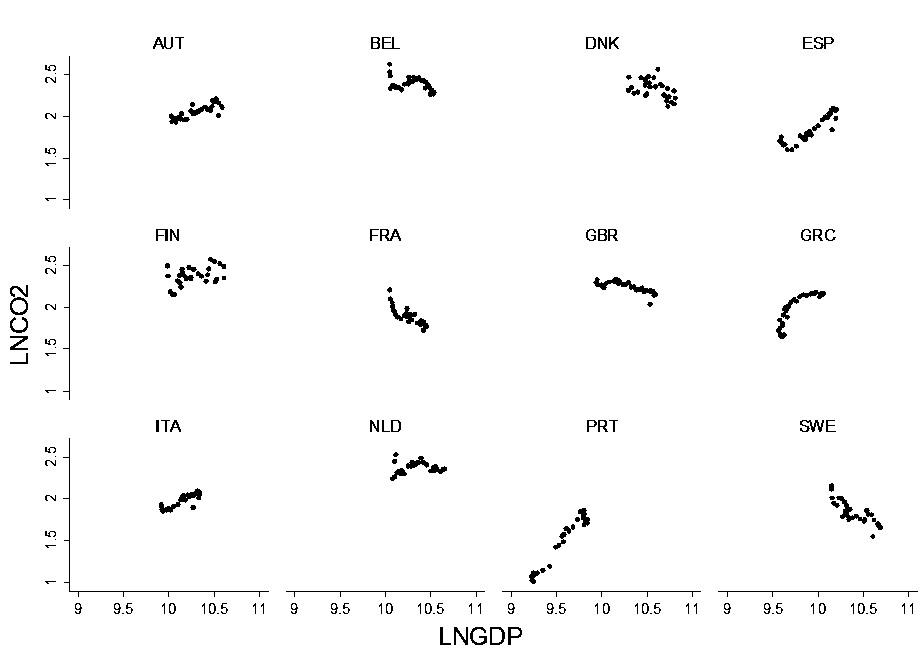
Figure 2: Scatter Diagram LNCO2 and LNGDP by Countries
4. Conclusion
The main factor determining CO2 emissions is economic growth, and that is why the GDP per capita correlated with CO2 emissions. In this paper, we aimed to determine the reducing effect of EU ETS on CO2 emissions in European countries.
References
- Uğurlu, E. (2019a). Greenhouse Gases Emissions and Alternative Energy in the Middle East. In H. Qudrat-Ullah & A. A. Kayal (Eds.), Climate Change and Energy Dynamics in the Middle East: Modeling and Simulation-Based Solutions (pp. 259–291). Springer International Publishing. https://doi.org/10.1007/978-3-030-11202-8_9
- Uğurlu, E. (2019b). Renewable Energy Strategies for Sustainable Development in the European Union. In D. Kurochkin, E. V. Shabliy, & E. Shittu (Eds.), Renewable Energy: International Perspectives on Sustainability (pp. 63–87). Springer International Publishing. https://doi.org/10.1007/978-3-030-14207-0_3
- Chichilnisky, Graciela; Economic Development and Efficiency Criteria in the Satisfaction of Basic Needs. Applied Mathematical Modelling 1977, 1, 290-297.
- Solow, Robert; An almost practical step toward sustainability. Resources Policy 1993, 19(3), 162-172.
- Chichilnisky, Gracilea; What is sustainable development. Land Economics 1997, 73(4), 467-491.
- Chichilnisky, G., (2010) “The Missing Signal: How Ecological Prices Change Markets and Decision Making” 6th Ministerial Conference on Environment and Development in Asia and the Pacific, September 3.
- World Bank, (2011) “State and Trends of Carbon Market 2008”, The World Bank Institute, Washington DC
- World Bank, (2005) “State and Trends of Carbon Market 2005”, World Bank Carbon Finance Business. International Emissions Trading Association, Washington DC
- World Bank, (2006) “State and Trends of Carbon Market 2006”, World Bank Carbon Finance Business. International Emissions Trading Association, Washington DC
- World Bank, (2008) “State and Trends of Carbon Market 2008”, The World Bank Institute, Washington DC
- Koop, Gary & Tole, Lise, (2011). "Forecasting the European Carbon Market," SIRE Discussion Papers 2011-20, Scottish Institute for Research in Economics (SIRE).
- Chichilnisky G. and Sheeran K. A. (2009) “Saving Kyoto: An Insider's Guide to What it is, How it Works and What it Means for the Future”, London, New Holland Publishers Ltd. 208pp
- Rafael E. De Hoyos, Vasilis Sarafidis; Stoking the fires? CO2 emissions and economic growth. Journal of Public Economics 2006, 57(1), 85-101.
- Grossman, G.M. and Krueger A.B., (1991) “Environmental Impacts of A North American Free Trade Agreement” Working Paper No. 3914, National Bureau of Economic Research.
- Selden, T.M. and Song D., (1994) “Environmental quality and development: Is there a Kuznets curve for air pollution?” Journal of Environmental Economics and Management, 27 (2), 147–162
- Thomas, Selden and Song, Daqing; Environmental quality and development: Is there a Kuznets curve for air pollution?. Journal of Environmental Economics and Management 1994, 27(2), 147-162.
- Panayotou T. , (1993) “Empirical tests and policy analysis of environmental degradation at different stages of economic development”. ILO, Technology and Employment Programme
- Kuznets, s. 1955, Economic growth and income inequalityAmerican Economic Review, 45 (1) (1955), pp. 1-28
- IEA, (2012), Co2 Emissions From Fuel Combustion Highlights, International Energy Agency, OECD/IEA Paris
- Marland, G. , Boden, T.A., and Andres R.J. (2010) “Global, Regional, and National Fossil-Fuel CO2 Emissions”. Carbon Dioxide Information Analysis Center, Oak Ridge National Laboratory, U.S. Department of Energy, Oak Ridge, Tenn., U.S.A. doi 10.3334/CDIAC/00001_V2010
- Stern D., (2004) “The rise and fall of the environmental Kuznets curve”, World Development , Volume: 32, 1419-1439.
- Stern, D. I., and Common, M. S. (2001). Is there an environmental Kuznets curve for sulfur?, Journal of Environmental Economics and Management, 41, 162–178.
- Pao, H. T., and Tsai, C.-M. (2011) “Multivariate Granger causality between CO2 emissions, energy consumption, FDI (foreign direct investment) and GDP (gross domestic product): Evidence from a panel of BRIC (Brazil, Russian Federation, India, and China) countries”, Energy, 36, 685-693.