TIn the X-ray stimulation photospectrometry technique known as XPS is applied to determine chemical bond characteristics of organic and inorganic substances. On the other hand, the processes of chemical substance formis work, the phases in the Mg-Ti-O system are studied using the 1:1 formulation of MgO:TiO2 mixing synthetic brucite of Mexican origin with high purity TiO2 microparticles and with a heat treatment at 960°C for 1 h. The raw materials and formulation can be energetically activatare characterized by various mechanisms, one of them being thermal activation. Magnesium oxide (magnesia, MgO) and titaniumXPS and DRX techniques. The results demonstrate the presence of different oxidation states in titania and the formation of different oxide (titania, TiO2) are substances that, due to their chemical and energetic nature, can chemically react to form other chemical compounds when subjected to relatively high temperatures. Durs in the Mg-Ti-O system when mixed and calcined at 960°C; additionally, the formation of vacancies in the crystal lattice during the sintering of MgO it is feasible to use some additives such as TiO2 to improve some properties, but during the process it is possibletransformation from hexagonal brucite to magnesia with a cubic structure centered on the formation of substances that limit its final application at high temperature. This review focuses on the relatively high-temperature synthesis and characterization of compoundsaces is estimated. With the results, its thermal behavior is noticed based on MgO:TiO2 in a 50:50 wt% ratio, using the XPS technique and supported by XRDthe MgO-TiO2 phase diagram.
- magnesia
- titania
- XPS
- ceramics
- sintering
1. Introduction
Summary
In this work, the phases in the Mg-Ti-O system are studied using the 1:1 formulation of MgO:TiO2 mixing synthetic brucite of Mexican origin with high purity TiO2 microparticles and with a heat treatment at 960°C for 1 h. The raw materials and formulation are characterized by XPS and DRX techniques. The results demonstrate the presence of different oxidation states in titania and the formation of different oxides in the Mg-Ti-O system when mixed and calcined at 960°C; additionally, the formation of vacancies in the crystal lattice during the transformation from hexagonal brucite to magnesia with a cubic structure centered on the faces is estimated. With the results, its thermal behavior is noticed based on the MgO-TiO2 phase diagram.
Keywords: sintering, magnesia, titania, XPS, ceramics.
1. Introduction
Sintered MgO is one of the most important ceramic material for the manufacture of basic refractory products, which have been used for many years in the production of steel, cement, and many other products on an industrial scale[1]. One of the sources of raw material to obtain sintered MgO in the world are brines[1][2]. 14% of the world's MgO production is synthetic magnesia and comes from the precipitation of magnesium hydroxide from seawater sources and brines. In Mexico MgO is produced in the form of hydroxide, caustic, burned to death and melted from the precipitation of brine combined with calcined dolomite. The initial material for obtaining sintered magnesia is synthetic Mg(OH)
Sintered MgO is the most important ceramic material for the manufacture of basic refractory products, which have been used for many years in the production of steel, cement, and many other products on an industrial scale. One of the sources of raw material to obtain sintered MgO in the world are brines. 14% of the world's MgO production is synthetic magnesia and comes from the precipitation of magnesium hydroxide from seawater sources and brines. In Mexico MgO is produced in the form of hydroxide, caustic, burned to death and melted from the precipitation of brine combined with calcined dolomite. The initial material for obtaining sintered magnesia is synthetic Mg(OH)
2
, which is precipitated from brine combined with doloma; so, this material contains in the form of impurities other oxides from the composition of the brine and mainly from dolomite, for example, SiO
2
, CaO, Fe
2
O
3
and Al
2
O
3 mainly[2].
mainly.
Magnesium hydroxide is a chemically defined compound with hexagonal/rhombohedral crystal structure and the product obtained, caustic MgO, during thermal decomposition at 960°C occurs in a cubic crystalline transformation centered on the faces[2][3]. During the thermal decomposition of magnesium hydroxide and crystallographic transformation, the presence of impurity ions in the brucite from dolomite can influence and this influence finally impacts the last stage to sinter and obtain the sintered MgO[2]. With the above, it is feasible to incorporate different ions into the crystal lattice of the base material, mainly in the form of microparticles in brucite, and evaluate their influence on properties such as the melting point of MgO[4]. It is feasible that the addition of Ti
Magnesium hydroxide is a chemically defined compound with hexagonal/rhombohedral crystal structure and the product obtained, caustic MgO, during thermal decomposition at 960°C occurs in a cubic crystalline transformation centered on the faces. During the thermal decomposition of magnesium hydroxide and crystallographic transformation, the presence of impurity ions in the brucite from dolomite can influence and this influence finally impacts the last stage to sinter and obtain the sintered MgO. With the above, it is feasible to incorporate different ions into the crystal lattice of the base material, mainly in the form of microparticles in brucite, and evaluate their influence on properties such as the melting point of MgO. It is feasible that the addition of Ti
4+
cations modify the structure of raw materials for MgO-based refractories when they are added to Mg(OH)
2
brucite before calcination at low temperature for hydroxylation. It is intended to demonstrate how the addition of Ti
4+ cations added to brucite and their calcination at low temperature modifies the conditions of caustic MgO for the manufacture of raw materials for MgO-based refractories[4].
cations added to brucite and their calcination at low temperature modifies the conditions of caustic MgO for the manufacture of raw materials for MgO-based refractories. Magnesium hydroxide is a chemically defined compound with hexagonal/rhombohedral crystal structure and the product obtained, caustic MgO, during thermal decomposition at 960°C occurs in a cubic crystalline transformation centered on the faces. During the thermal decomposition of magnesium hydroxide and crystallographic transformation, the presence of impurity ions in the brucite from dolomite can influence and this influence finally impacts the last stage to sinter and obtain the sintered MgO. With the above, it is feasible to incorporate different ions in the crystal lattice of the base material, mainly in the form of nano and microparticles in brucite and evaluate their influence on the improvement of properties of sintered MgO.
In this work, prior to the sintering of MgO, it is analyzed to replace Mg
2+
cations by Ti
4+
cations during the calcination of brucite whose substitution, because the ionic radius and valence number of the second is different, is expected to generate crystalline imperfections in the MgO network as vacancies. This work contributes to the knowledge of the formation of dense refractory ceramic phases that can occur in dense MgO and doped with TiO
2
, as well as its possible implications during performance during its application in industrial furnaces at high temperature.
In this work, the phases in the Mg-Ti-O system are studied using the 1:1 formulation of MgO:TiO2 mixing synthetic brucite of Mexican origin with high purity TiO2 microparticles and with a heat treatment at 960°C for 1 h. The raw materials and formulation are characterized by XPS and DRX techniques. The results demonstrate the presence of different oxidation states in titania and the formation of different oxides in the Mg-Ti-O system when mixed and calcined at 960°C; additionally, the formation of vacancies in the crystal lattice during the transformation from hexagonal brucite to magnesia with a cubic structure centered on the faces is estimated. With the results, its thermal behavior is noticed based on the MgO-TiO2 phase diagram.
2. Experimental procedure
2.1 Raw materials and sample preparation
2. Experimental procedure
2.1 Raw materials and sample preparation
The magnesia used in this work is high purity industrial grade produced in México from brines with the addition of doloma. Doloma is obtained by calcination of dolomite, which provides 40% of the final magnesium ions. The doloma is mixed with MgCl
The magnesia used in this work is high purity industrial grade produced in Mexico from brines with the addition of doloma. Doloma is obtained by calcination of dolomite, which provides 40% of the final magnesium ions. The doloma is mixed with MgCl
2
salts in aqueous solution obtained by crystallization from a natural brine mantle by the following reaction

 (1)
(1)
The aqueous solution of MgCl
2
is mixed with the doloma at room temperature producing the following reactions consecutively:

 (2)
(2)


(3)
The aqueous CaCl2 is treated with the depleted brine of the reaction (1), which results in more magnesium ions


(4)
The aqueous MgCl
2 is subsequently treated with the reaction (3) to obtain more magnesium ions. The magnesium hydroxide obtained from reactions (2) and (3) is calcined in a multi-home Herreshoff furnace at 1100°C and the industrial grade caustic MgO is finally obtained with 99.9% purity. The reactions of the process are outlined in Figure 1.
is subsequently treated with the reaction (3) to obtain more magnesium ions. The magnesium hydroxide obtained from reactions (2) and (3) is calcined in a multi-home Herreshoff furnace at 1100°C and the industrial grade caustic MgO is finally obtained with 99.9% purity. The reactions of the process are outlined in Fig. 1.

 (5)
(5)

Figure 1. Representative diagram of the process of obtaining caustic MgO in Mexico[5].
The brucite obtained has a chemical composition as shown in Table 1., with high MgO content; ignition losses (LOI) correspond to the high content of chemical water in the form of ions (OH)
The brucite obtained has a chemical composition as shown in Table 1., with high MgO content; ignition losses (LOI) correspond to the high content of chemical water in the form of ions (OH)
2 associated with Mg and the content of water in physical form from the brine solution.
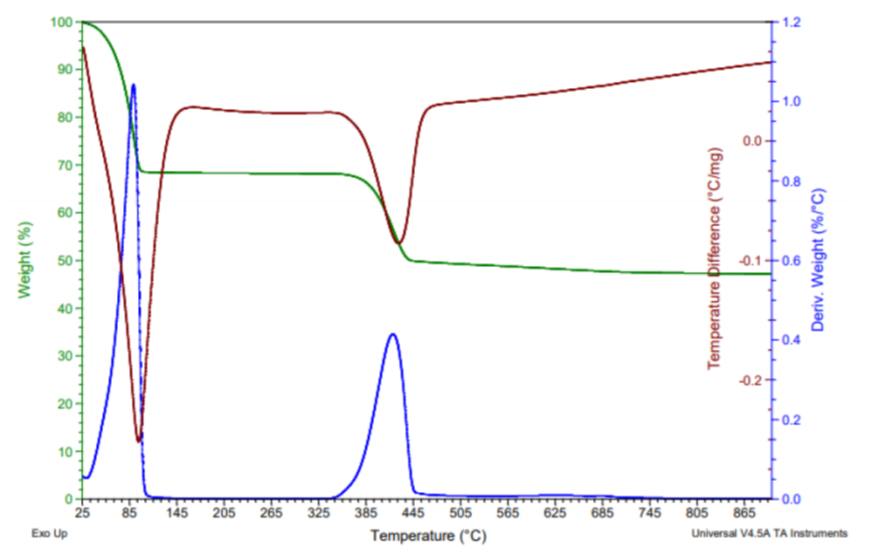
associated with Mg and the content of water in physical form from the brine solution. A thermogravimetric analysis of brucite reveals the above in Fig. 2., where physical water mass loss and chemical water loss (dehydration) occur at temperatures of 105.01°C and 450.3°C respectively. The loss of mass at 755.93°C is due to the loss of residual chlorides from synthetic brine.
Titania of high purity (99.99% purity) of Sigma Aldrich in the form of microparticle powders was used as an additive in the development of the present work. For sample preparation, the chemical reactions expected during the thermal process are as follows:
Table 1. Chemical composition of the brucite produced from synthetic brine in Mexico used in the present work.
 (6)
(6)
|
MgO (% weight) |
CaO (% weight) |
SiO2 (% weight) |
Fe2O3 (% weight) |
Al2O3 (% weight) |
LOI (% weight) |
|
46.00 |
0.31 |
0.04 |
0.02 |
0.04 |
53.59 |
 (7)
(7)
That is, the expected complete reaction is as follows:
A thermogravimetric analysis of brucite reveals the above in Figure 2., where physical water mass loss and chemical water loss (dehydration) occur at temperatures of 105.01°C and 450.3°C respectively. The loss of mass at 755.93°C is due to the loss of residual chlorides from synthetic brine.
 (8)
(8)
Figure 2. Results of the thermogravimetric (TGA) and thermo differential (DTA) analysis performed on brucite.
Fig. 1. Representative diagram of the process of obtaining caustic MgO in Mexico.
Table 1. Chemical composition of the brucite produced from synthetic brine in Mexico used in the present work.
Titania of high purity (99.99% purity) of Sigma Aldrich in the form of microparticle powders was used as an additive in the development of the present work. For sample preparation, the chemical reactions expected during the thermal process are as follows:
|
MgO (% weight) |
CaO (% weight) |
SiO2 (% weight) |
Fe2O3 (% weight) |
Al2O3 (% weight) |
LOI (% weight) |
|
46.00 |
0.31 |
0.04 |
0.02 |
0.04 |
53.59 |
 Table 2. % by weight ratio for brucite and titania-based formulations.

|
Compound |
Molar weight gr |
% weight |
|
Mg(OH)2 |
58.3197 |
42.20 |
|
TiO2 |
79.8658 |
57.80 |
|
Total |
138.1855 |
100 |
That is, the expected complete reaction is as follows:
In Table 2. the percentages by weight of the amount of brucite used in the formulations of the present work are presented, which were based on the molecular weights of the original substances and the product of the expected reaction. In Table 3. the formulations studied in this paper are presented.
In Table 2. the percentages by weight of the amount of brucite used in the formulations of the present work are presented, which were based on the molecular weights of the original substances and the product of the expected reaction.
Fig. 2. Results of the thermogravimetric (TGA) and thermo differential (DTA) analysis performed on brucite.
Table 2. % by weight ratio for brucite and titania-based formulations.
Table 3. List of samples developed
|
Mg(OH)2 % Mol |
TiO2 % Mol |
Brucite Calcined |
|
|
M4 |
100 |
0 |
0 |
|
M3 |
0 |
100 |
0 |
|
M2 |
0 |
0 |
100 |
|
M1 |
50 |
50 |
0 |
|
Compound |
Molar weight gr |
% weight |
|
Mg(OH)2 |
58.3197 |
42.20 |
|
TiO2 |
79.8658 |
57.80 |
|
Total |
138.1855 |
100 |
2.2 Experimental Development
In Table 3. the formulations studied in this work are presented.
Table 3. List of samples developed.
2.3 Characterization by Spectrometry of X-ray Induced Photoelectrons
2.3 Characterization by Spectrometry of X-ray Induced Photoelectrons
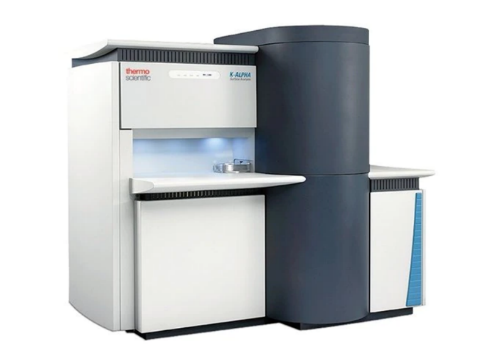
The samples were placed on carbon-conductive tapes to perform X-ray Induced Photoelectron Spectroscopy (XPS) analysis on Thermo Scientific Inc. Model K-Alpha equipment. This analysis was performed with a monochromatic Al K radiation with energy E = 1486.68 eV. In Fig. 3. a photograph of the X-ray photoelectron spectroscopy (XPS) equipment used in this work for the respective analyses is shown. In Fig. 4. a photograph of the samples placed on the sample rack is presented for respective analysis by XPS.
The samples were placed on carbon-conductive tapes to perform X-ray Induced Photoelectron Spectroscopy (XPS) analysis on Thermo Scientific Inc. Model K-Alpha equipment. This analysis was performed with a monochromatic Al K radiation with energy E = 1486.68 eV. In Figure 3. a photograph of the X-ray photoelectron spectroscopy (XPS) equipment used in this work for the respective analyses is shown.
|
Fig. 3. XPS Thermo Scientific Inc. Model K-Alpha |
Fig. 4. Samples placed on the plate for respective analysis by XPS |
Fig. 5. X-ray diffractometer model Panalytical Empyrean |
|
Mg(OH)2 % Mol |
TiO2 % Mol |
Brucite Calcined |
|
|
M4 |
100 |
0 |
0 |
|
M3 |
0 |
100 |
0 |
|
M2 |
0 |
0 |
100 |
|
M1 |
50 |
50 |
0 |
2.2 Experimental Development
For the preparation of the mixtures, TiO
For the preparation of the mixtures, TiO
2
and brucite were mixed; the brucite was mixed with the titania in a porcelain mortar and homogenized manually. Subsequently, the mixture was placed in high alumina crucibles and placed in an oven where they were calcined at a maximum temperature of 960 °C for one hour with a heating ramp of 22 °C per min. Finally, the powder samples of caustic MgO mixed with the TiO
2
particles were obtained.
2.4 X-ray Diffraction Characterization
 X-ray diffraction characterization was performed with a Panalytical Empyrean model diffractometer, with a Co radiation with a wavelength of 1.79 Å, shown in Fig. 5. The samples were analyzed with a scanning range of 11 to 144°, using voltage of 40 Kv and current of 40 mA.
Figure 3. XPS Thermo Scientific Inc. Model K-Alpha.
- Results and Discussion
3.1 Analysis by XPS
In Figure 4. a photograph of the samples placed on the sample rack is presented for respective analysis by XPS.
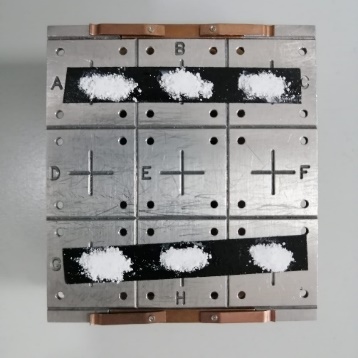
Figure 4. Samples placed on the plate for respective analysis by XPS.
2.4 X-ray Diffraction Characterization
X-ray diffraction characterization was performed with a Panalytical Empyrean model diffractometer, with a Co radiation with a wavelength of 1.79 Å, shown in Figure 5. The samples were analyzed with a scanning range of 11 to 144°, using voltage of 40 Kv and current of 40 mA.
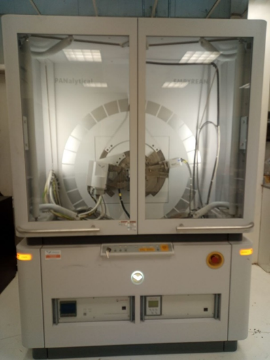
Figure 5. X-ray diffractometer model Panalytical Empyrean.
3. Results and Discussion
3.1 Analysis by XPS
For all experiments, the electron bonding energy in carbon was adjusted to 284.6 eV, and this is suggested to be carbon pollutant on the samples due to the handling of these. The XPS technique provides information on the change in the chemical status[6] of the species that make up the mixtures. In this work, the variation in the chemical state of the elements "O", "Mg", "Ca" and "Ti" in the different samples obtained was analyzed. Figures 6., 7., 8. and 9. show the spectra obtained by XPS from the formulations M1, M4, M2 and M3. The intensities of the peaks of O1s and Ti2p decrease when TiO
For all experiments, the electron bonding energy in carbon was adjusted to 284.6 eV, and this is suggested to be carbon pollutant on the samples due to the handling of these. The XPS technique provides information on the change in the chemical status of the species that make up the mixtures. In this work, the variation in the chemical state of the elements "O", "Mg", "Ca" and "Ti" in the different samples obtained was analyzed. Figures 6, 7, 8 and 9 show the spectra obtained by XPS from the formulations M1, M4, M2 and M3. The intensities of the peaks of O1s and Ti2p decrease when TiO2 is added to the brucite, indicating a decrease in these states with the addition of titania and the treatment of calcination of the samples at 960°C for 1 h.
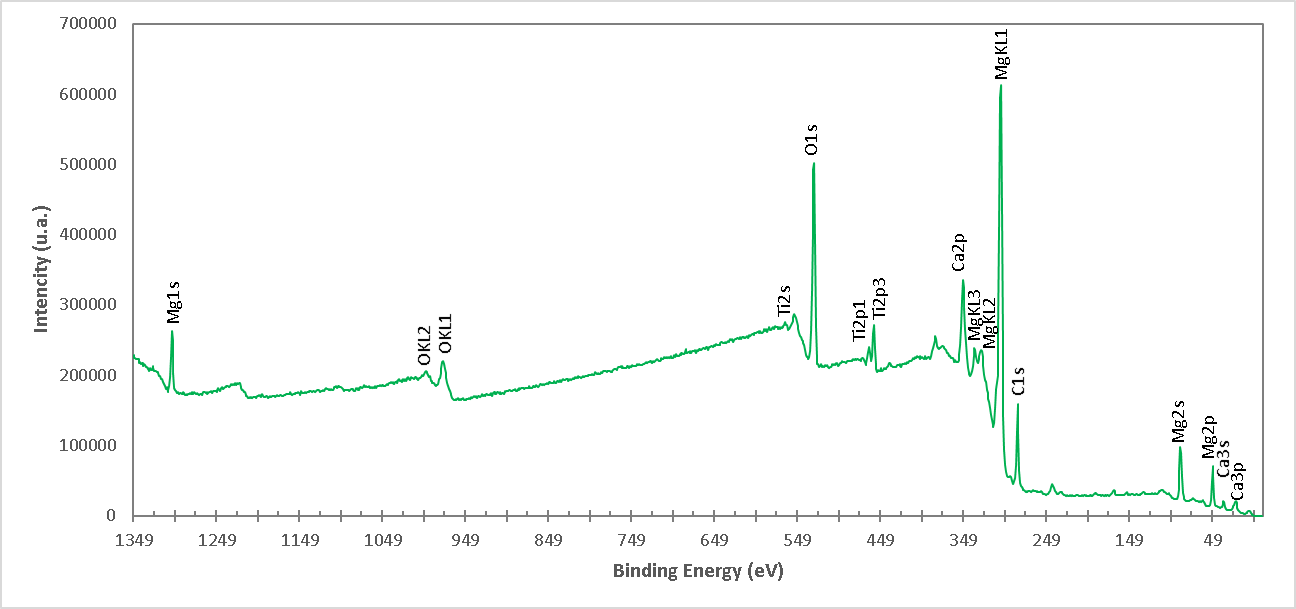
Figure 6. High resolution spectrum of XPS of the M1 formulation (Brucite+TiO
Fig. 6. High resolution spectrum of XPS of the M1 formulation (Brucite+TiO
2
treated at 960°C 1 h with final ratio 1:1 Molar of MgO:TiO
2). The presence of ions of Mg, Ti, Ca and O is detected.
). The presence of ions of Mg, Ti, Ca and O is detected.
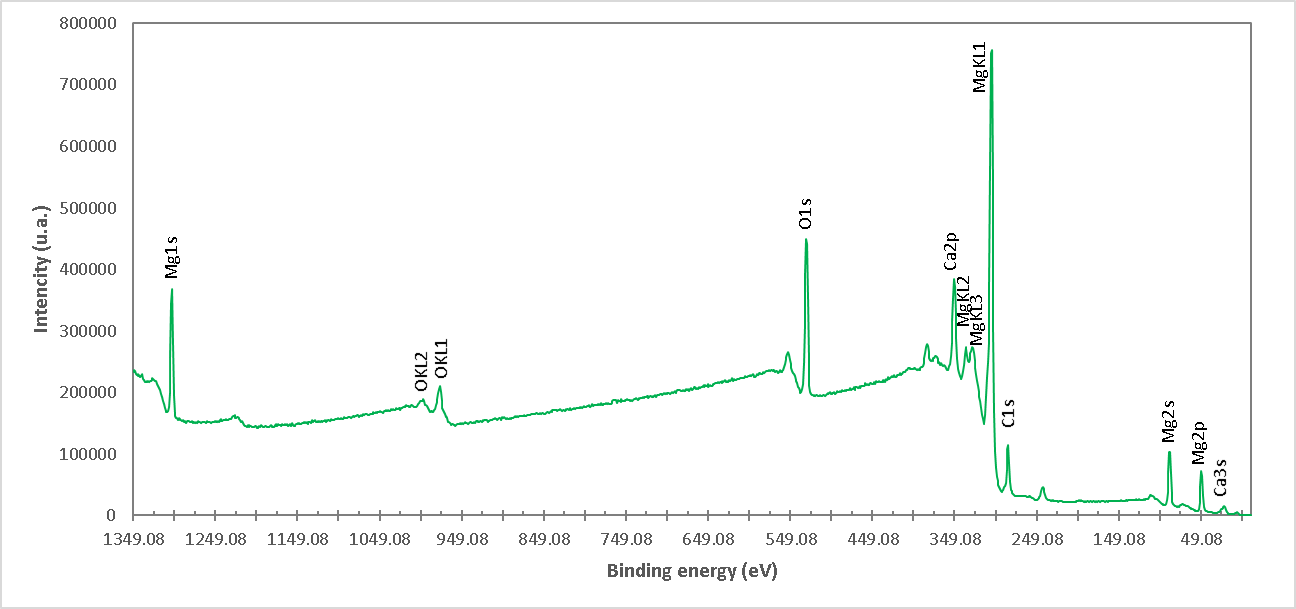
Figure 7. XPS high resolution spectrum of the M4 formulation (Uncalcined brucite). The presence of Mg, Ca and O ions is detected.
Fig. 7. XPS high resolution spectrum of the M4 formulation (Uncalcined brucite). The presence of Mg, Ca and O ions is detected.
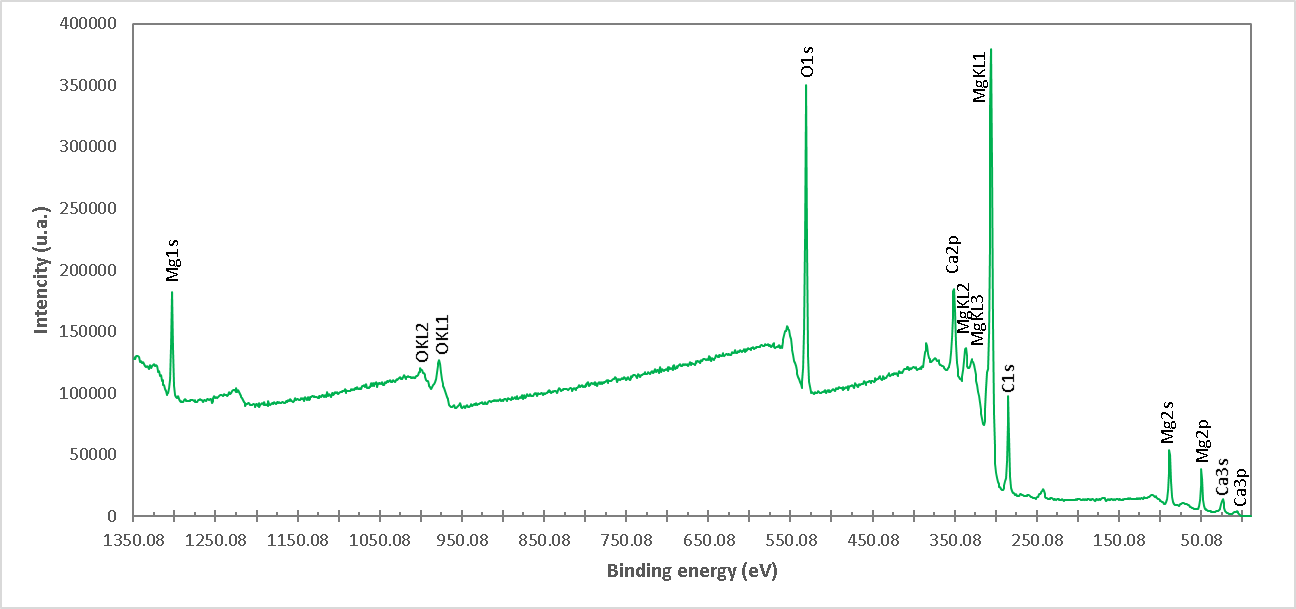
Figure 8. High resolution spectrum of XPS of the M7 formulation (Burntish brucite at 960°C for 1 h). The presence of Mg, Ca and O ions is detected.
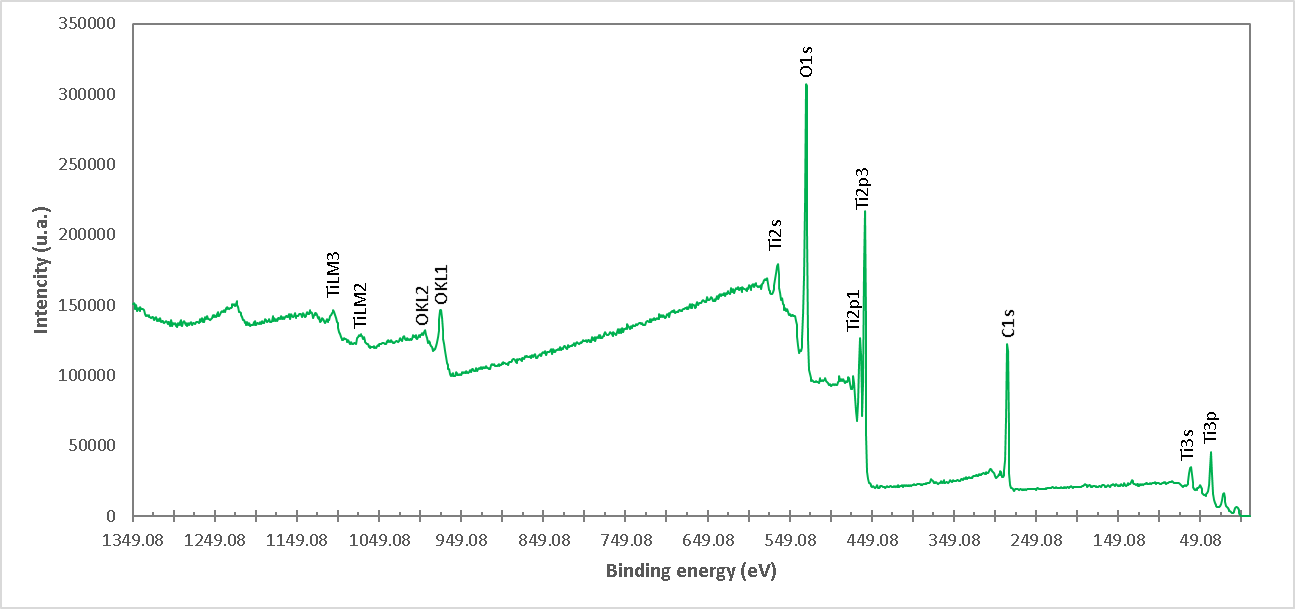
Figure 9. XPS high resolution spectrum of the M10 formulation (TiO
Fig. 10 shows a high-resolution XPS spectrum of Ti in pure TiO
2). The presence of Ti and O ions is detected.
Figure 10. shows a high-resolution XPS spectrum of Ti in pure TiO2. In this spectrum, the Ti2p
. In this spectrum, the Ti2p
3/2
double with binding energy 458.28 eV and Ti2p
1/2
with binding energy 463.88 eV arises from the division of the spin orbit. These spikes are consistent with Ti
4+
in the TiO
2 network[7][8]. The 2p doublet peaks after deconvolution exhibited a tail in the region of lower binding energy, indicating the presence of lower Ti valence states, observed at the Ti2p
network [25][32]. The 2p doublet peaks after deconvolution exhibited a tail in the region of lower binding energy, indicating the presence of lower Ti valence states, observed at the Ti2p
1/2
peak at a binding energy of 457.18 eV corresponding to Ti
3+
in Ti
2
O
3[6]. This indicates that both TiO
[26]. This indicates that both TiO
2
and Ti
2
O
3 are present in pure titania.
are present in pure titania. The existence of Ti3+ in TiO2 indicates that oxygen vacancies are generated to maintain electrostatic equilibrium according to the following chemical equation:
 (9)
(9)
 (10)
(10)
Figure 10. High resolution XPS spectra of Ti2p in titania of high purity, sample M3.
Fig. 8. High resolution spectrum of XPS of the M7 formulation (Burntish brucite at 960°C for 1 h). The presence of Mg, Ca and O ions is detected.
The existence of Ti3+ in TiO
Fig. 9. XPS high resolution spectrum of the M10 formulation (TiO
2 indicates that oxygen vacancies are generated to maintain electrostatic equilibrium according to the following chemical equation:
). The presence of Ti and O ions is detected.


The □ represents an empty position that originates from the removal of O
The □ represents an empty position that originates from the removal of O
2−
from the network. From the equation it can be deduced that a generated vacancy of oxygen is accompanied by two Ti
3+ ions. Therefore, with the areas obtained at each peak of binding energy by XPS, it is feasible to determine the percentage of vacancies of O with the following equations[9]:
ions. Therefore, with the areas obtained at each peak of binding energy by XPS, it is feasible to determine the percentage of vacancies of O with the following equations [27]:


The calculation that the Ti
3+
/Ti
4+
ratio yields, approximately 10% of the peak areas, and the percentage of oxygen vacancies in the high purity titania network used in this work is 2%. In Table 4. the data obtained from the measurements of pure titania by XPS are presented, and the calculations to obtain the percentage of oxygen vacancies in the network.
Table 4. Data from XPS measurements on the pure titania used in this work and calculations to determine the % of oxygen vacancies in the crystal lattice.
Table 4. Data from XPS measurements on the pure titania used in this work and calculations to determine the % of oxygen vacancies in the crystal lattice.
|
Ion |
Peak Link Energy Ev |
FWHM adjusted eV |
Area CPS Ev |
% Ti3+ |
%Ti4+ |
O/You |
%O |
% Vacancies of O |
|
Ti2p3/2 (Ti4+) |
458.28 |
1.25 |
61327.06 |
10% |
90% |
1.952022403 |
98% |
2% |
|
Ti2p1/2 (Ti3+) |
457.18 |
1.25 |
5884.65 |
) and 462.48 eV (Ti2p
1/2
) respectively and correspond to Ti
3+.
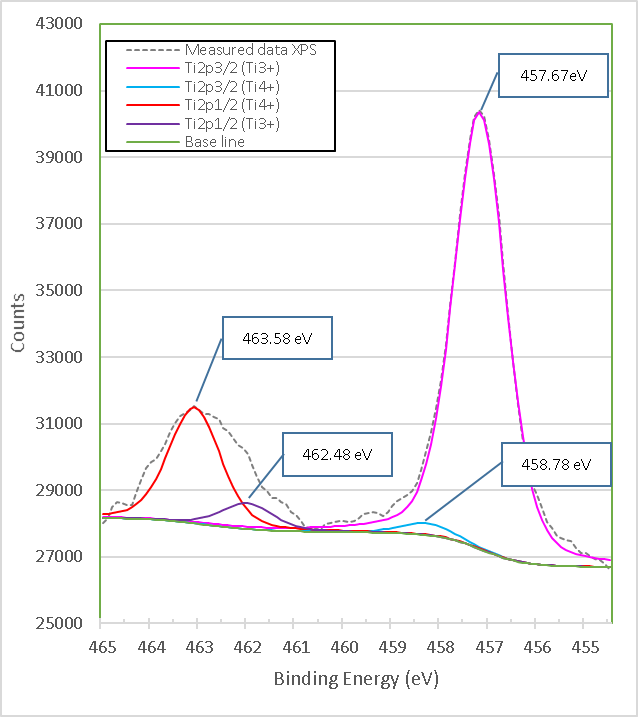
Figure 11. XPS high-resolution spectra of TiO2 mixed with brucite and calcined at 960°C for 1 hour M1.
Similarly, the bond energies 458.78 eV (Ti2p
. Similarly, the bond energies 458.78 eV (Ti2p
3/2
) and 463.58 eV (Ti2p
1/2
) respectively correspond to Ti
4+. Table 5. presents details on the data obtained and adjusted from XPS analysis of Ti2p for pure titania and brucite-with-titania mixture samples.
. Table 5 presents details on the data obtained and adjusted from XPS analysis of Ti2p for pure titania and brucite-with-titania mixture samples.
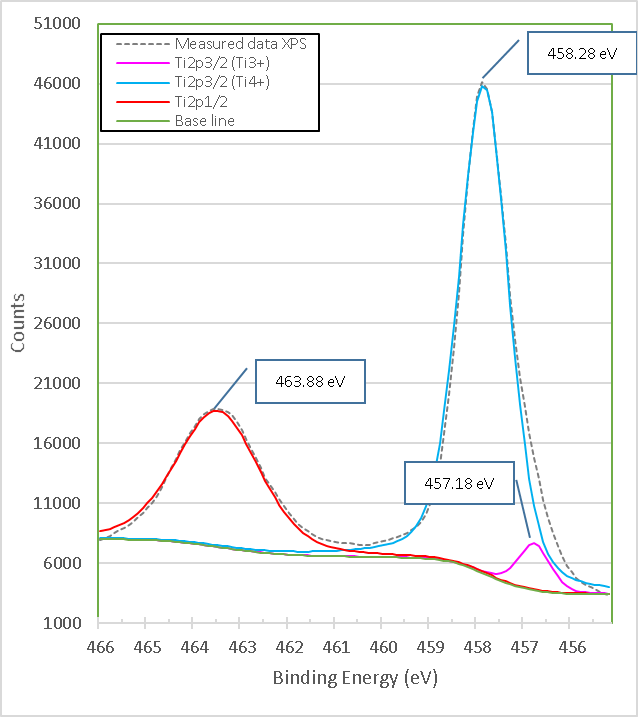
Fig. 10. High resolution XPS spectra of Ti2p in titania of high purity, sample M3.
Table 5. Details of the data obtained from the XPS analysis of Ti for samples of pure titania and mixture of brucite with titania, the latter heat-treated at 960°c for 1 h.
Table 5. Details of the data obtained from the XPS analysis of Ti for samples of pure titania and mixture of brucite with titania, the latter heat-treated at 960°c for 1 h.
|
Sample |
Ion |
Peak bond energy Ev |
Area CPS Ev |
Area Quotient |
FWHM tight Ev |
|
High purity titania |
•Ti2p3/2 (Ti4+) |
458.28 |
61327.06 |
1 |
1.25 |
|
•Ti2p1/2 (Ti4+) |
463.88 |
28448.06 |
0.46 |
2.1 |
|
|
•Ti2p3/2 (Ti3+) |
457.18 |
5884.65 |
0.1 |
1.25 |
|
|
Brucite+TiO2 mixture treated at 960°C 1 h (1:1 Molar MgO:TiO2) |
•Ti2p3/2 (Ti3+) |
457.67 |
20875.58 |
1 |
1.28 |
|
•Ti2p3/2 (Ti4+) |
458.78 |
563.34 |
0.03 |
1.28 |
|
|
•Ti2p1/2 (Ti4+) |
463.58 |
5352.75 |
0.27 |
1.28 |
|
|
•Ti2p1/2 (Ti3+) |
462.48 |
1189.54 |
0.06 |
1.28 |
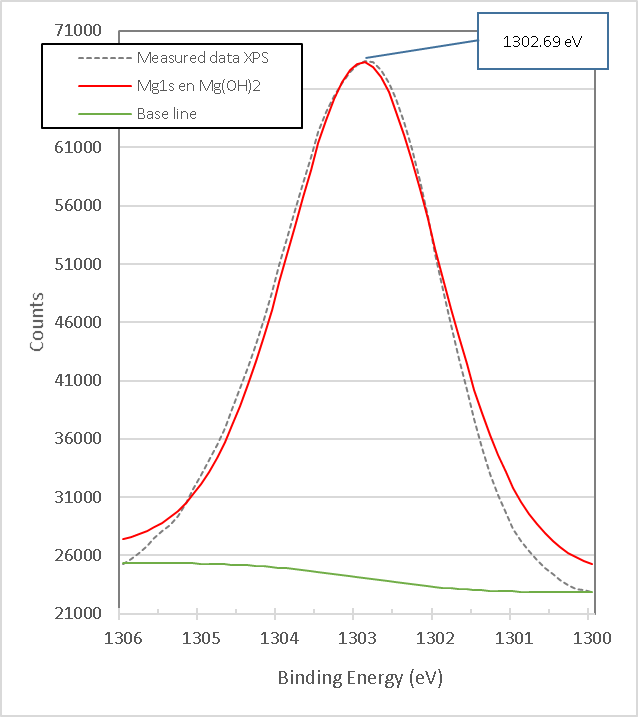
Figure 14. XPS high resolution spectra of Mg1s in Brucite M8.
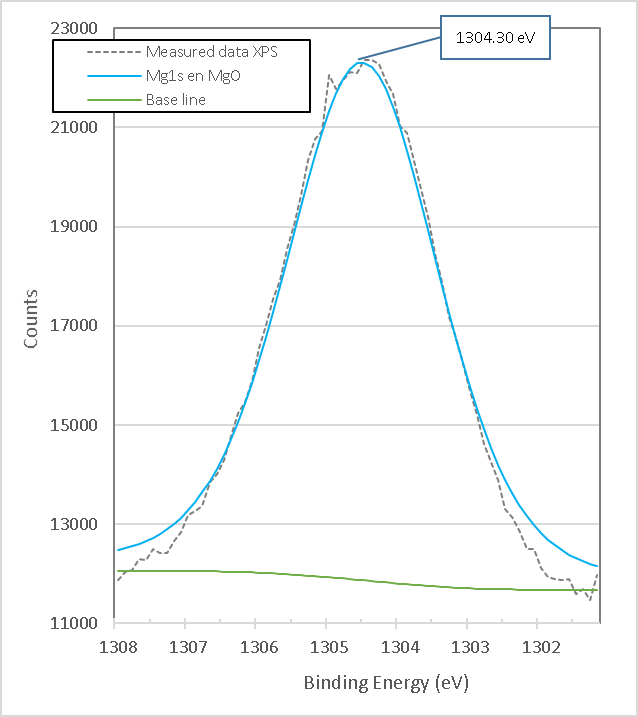
Figure 15. presents the XPS high-resolution spectrum of Mg1s for calcined brucite. It consists of a single peak with a binding energy of 1304.30 eV, which corresponds to the compound of Magnesia, MgO corresponding to Mg
. Fig. 15 presents the XPS high-resolution spectrum of Mg1s for calcined brucite. It consists of a single peak with a binding energy of 1304.30 eV, which corresponds to the compound of Magnesia, MgO corresponding to Mg
2+[19].
[38].
Table 6. Details of the data obtained from xpS analysis of O1s for samples of pure titania and brucite mixture with titania, the latter heat-treated at 960°c for 1 h.
|
Sample |
Ion |
Peak bond energy Ev |
Area CPS Ev |
Area Quotient |
FWHM tight Ev |
|
High purity titania |
• O1s (TiO2) |
529.48 |
69980.14 |
1 |
1.28 |
|
• O1s (TiO2) |
528.28 |
2063.12 |
0.03 |
1.28 |
|
|
• O1s (TiO2) |
531.18 |
9409.16 |
0.13 |
1.28 |
|
|
• O1s (TiO2) |
532.18 |
4566.09 |
0.07 |
1.28 |
|
|
Brucite+TiO2 mixture treated at 960°C 1 h (1:1 Molar MgO:TiO2) |
• O1s (TiO2) |
530.08 |
143009.15 |
1 |
2.50 |
|
• O1s (TiO2) |
530.89 |
2208.72 |
0.02 |
2.50 |
|
|
• O1s (TiO2) |
532.28 |
14419.95 |
0.10 |
2.50 |
|
Ion |
Peak Link Energy eV |
FWHM adjusted eV |
Area CPS eV |
% Ti3+ |
%Ti4+ |
O/Ti |
%O |
% Vacancies of O |
|
Ti2p3/2 (Ti4+) |
458.28 |
1.25 |
61327.06 |
10% |
90% |
1.952022403 |
98% |
2% |
|
Ti2p1/2 (Ti3+) |
457.18 |
1.25 |
5884.65 |
After mixing brucite with titania and a treatment at 960°C for 1 h, the high-resolution XPS spectrum in Figure 11. shows a slight change in position along with a variation in the area of the peaks with respect to those of pure titania. The peaks in the mixed samples of brucite with TiO
After mixing brucite with titania and a treatment at 960°C for 1 h, the high-resolution XPS spectrum in Fig. 11 shows a slight change in position along with a variation in the area of the peaks with respect to those of pure titania. The peaks in the mixed samples of brucite with TiO
2
are now at the binding energies 457.67 eV (Ti2p
3/2
|
Sample |
Ion |
Peak bond energy eV |
Area CPS eV |
Area Quotient |
FWHM eV |
|
High purity titania |
•Ti2p3/2 (Ti4+) |
458.28 |
61327.06 |
1 |
1.25 |
|
•Ti2p1/2 (Ti4+) |
463.88 |
28448.06 |
0.46 |
2.1 |
|
|
•Ti2p3/2 (Ti3+) |
457.18 |
5884.65 |
0.1 |
1.25 |
|
|
Brucite+TiO2 mixture heating at 960°C | |||||
|
Sample |
Ion |
Peak bond energy eV |
Area CPS eV |
Area Quotient |
FWHM eV |
|
High purity titania |
Figure 15. XPS high resolution spectra of Mg1s in burned brucite at 960°C for 1 hour M7.
Fig. 14. XPS high resolution spectra of Mg1s in Brucite M8.
Figure 16. presents the XPS high-resolution spectrum of Mg1s of the mixture of brucite with heat-treated titania. It consists of four peaks with link energies 1302.98 eV, 1303.39 eV, 1304.18 eV and 1305.08 eV. The lowest bond energy of 1302.98 eV is very close to the 1302.69 eV obtained from uncalcined brucite shown in Figure 14., so it is attributed to the strong bonds of Mg1s electrons in the Brucite compound, Mg(OH)
Fig. 16 presents the XPS high-resolution spectrum of Mg1s of the mixture of brucite with heat-treated titania. It consists of four peaks with link energies 1302.98 eV, 1303.39 eV, 1304.18 eV and 1305.08 eV. The lowest bond energy of 1302.98 eV is very close to the 1302.69 eV obtained from uncalcined brucite shown in Fig. 5.7(a), so it is attributed to the strong bonds of Mg1s electrons in the Brucite compound, Mg(OH)
2[18], it is observed that its area is reduced by 98.42% from 122,078.39 eV to 1,917.12 eV, which is consistent with the X-ray Diffraction results presented below.
[37], it is observed that its area is reduced by 98.42% from 122,078.39 eV to 1,917.12 eV, which is consistent with the X-ray Diffraction results presented below.
|
Fig. 15. XPS high resolution spectra of Mg1s in burned brucite at 960°C for 1 hour M7. |
Fig. 16. XPS high resolution spectra of Mg1s in titania mixed with brucite and calcined at 960°C for 1 hour M1. |
1 h (1:1 Molar MgO:TiO | |||||
2 | |||||
) | |||||
|
•Ti2p3/2 (Ti3+) |
457.67 |
20875.58 |
1 |
1.28 |
|
|
•Ti2p3/2 (Ti4+) |
458.78 |
563.34 |
0.03 |
1.28 |
|
|
•Ti2p1/2 (Ti4+) |
463.58 |
5352.75 |
0.27 |
1.28 |
|
|
•Ti2p1/2 (Ti3+) |
462.48 |
1189.54 |
0.06 |
1.28 |
Fig. 11. XPS high-resolution spectra of TiO2 mixed with brucite and calcined at 960°C for 1 hour M1
After mixing and heat treatment, the peak area of Ti2p3/2 with a binding energy of 457.67 eV, which is very close to 457.18 eV of Ti
3+
in pure titania, increased by 3.55 times; similarly, the peak area of Ti2p
3/2
in the mixture of brucite and titania with a binding energy of 458.28 eV, which is very close to 458.78 eV of the Ti
4+
of pure titania, decreased by 99%. This suggests that the oxidation state present in the sample of brucite mixed with titania after heat treatment may correspond to Ti
3+
, but there is a possibility that it is due to a mixture of oxides with different stoichiometry. The change in stoichiometry was estimated by the change in the area of relative peaks.
The increase in the Ti
3+
peak area indicates that after brucite doping and heat treatment oxygen is removed from the network, showing a relative increase in Ti
3+
in the XPS spectrum. On the other hand, with the decrease in the area of the Ti
4+
peak , the reaction of Mg
2+
ion substitutions in the TiO
2
network is inferred due to the reaction of Ti
4+
ion substitutions in the MgO network from the transformation of brucite at 960°C, and conversely, so that mixtures of magnesia-titania-oxygen Oxides Mg-Ti-O are formed with different oxidation states and/or stoichiometries, as demonstrated below with the X-ray diffraction results.
The increase in the peak area of Ti
3+
indicates that some mixed oxide structure is formed in large quantities with Mg with Ti
3+
and/or Ti
4+
oxidation state after doping. Meanwhile, the decreasing area of Ti
4+
indicates a reduction of TiO
2
in the sample and probably the formation of a Ti-O-Mg structure in the TiO
2 network through the substitution of Mg ions. The observed change in the peaks also indicates the influence between the Ti and Mg atoms and a superposition of their 3d orbital[10].
network through the substitution of Mg ions. The observed change in the peaks also indicates the interaction between the Ti and Mg atoms and a superposition of their 3d orbital [28].
Figure 12. shows the XPS high resolution spectrum of O1s in high purity TiO
Fig. 12 shows the XPS high resolution spectrum of O1s in high purity TiO
2
, which is composed of four peaks with binding energies 528.28 eV, 529.48 eV, 531.18 eV and 532.18 eV. The highest binding energy at 532.18 eV is generally attributed to oxygen or hydroxyl (OH) species chemically absorbed or dissociated at the sample surface, such as adsorbed H
2O[11]. The 531.18 eV bond energy component of O1s is associated with O
O [29]. The 531.18 eV bond energy component of O1s is associated with O
2
ions found in the compound Ti
2
O
3[12], which is consistent with the XPS spectrum for Ti2p in Figure 10. The 528.28 eV bond energy component of O1s is associated with
[30], which is consistent with the XPS spectrum for Ti2p in Fig. 10. The 528.28 eV bond energy component of O1s is associated with
O2
ions found in oxygen-deficient regions within the TiO
2
matrix promoted by the present chemical state of Ti
3+
.
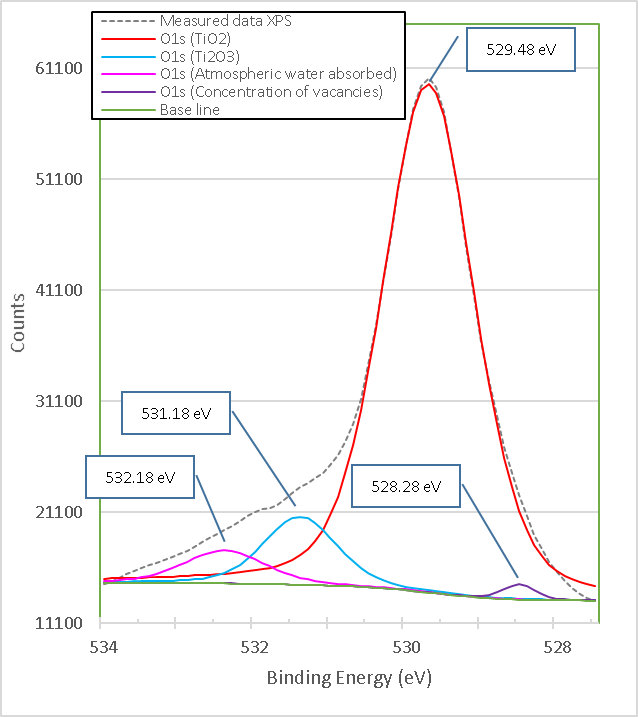
Figure 12. XPS high resolution spectra of O1s titania pure M10.
As a result, changes in the intensity of this component may be related to variations in the concentration of oxygen vacancies (VO)[13], which is consistent with the peak bond 531.18 eV in the same spectrum by the chemical state of Ti
As a result, changes in the intensity of this component may be related to variations in the concentration of oxygen vacancies (VO) [31], which is consistent with the peak bond 531.18 eV in the same spectrum by the chemical state of Ti
3+, as well as with the XPS spectrum for Ti2p in Figure 10. The peak intensity with binding energy of 529.48 eV exceeds all other peaks, indicating the strong ti-O binding in the pure TiO
, as well as with the XPS spectrum for Ti2p in Fig. 10. The peak intensity with binding energy of 529.48 eV exceeds all other peaks, indicating the strong ti-O binding in the pure TiO
2 compound and this value is consistent with what was reported in reference[8] and is further consistent with the XPS spectrum for Ti2p in Fig. 10.
compound and this value is consistent with what was reported in reference [32] and is further consistent with the XPS spectrum for Ti2p in Fig. 10.
Figure 13. presents the high-resolution XPS spectrum of O1s from the mixture of brucite with heat-treated titania. It consists of three peaks with link energies 530.08 eV, 530.89 eV and 532.28 eV. The lowest bond energy of 530.08 eV corresponds to the strong bonds of O1s with different Oxides of Ti[14]. The mean binding energy of 530.89 eV corresponds to O1s bonds with MgO[15][16]. The highest bond energy of 532.28 eV corresponds to both MgO[17] and different Ti oxides[16]. All the binding energies of the xpS high-resolution spectra obtained for O1s in the samples of mixing TiO
Fig. 13 presents the high-resolution XPS spectrum of O1s from the mixture of brucite with heat-treated titania. It consists of three peaks with link energies 530.08 eV, 530.89 eV and 532.28 eV. The lowest bond energy of 530.08 eV corresponds to the strong bonds of O1s with different Oxides of Ti [33]. The mean binding energy of 530.89 eV corresponds to O1s bonds with MgO [34][35]. The highest bond energy of 532.28 eV corresponds to both MgO [36] and different Ti oxides [35]. All the binding energies of the xpS high-resolution spectra obtained for O1s in the samples of mixing TiO
2
with brucite and heat-treated at 960°C for 1 h, show congruence with the phases determined in the X-ray diffractograms (XRD).
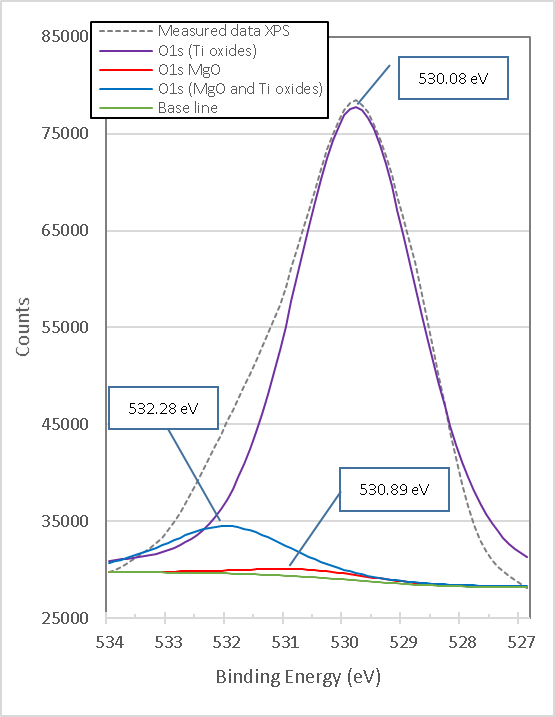
Figure 13. Titania's XPS high-resolution O1s spectra mixed with brucite and calcined at 960°C for 1 hour M1
From Figures 12. to 13. it is observed that the peak with binding energies 531.18 eV corresponding to Ti
From Fig. 12 to 13 it is observed that the peak with binding energies 531.18 eV corresponding to Ti
2
O
3
disappears after doping with brucite and heat treatment, but another very intense peak appears with binding energy of 530.08 eV corresponding to different types of Ti oxides, which indicates that in the process a mixture of different oxides is formed between Ti
4+
, Ti
3+
and Mg
2+
, including TiO
2
. This is consistent with the phases identified in the X-ray diffraction diagrams. Again, the peak O1s binding energy of 528.28 eV corresponding to Ti
3+
in pure titania shifts slightly to 530.08 eV after doping with brucite and heat treatment, which indicates that together with TiO
2
a mixture of Mg-Ti-O oxides is formed.
The change in stoichiometry is estimated by the change in the area of relative peaks. In this case, the O1s peak of 531.18 eV corresponding to Ti
3+
in pure titania shifts slightly to 530.08 eV, which corresponds to a mixture of different oxidation states, and increases its area by 15.2 times.
Doping with Mg
2+
ions by brucite results in a minor change in binding energy, indicating that Mg
2+
ions are better dispersed at TiO
2
network substitution sites and produce more Mg-O-Ti mixed oxide structure, which is consistent with the results of phases identified with X-ray diffraction as shown below. Table 6 presents details on the data obtained and adjusted from the XPS analysis of O1s for pure titania and brucite-with-titania mixture samples.
|
Fig. 12. XPS high resolution spectra of O1s titania pure M10. |
Fig. 13. Titania's XPS high-resolution O1s spectra mixed with brucite and calcined at 960°C for 1 hour M1 |
Table 6. Details of the data obtained from xpS analysis of O1s for samples of pure titania and brucite mixture with titania, the latter heat-treated at 960°c for 1 h.
with the highest percentage by weight of 38.21%, its angles coincide 31.980°, 42.157°, 45.854°, 48.283°, 51.642°, 64.038°, 66.863°, 76.044°, 83.275°, 99.743°, 111.463°, 118.212°, 119.330° and 121.167° of which their diffraction planes are: (110), (101), (200), (111), (210), (211), (310), (112), (321), (330), (411), (312) and (420), respectively according to the values referenced in PDF 04-008-4342. Mg(OH)
2
has a percentage by weight of 6.92%, and the angles obtained in the diffractogram coincide with the values of the reference PDF 04-016-3445, whose angles are: 38.320°, 73.547°, 119.691° and 142.158°, and their respective diffraction planes are: (100), (111), (023), and (122), respectively.
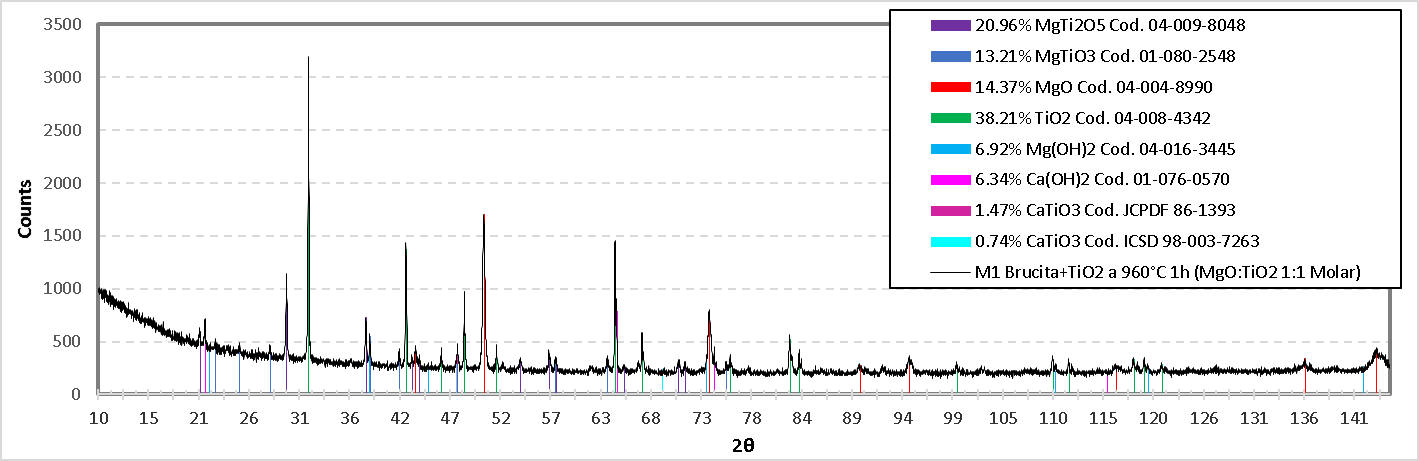
Figure 20. X-ray diffractogram of the formulation M1 (Titania mixed with brucite and calcined at 960°C for 1 hour).
Fig. 21. X-ray diffractogram of the formulation M1 (Titania mixed with brucite and calcined at 960°C for 1 hour).
Ca(OH)
Ca(OH)
2
is present by 6.34% by weight in the M1 mixture, and this can be verified since the angles obtained coincide with the pdf reference 01-076-0570. The angles are: 21.124°, 74.382° and 115.478°, which have the following diffraction planes: (001), (201) and (122) respectively. The CaTiO
3 compound is present with 1.47% by weight, its angles are referenced with JCPDF: 86-1393, whose congruent angle is 47.5° and its diffraction plane is (220); additionally, according to the ICSD reference 98-003-7263 the corresponding angles are 47.5° and 69.4° and its corresponding diffraction planes are: (040) and (242) respectively.
compound is present with 1.47% by weight, its angles are referenced with JCPDF: 86-1393, whose congruent angle is 47.5° and its diffraction plane is (220); additionally, according to the ICSD reference 98-003-7263 the corresponding angles are 47.5° and 69.4° and its corresponding diffraction planes are: (040) and (242) respectively.
Fig. 21 presents the DRX diagram of the mixture M7 (calcined brucite), which resulted in caustic MgO. The planes obtained in X-ray diffraction are as follows: (111), (200), (220), (311), (222), (400), (331), (420) and correspond to angles 43.174°, 50.279°, 73.852°, 89.578°, 94.749°, 116.346°, 135.607° and 143.567° respectively, according to PDF 04-004-8990. By comparing this information with the XPS analysis, it can be concluded that MgO is present in this formulation.
Figure 21. presents the DRX diagram of the mixture M7 (calcined brucite), which resulted in caustic MgO. The planes obtained in X-ray diffraction are as follows: (111), (200), (220), (311), (222), (400), (331), (420) and correspond to angles 43.174°, 50.279°, 73.852°, 89.578°, 94.749°, 116.346°, 135.607° and 143.567° respectively, according to PDF 04-004-8990. By comparing this information with the XPS analysis, it can be concluded that MgO is present in this formulation.
In the formulation of the M8 brucite was used, in Fig. 22 its diffractogram is shown. In this sample two compounds were determined, and the planes obtained from Mg(OH)2 are as follows: (001), (100), (011), (102), (110), (111), (013), (021), (022), (014), (023), (211). And according to the angles 21.626°, 38.320°, 44.426°, 59.801°, 68.503°, 69.289°, 73.547°, 81.316°, 82.055°, 86.114°, 97.254°, 98.238°, 106.251°, 109.983°, 119.691°, 120.539°, 125.340°, 139.446°, 140.605°, 142.158°, 159.860°, 167.217° and 171.116° respectively, and agrees with the PDF reference 04-016-3445.
For Ca(OH)2 which is present only 0.20% by weight, the following diffraction planes were detected: (001), (100), (011), (012), (110), (111), (201), (103), (121) and (122), correspondingly at angles 21.124°, 33.479°, 39.925°, 43.012°, 55.576°, 59.849°, 64.209°, 66.719°, 70.343°, 74.382°, 76.498°, 76.742°, 86.122°, 94.311°, 95.881°, 99.281°, 103.212°, 103.941°, 105.573°, 115.478°, 119.558°, 124.083°, 124.945°, 132.84°, 137.611°, 140.004°, 147.766° and 172.165°, according to PDF reference 01-076-0570. Comparing these compounds with the XPS results, we can confirm that in the M8 formulation, the compound Ca(OH)2 is present.
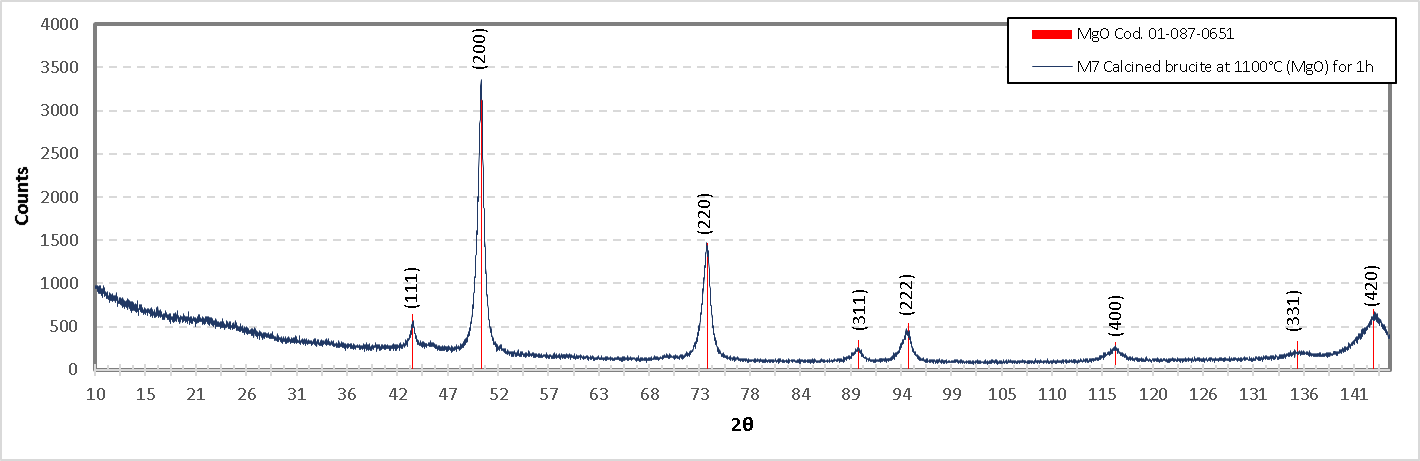
Figure 21. Diffractogram of the formulation M7(Burnt brucite at 1100°C 1 h).
Fig. 22. Diffractogram of the formulation M7(Burnt brucite at 1100°C 1 h).
In the formulation of the M8 brucite was used, in Figure 22. its diffractogram is shown. In this sample two compounds were determined, and the planes obtained from Mg(OH)
Fig. 23 shows the diffractogram of TiO2
are as follows: (001), (100), (011), (102), (110), (111), (013), (021), (022), (014), (023), (211). And according to the angles 21.626°, 38.320°, 44.426°, 59.801°, 68.503°, 69.289°, 73.547°, 81.316°, 82.055°, 86.114°, 97.254°, 98.238°, 106.251°, 109.983°, 119.691°, 120.539°, 125.340°, 139.446°, 140.605°, 142.158°, 159.860°, 167.217° and 171.116° respectively, and agrees with the PDF reference 04-016-3445.
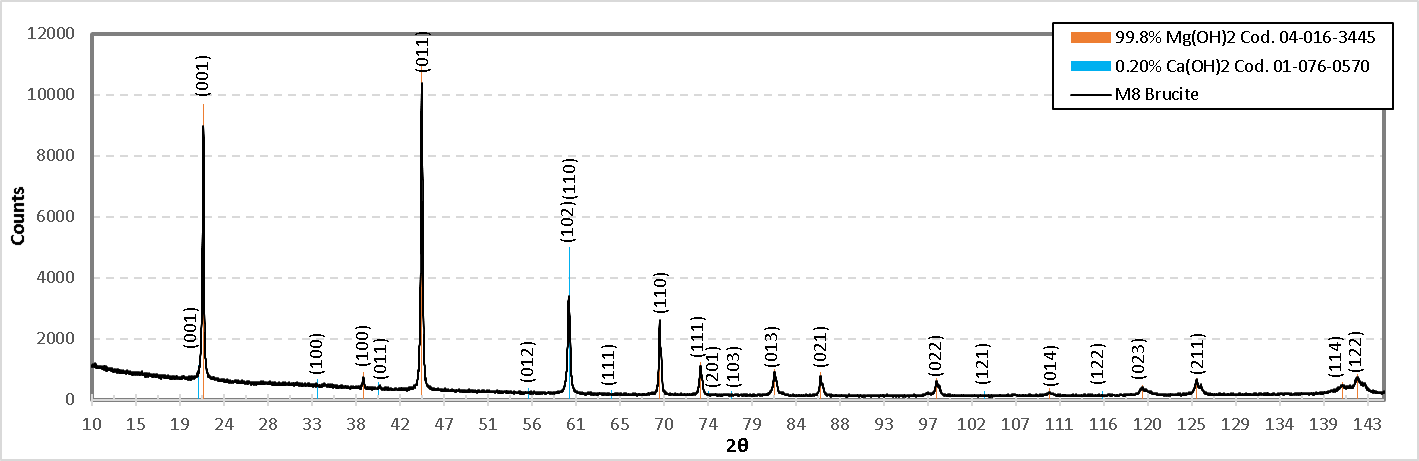
Figure 22. Diffractogram of the M8 formulation (Uncalcined brucite).
For Ca(OH)
. According to this diagram, in the mixture of the formulation M10 the compound TiO
2 which is present only 0.20% by weight, the following diffraction planes were detected: (001), (100), (011), (012), (110), (111), (201), (103), (121) and (122), correspondingly at angles 21.124°, 33.479°, 39.925°, 43.012°, 55.576°, 59.849°, 64.209°, 66.719°, 70.343°, 74.382°, 76.498°, 76.742°, 86.122°, 94.311°, 95.881°, 99.281°, 103.212°, 103.941°, 105.573°, 115.478°, 119.558°, 124.083°, 124.945°, 132.84°, 137.611°, 140.004°, 147.766° and 172.165°, according to PDF reference 01-076-0570. Comparing these compounds with the XPS results, we can confirm that in the M8 formulation, the compound Ca(OH)
is present. In the same diffractogram, the planes with their respective angles 2θ belonging to this compound are shown according to PDF 04-008-4342, which supports the presence of TiO
2 is present.
.
Figure 23. shows the diffractogram of TiO2. According to this diagram, in the mixture of the formulation M10 the compound TiO2 is present. In the same diffractogram, the planes with their respective angles 2θ belonging to this compound are shown according to PDF 04-008-4342, which supports the presence of TiO2.
Fig. 23. Diffractogram of the M8 formulation (Uncalcined brucite).
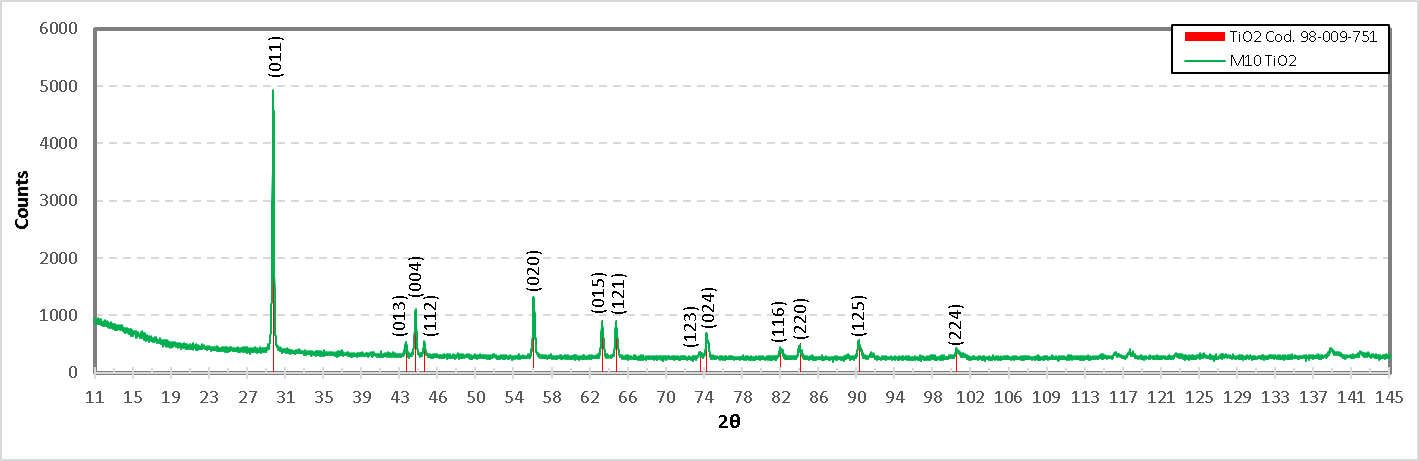
Fig. 23. Diffractogram of the formulation M10 (Titania of high purity), showing the identification of TiO
Fig. 24. Diffractogram of the formulation M10 (Titania of high purity), showing the identification of TiO
2
).
For the M10 formulation the presence of the compound Ti
For the M10 formulation the presence of the compound Ti
2
O
3 was also found, and below is the diffractogram of this compound in Figure 24.
was also found, and below is the diffractogram of this compound in Fig. 23.
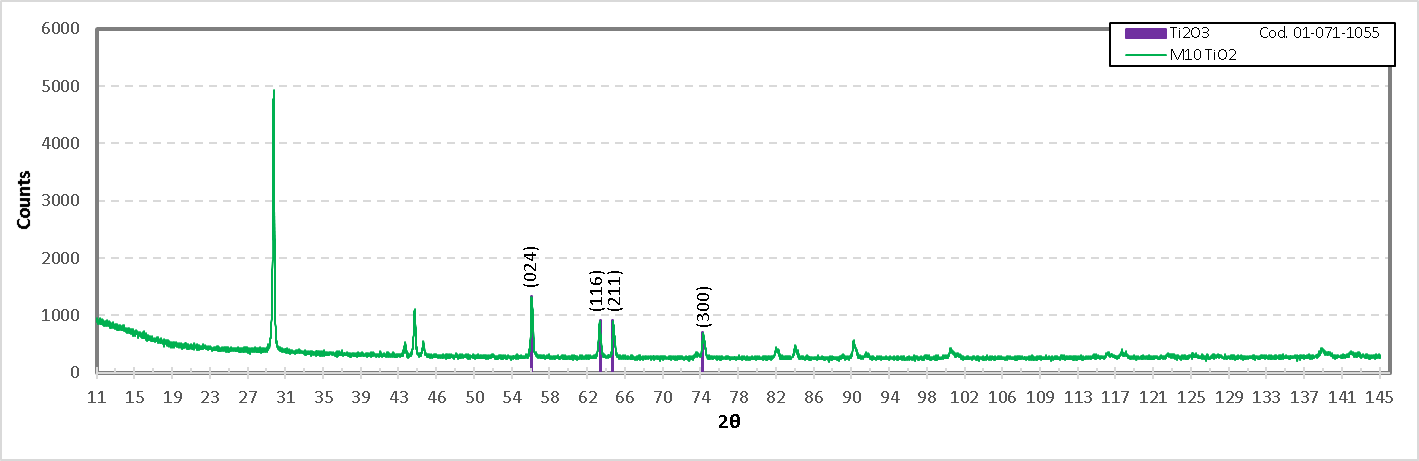
Figure 24. Diffractogram of the formulation M10 (Titania of high purity), showing the identification of Ti
Fig. 25. Diffractogram of the formulation M10 (Titania of high purity), showing the identification of Ti2O3.
As can be seen in the diffractograms and in the XPS spectra, it is confirmed that by mixing TiO
As can be seen in the diffractograms and in the SPECTRA of XPS, it is confirmed that by mixing TiO2 with industrial grade brucite of national origin and calcining at low temperature (960°C) in a short period of time (1 h), it is possible to form ceramic phases in the Mg-Ti-O system mainly. The compounds that are obtained are MgTi
2
O
5
, MgTiO
3
, MgO and TiO
2
mainly. The percentages obtained are relatively high, approximately 21, 13, 14 and 38% for MgTi
2
O
5
, MgTiO
3
, MgO and TiO
2 respectively. When analyzing the phase diagram in Figure 25. it can be seen that the compounds between MgTi
respectively. When analyzing the phase diagram in Fig. 25 it can be seen that the compounds between MgTi2O5 and MgTiO
3
have melting points between 1605°C and 1660°C.
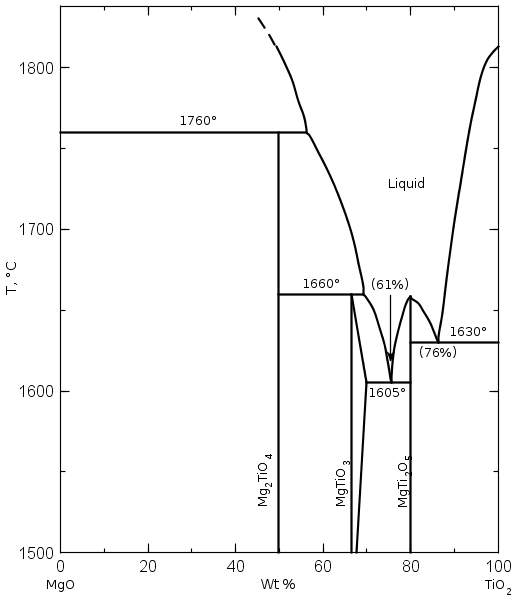
Figure 25. Phase diagram of MgO and TiO
Considering that MgO-based refractory materials produced from double calcined brucite are used in melting processes with temperatures above 1537°C in steel production, for example, it is appropriate to take care of the formation of these compounds during the sintering of MgO if it is doped with Titanium ions by micro or TiO2
showing the phases formed with different contents of the substances at different temperatures[21].
nanoparticles.
Considering that MgO-based refractory materials produced from double calcined brucite are used in melting processes with temperatures above 1537°C in steel production, for example, it is appropriate to take care of the formation of these compounds during the sintering of MgO if it is doped with Titanium ions by micro or TiO
Fig. 26. Phase diagram of MgO and TiO
2 nanoparticles.
(% by weight) showing the phases formed with different contents of the substances at different temperatures [8].
Table 7 shows that the reticular values of the titania and magnesium titanate phases are exactly consistent with the values of the crystal structure of these compounds, as well as the MgO lattice parameters in the calcined brucite (M2) sample; on the other hand it is observed that the reticular values of MgO in the mixture of brucite with heat-treated titania at a temperature of 960°C for 1 h (M1), the network parameters of MgO are modified as a result of the presence of Ti ions in its crystal structure and possible vacancies generated by the greater number of valence electrons between Mg and Ti.
Table 7. Network parameters obtained from DRX analysis for samples of pure calcined brucite (M2) and brucite mixture with titania (M1), both heat-treated at 960°c for 1 h.
Table 7. Network parameters obtained from DRX analysis for samples of pure calcined brucite (M2) and brucite mixture with titania (M1), both heat-treated at 960°c for 1 h.
|
Sample |
Compound |
Crystal structure |
Space group |
to Å |
b Å |
c Å |
α ° |
β ° |
γ ° |
|
M2 |
MgO |
Cubic |
F m -3 m (225) |
4.213313 |
4.213313 |
4.213313 |
90 |
90 |
90 |
|
M1 |
MgO |
Cubic |
F m -3 m (225) |
4.21156 |
4.21156 |
4.21156 |
90 |
90 |
90 |
|
MgTiO3 |
Rhombohedral |
R -3 (148) |
|
• O1s (TiO2) |
529.48 |
69980.14 |
1 |
1.28 |
|
|
• O1s (TiO2) |
528.28 |
2063.12 |
0.03 |
1.28 |
|
|
• O1s (TiO2) |
531.18 |
9409.16 |
0.13 |
1.28 |
|
|
• O1s (TiO2) |
532.18 |
4566.09 |
0.07 |
1.28 |
|
|
Brucite+TiO2 mixture heating at 960°C 1 h (1:1 Molar MgO:TiO2) |
• O1s (TiO2) |
530.08 |
143009.15 |
1 |
2.50 |
|
• O1s (TiO2) |
530.89 |
2208.72 |
0.02 |
2.50 |
|
|
• O1s (TiO2) |
532.28 |
14419.95 |
0.10 |
2.50 |
Figure 14. presents the XPS high-resolution spectrum of Mg1s of brucite without doping with TiO
Fig. 14 presents the XPS high-resolution spectrum of Mg1s of brucite without doping with TiO
2
and without heat treatment. It consists of a single peak with a binding energy of 1302.69 eV, which corresponds to the Brucite compound, Mg(OH)
2[18]; this measurement is consistent with X-ray diffraction results. To characterize the brucite and analyze its transformation when comparing against the mixture, brucite was calcined at 960°C for 1 h without doping with TiO
[37]; this measurement is consistent with X-ray diffraction results. To characterize the brucite and analyze its transformation when comparing against the mixture, brucite was calcined at 960°C for 1 h without doping with TiO
2.
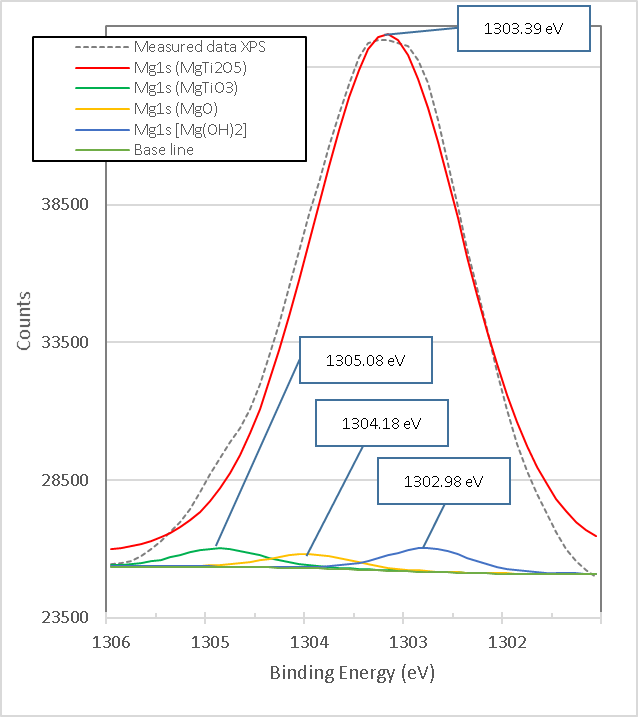
Figure 16. XPS high resolution spectra of Mg1s in titania mixed with brucite and calcined at 960°C for 1 hour M1.
The binding energy of 1303.39 eV, according to its high peak area corresponding to the percentage obtained in X-ray diffraction analyses, is attributed to the strong bonds of Mg1s electrons in the compound MgTi
The binding energy of 1303.39 eV, according to its high peak area corresponding to the percentage obtained in X-ray diffraction analyses, is attributed to the strong bonds of Mg1s electrons in the compound MgTi
2
O
5. The binding energy of 1304.18 eV is very close to the 1304.30 eV obtained from the calcined brucite shown in Figure 15., so it is attributed to the strong bonds of the Mg1s electrons in the Magnesia compound, MgO corresponding to Mg
. The binding energy of 1304.18 eV is very close to the 1304.30 eV obtained from the calcined brucite shown in Fig. 15, so it is attributed to the strong bonds of the Mg1s electrons in the Magnesia compound, MgO corresponding to Mg
2+[19], which is consistent with the X-ray Diffraction results presented later. The binding energy of 1305.08 eV, according to its peak area corresponding to the percentage obtained in X-ray diffraction analyses, is attributed to the strong bonds of Mg1s electrons in the MgTiO
[38], which is consistent with the X-ray Diffraction results presented later. The binding energy of 1305.08 eV, according to its peak area corresponding to the percentage obtained in X-ray diffraction analyses, is attributed to the strong bonds of Mg1s electrons in the MgTiO
3 compound. Figure 17. presents the XPS high-resolution Spectrum of Ca2p of brucite without heat treatment. It consists of a single peak with binding energy of 350.18 eV that is attributed to the compound Ca(OH)
compound. Fig. 17 presents the XPS high-resolution Spectrum of Ca2p of brucite without heat treatment. It consists of a single peak with binding energy of 350.18 eV that is attributed to the compound Ca(OH)
2.
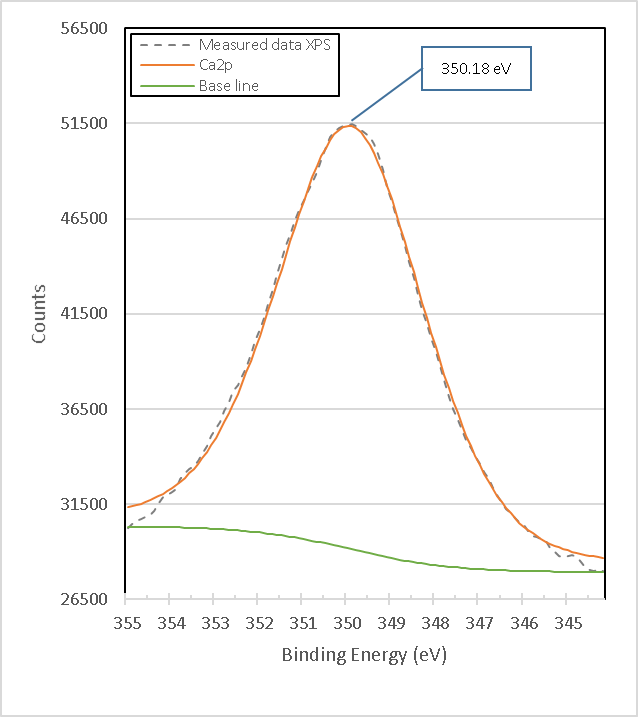
Figure 17. High resolution XPS Ca2p spectrum in Brucite M8.
Figure 18. presents the XPS high-resolution spectrum of heat-treated brucite with two peaks with binding energy 346.98 eV and 349.89 eV corresponding to Ca2p
. Fig. 18 presents the XPS high-resolution spectrum of heat-treated brucite with two peaks with binding energy 346.98 eV and 349.89 eV corresponding to Ca2p
3/2
and Ca2p
1/2 respectively; according to reference[20], the corresponding peaks in CaO are 347 and 351 eV, so the difference is attributed to the presence of the compound Ca(OH)
respectively; according to reference [39], the corresponding peaks in CaO are 347 and 351 eV, so the difference is attributed to the presence of the compound Ca(OH)
2
by humidity of the environment.
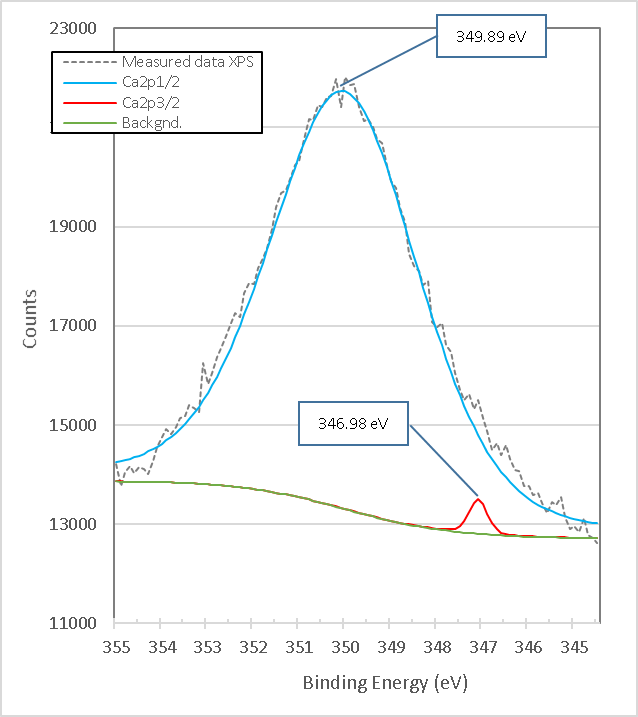
Figure 18. XPS high resolution spectrum of Ca2p in burned brucite at 960°C for 1 hour M7.
Figure 19. presents the high-resolution XPS spectrum of Ca2p of the mixture of brucite with heat-treated titania. It consists of two peaks with link energies 347.28 eV and 350.48 eV. When comparing the binding energies with the peaks in Figure 18., a slight displacement of 0.3 and 0.6 eV is observed, which could be attributed to the presence of TiO
Fig. 19 presents the high-resolution XPS spectrum of Ca2p of the mixture of brucite with heat-treated titania. It consists of two peaks with link energies 347.28 eV and 350.48 eV. When comparing the binding energies with the peaks in Fig. 5.9(b), a slight displacement of 0.3 and 0.6 eV is observed, which could be attributed to the presence of TiO2 and the partial formation of CaTiO
3
with CaO present, which is demonstrated with the X-ray Diffraction analysis.
|
Fig. 18. Fig. 17. High resolution XPS Ca2p spectrum in Brucite M8. |
Fig. 19. XPS high resolution spectrum of Ca2p in burned brucite at 960°C for 1 hour M7. |
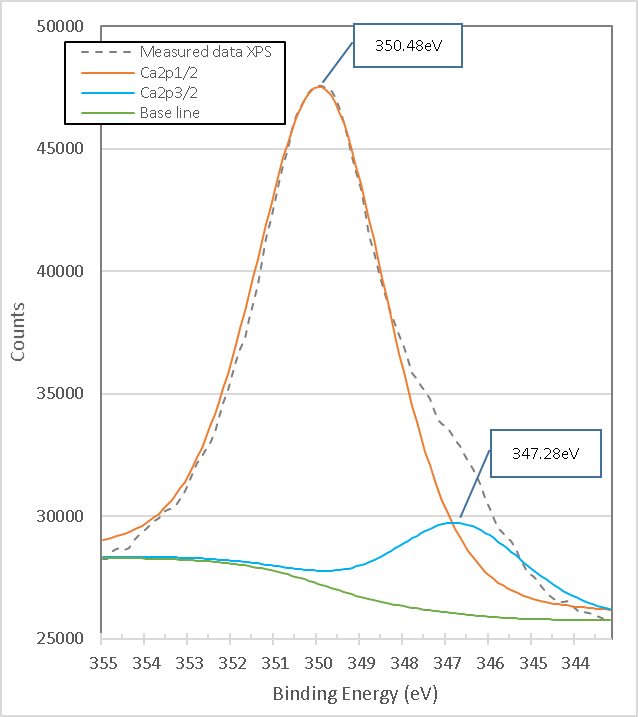
Figure 19. XPS high resolution spectrum of Ca2p in titania mixed with brucite and calcined at 960°C for 1 hour M1.
Fig. 20. XPS high resolution spectrum of Ca2p in titania mixed with brucite and calcined at 960°C for 1 hour M1.
3.2 Analysis by DRX
3.2 Analysis by DRX
The diffractogram in Figure 20. shows the different compounds detected in the M1 mixture. For the compound MgTi
The diffractogram in Fig. 20 shows the different compounds detected in the M1 mixture. For the compound MgTi
2
O
5
with a percentage by weight of 20.96%, angles 21.173°, 29.662°, 37.964°, 43.543°, 44.116°, 54.134°, 57.088°, 65.684°, 70.625°,71.346° were detected, of which its diffraction planes are: (200), (220), (230), (131),( 311), (430), (002), (222), (232), (531), respectively and these coincide with the values of the reference PDF 04-009-8048. For the MgTiO3 compound with a percentage by weight of 13.21%, the matching angles are: 27.954°, 57.769°, and its diffraction planes are: (012) and (024) respectively according to PDF reference 01-080-2548. A percentage by weight of 14.37% MgO was detected, and the angles referenced as MgO are: 43.174°, 50.279°, 73.852°, 89.578°, 94.749°, 116.346° and 143.567°, and their diffraction planes are as follows: (111), (200), (220), (311), (222), (400), (420), respectively, according to the reference PDF 04-004-8990.
For TiO
2
5.0549 | 5.0549 |
13.8939 |
90 |
90 |
90 |
|||
|
MgTi2O5 |
Orthorhomic |
C m c m (63) |
3.7428 |
9.7387 |
9.9976 |
90 |
90 |
90 |
|
TiO2 |
Tetragonal |
P 42/m n m (136) |
4.59327 |
4.59327 |
2.95892 |
90 |
90 |
90 |
- Conclusions
|
Sample |
Compound |
Crystal structure |
Space group |
a Å |
b Å |
c Å |
α ° |
β ° |
γ ° |
|
M2 |
MgO |
Cubic |
F m -3 m (225) |
4.213313 |
4.213313 |
4.213313 |
90 |
90 |
90 |
|
M1 |
MgO |
Cubic |
F m -3 m (225) |
4.21156 |
4.21156 |
4.21156 |
90 |
90 |
90 |
|
MgTiO3 |
Rhombohedral |
R -3 (148) |
5.0549 |
5.0549 |
13.8939 |
90 |
90 |
90 |
|
|
MgTi2O5 |
Orthorhombic |
C m c m (63) |
3.7428 |
9.7387 |
9.9976 |
90 |
90 |
90 |
|
|
TiO2 |
Tetragonal |
P 42/m n m (136) |
4.59327 |
4.59327 |
2.95892 |
90 |
90 |
90 |
4. Conclusions
It is concluded that the incorporation of Ti
It is concluded that the incorporation of Ti
4+
ions by mixing TiO
2
microparticles in the brucite, modifies the network structure of the caustic MgO obtained after its calcination at 960°C 1 h, forming compounds of the Mg-Ti-O system; In addition, it is concluded that Ti
4+
modifies the size of the crystal structure possibly due to the demand of twice as many O
2
ions
-
generating vacancies in the crystal structure.
It is concluded that the presence of TiO
2
in brucite promotes the formation of MgTi
2
O
5
and MgTiO
3
compounds, whose compounds have relatively low melting points and care must be taken during the addition of said oxide in the densification of the double calcined MgO. Additionally, it is concluded that the low oxidation states in TiO
2
generate oxygen vacancies in the crystal lattice structure. Finally, it is concluded that, of the impurities of Ca, Fe, Al and Si in the mexican brucite, only the presence of Ca influences during calcination in the interaction of TiO
2
forming CaTiO
3 compounds.
compounds.
Recognitions
The authors recognize and appreciate the support granted to the Autonomous University of Nuevo León through the financial support of PAICYT.
References
- Schacht, C.. Refractories Handbook; Schacht, Charles A., Eds.; Marcel Dekker, Inc.: New York, 2004; pp. 109, 112.Callister, W. D. (1996). Introduction to Materials Science and Engineering (2nd ed., Vol. 2). Editorial Reverté.
- Shand, M. A.. The Chemistry and Technology of Magnesia; John Wiley & Sons, Inc. Publication: Hoboken, New Jersey, 2006; pp. 12, 39, 33-35.Martínez Leal, L.C. (1998, February). Classification and use of refractory materials in the steel industry (Thesis). University of San Carlos de Guatemala.
- BRUCITE. (2018, 21 April). Fdminerals, Minerals and Fossils Collection. https://www.fdminerals.es/2018/04/21/brucita/Schacht, C. (2004). Refractories Handbook. Marcel Dekker, Inc.
- Hernández Reséndiz, M.; Estudio comparativo sobre los efectos en las propiedades microestructurales de la magnesia sinterizada con adiciones de nanopartículas de titania partiendo de precursores de Mg(OH)2 y MgO cáustico de origen sintético en México; Tesis, UANL México; 2021.Shand, M. A. (2006). The Chemistry and Technology of Magnesia. John Wiley & Sons.
- Castillo Rodríguez, G. A.; Estudio experimental de la fusión de magnesia por horno de arco eléctrico para la industria refractaria; Tesis UANL, México, 1992.Pasto, J. D., & Johnson, R.C. (2003). Determination of Organic Structures/Establishment of Organic Structures. Editorial Reverté.
- Crist, B. V. & XPS International. (2004). Handbooks of Monochromatic XPS Spectra (Vol. 1). XPS International LLC.Polytechnic University of Valencia (UPV). (2011, 24 October). Determination of crystal structures: X-ray diffraction [Video]. UPV. http://www.upv.es/visor/media/bc6e5368-2d78-1544-907c-45c9da6281f0/c
- Blasco T., Camblor M.A., Corma A., Perez-Pariente J.; The state of Ti in titanoaluminosilicates isomorphous with zeolite β; J. Am. Chem. Soc. 115, 11806 (1993).Mattox, D.M., & Sequeda, F. (n.d.). Educational guides for the processing, characterization and applications of thin layer coatings. UNIVALLE.
- Ch. Cardinaud - G. Lemperiere - M.C. Peignon - P.Y. Jouan, Characterisation of TiN coatings and of the TiN/Si interface by X-ray photoelectron spectroscopy and Auger electron spectroscopy, Applied Surface Science, Vol 68, pp. 595-603. 1993.Phase Equilibria Diagrams Database (NIST Standard Reference Database 31), The American Ceramic Society and the National Institute of Standards and Technology, 2014. Figure Number 92-003; www.nist.gov/srd/nist31.cfm
- Xudong Jiang, Yupeng Zhang, Jing Jiang, Yongsen Rong, Yancheng Wang, Yichu Wu, and Chunxu Pan; Characterization of Oxygen Vacancy Associates within Hydrogenated TiO2: A Positron Annihilation Study. American Chemical Society J. Phys. Chem. C 2012, 116, 22619−22624 doi.org/10.1021/jp307573cPickering, W. F. (2021). Modern Analytical Chemistry. Reverte.
- Enjun Wang, Wensheng Yang, and Yaan Cao; Unique Surface Chemical Species on Indium Doped TiO2 and Their Effect on the Visible Light Photocatalytic Activity. J. Phys. Chem. C 2009, 113, 20912–20917Chapter IV. Differential thermal analysis. (n.d.). Digital Library of Universidad de los Andes. Retrieved September 3, 2021, from http://bdigital.ula.ve/storage/pdf/31865.pdf
- P. T. Hsieh, Y.C. Chen, K. S. Kao and C.M. Wang; Luminescence mechanism of ZnO thin film investigated by XPS measurement. Appl. Phys. A 90, 317–321 (2008). DOI: 10.1007/s00339-007-4275-3What is titanium dioxide? (2020, 2 March). TDMA. https://tdma.info/es/que-es-el-dioxido-de-titanio/
- Ju.F. Huravlev - M.V. Kuznetsov - V.A. Gubanov; XPS analysis of adsorption of oxygen molecules on the surface of Ti and TiNx films in vacuum. Journal of Electron Spectroscopy and Related Phenomena, Vol 38, 169-176, 1992. No. public. 208, http://www.lasurface.com/database/liaisonxps.php?bib=208Pulluaim, R. (2020, May 13). Uses of titanium dioxide | Chemical safety information. ChemicalSafetyFacts.org. https://www.chemicalsafetyfacts.org/es/dioxido-de-titanio/
- T. Ször ́enyi, L.D. Laude, I. Bert ́oti, Z. K ́antor, Z. Geretovszky, J. Appl.Phys.78, 6211 (1995)Alvarado Barrera, E. A.B. (1998). Thesis: Production of oxide powders from different precursors. http://eprints.uanl.mx/6383/1/1080098257.PDF
- A. Casagrande, A. Glisenti, E. Lanzoni, E. Tondello, L. Mirenghi, M. Casarin, R. Bertoncello (1992), Surface and Interface Analysis (Vol 18).Flores, M. E. F. F. (2018). Synthesis of Laminar Materials in one Step and their performance in the Photo-Conversion of Carbon Dioxide to Renewable Fuels. UANL Thesis.
- T.L. Barr; The nature of the relative bonding chemistry in zeolites: an XPS study. Journal Phys. Chem., Vol 10, 760-765, Dec 1990. No. public. 191, http://www.lasurface.com/database/liaisonxps.php?bib=191BRUCITE. (2018, 21 April). Fdminerals, Minerals and Fossils Collection. https://www.fdminerals.es/2018/04/21/brucita/
- B. Vincent Crist, Ph.D.; Handbook of The Elements and Native Oxides, XPS International, Inc,3408 Emerald Drive, Ames, Iowa, 50010 USA. anuary 1999.Bolívar, G. (2019, August 12). Magnesium Hydroxide: Structure, Properties, Nomenclature, Uses. Lifeder. Https://Www.Lifeder.Com/Hidroxido-De-Magnesio/
- Wagner,CD., Zatko,D.A., Raymond,RH. Anal.Chern.52,1445(1980).Perales, I. A. P.M. (2015). Synthesis of TiO2-based Nanostructures Obtained by the Microwave-Assisted Hydrothermal Method. Thesis IPICYT.
- Haycock, D.E., Nicholls, e.J., Drch, D.S., Webber, M.J., Wiech, G. l. Chern. Soc. Dalton Trans., 1791 (1978).Crist, B. V. & XPS International. (2004). Handbooks of Monochromatic XPS Spectra (Vol. 1). XPS International LLC.
- Ling Wang, Guorui Yang, Shengjie Peng, Jianan Wang,Dongxiao Ji, Wei Yan, Seeram Ramakrishna; Fabrication of MgTiO3 nanofibers by electrospinning and their photocatalytic water splitting activity. International Journal of Hydrogen Energy 42 (2017) 25882-25890. https://doi.org/10.1016/j.ijhydene.2017.08.194Moulder, J. F., Chastain, J., & King, R.C. (1995). Handbook of X-ray Photoelectron Spectroscopy. Physical Electronics.
- Ni Zhang, Huiyuan Xue and Rongrong Hu; The activity and stability of CeO2@CaO catalysts to produce biodiesel. The Royal Society of Chemistry 2018; Adv., 2018, 8, 32922–32929. https://doi.org/10.1039/c8ra06884dTable of Elements | Thermo Fisher Scientific - NL. (n.d.). Thermofisher. https://www.thermofisher.com/nl/en/home/materials-science/learning-center/periodic-table.html
- Phase Equilibria Diagrams Database (NIST Standard Reference Database 31), The American Ceramic Society and the National Institute of Standards and Technology, 2014. Figure Number 92-003; www.nist.gov/srd/nist31.cfmD. Briggs, M.P. Seah. (1993), Practical surface analysis, John WILLEY & SONS. (Vol. 1)
- Journal of Electron Spectroscopy and Related Phenomena: Tables of Contents (Vol. 63). (1993). Elsevier.
- A. Casagrande, A. Glisenti, E. Lanzoni, E. Tondello, L. Mirenghi, M. Casarin, R. Bertoncello (1992), Surface and Interface Analysis (Vol 18).
- Ch. Cardinaud - G. Lemperiere - M.C. Peignon - P.Y. Jouan, Characterisation of TiN coatings and of the TiN/Si interface by X-ray photoelectron spectroscopy and Auger electron spectroscopy, Applied Surface Science, Vol 68, pp. 595-603. 1993.
- Blasco T., Camblor M.A., Corma A., Perez-Pariente J.; The state of Ti in titanoaluminosilicates isomorphous with zeolite β; J. Am. Chem. Soc. 115, 11806 (1993).
- B. Vincent Crist, Ph.D;; Handbooks of Monochromatic XPS Spectra, Volume 1 - The Elements and Native Oxides. XPS International, Inc. 1999.
- Xudong Jiang, Yupeng Zhang, Jing Jiang, Yongsen Rong, Yancheng Wang, Yichu Wu, and Chunxu Pan; Characterization of Oxygen Vacancy Associates within Hydrogenated TiO2: A Positron Annihilation Study. American Chemical Society J. Phys. Chem. C 2012, 116, 22619−22624 doi.org/10.1021/jp307573c
- Enjun Wang, Wensheng Yang, and Yaan Cao; Unique Surface Chemical Species on Indium Doped TiO2 and Their Effect on the Visible Light Photocatalytic Activity. J. Phys. Chem. C 2009, 113, 20912–20917
- P. T. Hsieh, Y.C. Chen, K. S. Kao and C.M. Wang; Luminescence mechanism of ZnO thin film investigated by XPS measurement. Appl. Phys. A 90, 317–321 (2008). DOI: 10.1007/s00339-007-4275-3
- Ju.F. Huravlev - M.V. Kuznetsov - V.A. Gubanov; XPS analysis of adsorption of oxygen molecules on the surface of Ti and TiNx films in vacuum. Journal of Electron Spectroscopy and Related Phenomena, Vol 38, 169-176, 1992. No. public. 208, http://www.lasurface.com/database/liaisonxps.php?bib=208
- T. Ször ́enyi, L.D. Laude, I. Bert ́oti, Z. K ́antor, Z. Geretovszky, J. Appl.Phys.78, 6211 (1995)
- Ch. Cardinaud - G. Lemperiere - M.C. Peignon - P.Y. Jouan; Characterisation of TiN coatings and of TiN/Si interface by x-ray photoelectron spectroscopy and Auger electron spectroscopy. Applied Surface Science, Vol 68, 595-603, 1993. No. public. 43, http://www.lasurface.com/database/liaisonxps.php?bib=43
- A. Casagrande - A. Glisenti - E. Lanzoni - E. Tondello - L. Mirenghi - M. Casarin - R. Bertoncello; TiN, TiC and Ti(C,N) film characterization and its relationship to tribological behaviour. Surface and Interface Analysis, Vol 18, 525-531, Jan 1992. No. public. 197, http://www.lasurface.com/database/liaisonxps.php?bib=197
- T.L. Barr; The nature of the relative bonding chemistry in zeolites: an XPS study. Journal Phys. Chem., Vol 10, 760-765, Dec 1990. No. public. 191, http://www.lasurface.com/database/liaisonxps.php?bib=191
- B. Vincent Crist, Ph.D.; Handbook of The Elements and Native Oxides, XPS International, Inc,3408 Emerald Drive, Ames, Iowa, 50010 USA. anuary 1999.
- Wagner,CD., Zatko,D.A., Raymond,RH. Anal.Chern.52,1445(1980).
- Haycock, D.E., Nicholls, e.J., Drch, D.S., Webber, M.J., Wiech, G. l. Chern. Soc. Dalton Trans., 1791 (1978).
- Ling Wang, Guorui Yang, Shengjie Peng, Jianan Wang,Dongxiao Ji, Wei Yan, Seeram Ramakrishna; Fabrication of MgTiO3 nanofibers by electrospinning and their photocatalytic water splitting activity. International Journal of Hydrogen Energy 42 (2017) 25882-25890. https://doi.org/10.1016/j.ijhydene.2017.08.194
- Ni Zhang, Huiyuan Xue and Rongrong Hu; The activity and stability of CeO2@CaO catalysts to produce biodiesel. The Royal Society of Chemistry 2018; Adv., 2018, 8, 32922–32929. https://doi.org/10.1039/c8ra06884d