At present, it is unquestionable that machine learning (ML) modeling is one of the most promising and powerful tools for the development of diagnosis methods and technologies. It permits the fast cribbage and analysis of huge amounts of data from overwhelmingly complex biological matrices which, applied to diagnostics, can be translated into valuable support technologies that would ease rapid decision-making in early diagnosis and screening programs. WeIt haves been seen that one can find a great number of colorimetric and electrochemical sensing methods for the detection of biomarkers related to diabetes mellitus (DM) and diabetic rethinopathy (DR), including some recent efforts towards the development of sensor-array technologies exploiting or not ML models for the sensing of diverse biomarkers and for diagnose purposes (including DM).
- diabetes mellitus
- diabetic retinopathy
- early detection and diagnosis
- point-of-care
- glucose sensing
- sensor arrays
- machine learning
- Electronic tongue
- Electronic nose
- Artificial intelligence
1. Introduction
Diabetes mellitus (DM) is a group of metabolic diseases involving severe insulin deficiency with usually acute onset of hyperglycemia due to autoimmune destruction of pancreatic beta cells, or gradual onset of hyperglycemia due to insulin resistance [1]. Diabetic retinopathy (DR) is a complication of DM, and the main cause of blindness in working-age adults, which can be retarded, palliated, or even avoided if detected early. Unfortunately, most patients who develop this condition are asymptomatic until late stages, when treatment is less effective or DR is irreversible. Classically, screening procedures for DR are usually based on imaging techniques of the fundus of the eye. The analysis of such images has been optimized during the last years by machine learning (ML) methods, capable of detecting even microaneurysms—the earliest visible sign of retinal damage [2,3][2][3]. The relatively recent application of user-friendly and reasonably affordable smartphones for the implementation of computer-assisted approaches has permitted the exportation of such screening imaging-based methods to developing countries, where lack of funds and personnel have often been the limiting factors to their healthcare systems [4–7][4][5][6][7]. Many recent reviews have already extensively explored the possibilities of computer-assisted methods for screening DM and DR [4[4][7][8][9][10][11][12][13][14][15],7–15], which still present few actual applications in the form of commercially available products [4]. Less (but commendable) attention is paid to alternative and early DR detection techniques, such as electrochemical [16] or colorimetric [17–19][17][18][19]. These methods usually rely upon the detection of a biomarker (or multiple biomarkers simultaneously) which might indicate the presence of the target disease (potentially earlier than the image-based methods, which usually rely upon observation of already-damaged tissues) [20]. The higher reliability of these multi-targeted sensing approaches can even be improved by the use of technologies with multiple and diversely integrated sensors, for which the great amount of data can be efficiently filtered and processed by ML. In this entry, the review, wesearchers present a series of colorimetric (with special emphasis on naked-eye approaches) and electrochemical techniques for the non-invasive detection and/or quantification of DM biomarkers, including sensor arrays powered or not by ML models [21]. WThe researchers want to encourage the reader towards development of ML-powered sensor arrays for early diagnosis of DM and DR.
2. The Relevance of Early Detection of Type 2 DM
It has been observed that a subset of patients with type 2 DM (T2D) have signs of DR at the time of diagnosis; moreover, glucose intolerance or pre-diabetes is also associated with diabetic eye disease [22,23][22][23]. Therefore, improvement and accessibility of the screening for DM is directly related to the screening and identification of DR. Although DR prevalence seems to be higher and develops faster in type 1 DM (T1D) patients, it is more difficult to prevent DR in T2D patients, as its progression strongly depends on the duration of DM. T2D often remains undiagnosed for a longer time (even several years) compared to T1D [24]. Moreover, T2D is much more common than T1D (i.e., approximately 90% of the total DM cases) [25]. Consequently, a special emphasis has to be placed on the screening of T2D, provided the higher impact of the early detection of this type of DM and, therefore, prevention and mitigation of DR.
3. Non-Invasive Sampling
Even if blood testing is one of the most used methods in diagnosis of DM [26–29][26][27][28][29], great efforts have been made during the last century in the study of non-invasive testing alternatives [30]. Blood tests present risk of infection and require skilled personnel during both sampling and analysis. Moreover, multiple extractions are painful and generate fear and anxiety to some patients, which can lead to avoidance behaviors, with the subsequent public health and social consequences [31]. Thus, the use of other physiological fluids, which do not imply invasive techniques per se, are indeed desirable. Hence, the fluids considered in this revisewarch are urine, saliva, tears, sweat, and breath, which contain biomarkers relevant for the diagnosis of DM and DR and have already been studied in terms of sensing [30,32,33][30][32][33]; these have turned out to be promising alternatives for the development of less painful and more economic methods as compared to blood testing.
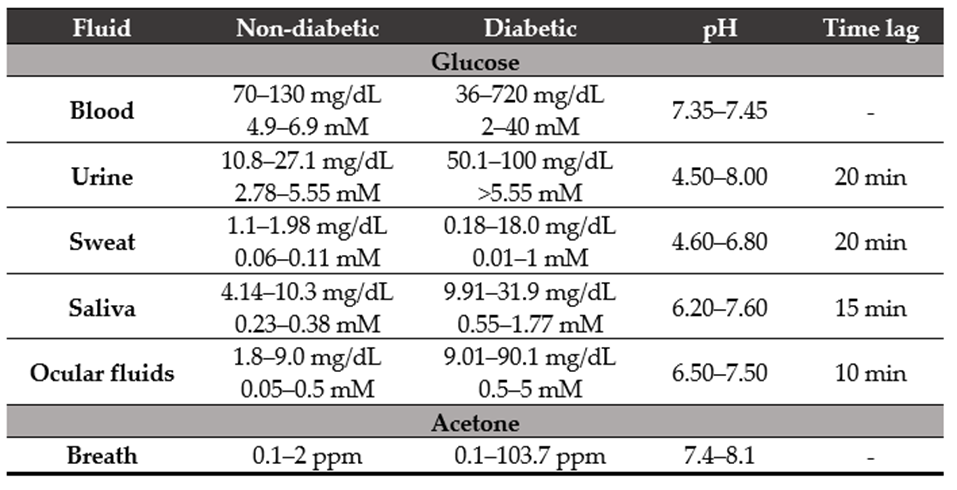
Table 1. Acetone [32] and glucose concentrations (mg/dL [33] and mM [32] units) in diverse rele-vant physiological fluids from patients with or without diabetes. The pH of the fluid [32] and the time required to diffuse blood from the capillaries to the tissues (time lag) [33] are also shown.
3.1. Urine
Urine is one of the best candidates as a diagnostic fluid for sensor arrays. Apart from permitting an easy, abundant, and non-invasive sampling, it is an aqueous solution (95% water) of inorganic salts containing, among others, urea. If obtained from a healthy individual, urine contains low concentration of lipids, proteins, and other high-molecular weight compounds, which eases the detection of abnormally-high quantities of these big molecules [33,66][33][34]. The detection of glucose in urine is used for the diagnosis of DM, with the test being considered positive with glucose concentrations above ~100 mg/dL (5.6 mM) [67–69][35][36][37], especially if used together with parallel methods or as a part of a multisensing system. Most colorimetric glucose sensors rely upon enzyme-based reactions due to their high specificity and catalytic efficiency [70–85][38][39][40][41][42][43][44][45][46][47][48][49][50][51][52][53]. These enzymatic approaches usually involve glucose-oxidase (GOx), due to its specificity towards glucose and its tolerance for extreme pH, temperature, and ionic strength changes in comparison to other enzymes [32,33,68,86][32][33][36][54]. Even if these tests might not be the most sensitive, they are a good alternative to invasive and more expensive/time-consuming methods for a fast and cost-effective screening [67,68][35][36].
3.2. Saliva
Saliva is an aqueous solution (~99.5% water), containing mainly electrolytes, sugars, vitamins, proteins, and polypeptides [31,33,101][31][33][55]. It is a good candidate as a diagnostic fluid, since its sampling is easy (no need for trained personnel) and not invasive, can be collected in substantial volumes (0.1–7 mL/min) and is a less complex matrix in comparison to other body fluids (e.g., blood) [33,101][33][55]. However, the simplicity of saliva stems from its concentration, not from its composition; it has been shown to present more than 1000 diverse proteins in it, and biomarkers that have great potential for rapid test purposes [31,66,101][31][34][55]. There are pathological conditions that can modify the composition of the saliva [66][34]. In fact, several studies point at its potential for screening purposes and its successful use for testing several diseases (e.g., renal disease monitoring, human immunodeficiency virus, dental studies, or Cushing’s disease) [31,33,101,102][31][33][55][56]. Actually, a correlation between salivary and blood glucose levels in patients with and without DM has been shown [103][57], and saliva has already been declared as an excellent candidate for the monitoring of T2D [31,33][31][33].
3.3. Breath
The analysis of breath for disease diagnosis is a practice used since the time of Hypocrates, when it was found to be a useful method for monitoring human health [114][58]. Human breath is mainly composed of N2 (78%), O2 (16%), CO2 (4–5%), H2 (5%), inert gases (0.9%), and water vapor, but it also contains traces of inorganic (e.g., N2O, NO, or CO) and organic (e.g., acetone, ethanol, isoprene, or ethane) volatile species [114,115][58][59]. Acetone was first considered as a good breath-biomarker for DM in 1857 [116][60], and it is actually a good candidate, as its concentration in human breath appears to rise as the severity of DM increases, and there is a linear correlation between its concentration in blood and breath [114,117][58][61]. As shown in Table 1, patients without DM usually present breath acetone concentration lower than 2 ppm, while those having DM have values which can grow up to tenths of ppm [32]. Along with acetone, also isoprene (105 ppb in the breath of a person without DM) and aldehydes have proved to be good biomarkers for DM, and there are specific sensing approaches for acetone, aldehydes, and isoprene sensing, but they are not colorimetric or use gas samples other than breath as a proof of concept [114,118][58][62].
| Fluid | Non-Diabetic | Diabetic | pH | Time Lag |
|---|---|---|---|---|
| Glucose | ||||
| Blood | 70–130 mg/dL 4.9–6.9 mM |
36–720 mg/dL 2–40 mM |
7.35–7.45 | - |
| Urine | 10.8–27.1 mg/dL 2.78–5.55 mM |
50.1–100 mg/dL >5.55 mM |
4.50–8.00 | 20 min |
| Sweat | 1.1–1.98 mg/dL 0.06–0.11 mM |
0.18–18.0 mg/dL 0.01–1 mM |
4.60–6.80 | 20 min |
| Saliva | 4.14–10.3 mg/dL 0.23–0.38 mM |
9.91–31.9 mg/dL 0.55–1.77 mM |
6.20–7.60 | 15 min |
| Ocular fluids | 1.8–9.0 mg/dL 0.05–0.5 mM |
9.01–90.1 mg/dL 0.5–5 mM |
6.50–7.50 | 10 min |
| Acetone | ||||
| Breath | 0.1–2 ppm | 0.1–103.7 ppm | 7.4–8.1 | - |
3.4. Tears
The volume of samples obtained from the tears by means of, for instance, a Schirmer strip, can be enough for a single-sensor method but, usually, slightly higher volumes would be needed in multi-array sensing in order to obtain high-enough sensitivity [66][34]. Moreover, the procurement of tears is a relatively non-invasive technique, as its sampling implies the use of cumbersome methods that might not be especially comfortable to the patient, yet easily approachable [83][51]. Beyond this, one should not avoid mentioninc the potential of this rich fluid that contains numerous analytes of great relevance for the assessment of the health status of the patient [32], including numerous proteins that permit proteomic approaches in the diagnosis of DR [47,61,126–129][63][64][65][66][67][68].
3.5. Sweat
Sweat might not be the best option for multi-array screening approaches; it seems that this body fluid could be more suitable for monitoring purposes, especially in the form of wearable electrochemical devices, which are usually interfaced with algorithm-based software [134][69]. This approach can overcome the lack of big amounts of sample with direct contact of the sensor with the skin. In order to gain more insight into this complex fluid and its applications in diagnostics, wthe researchers refer to the reviews from Senf et al. [66][34], Bandodkar et al. [135][70], and Kim et al. [136][70]. Additionally, an interesting microfluidic, colorimetric approach is presented by Choi et al. [137][69].
4. Sensor Array ML Technologies for DM and DR Screening
4.1. The great potential of sensor arrays
All physiological fluids are complex matrices with many potential interfering factors, which are concomitant part of the heterogeneous nature of DM (depending on, for instance, the patient) [25]. Consequently, the restudyearch of a single biomarker in a fluid can easily lead to many technical issues, with the results obtained being false positive or negative. In order to overcome this problem, we the researchers propose the design of sensor arrays, based on diverse principles (e.g., chemical, enzymatic, pH or immunoassay-based), as well as the inclusion of diverse biomarkers. This approach can provide a much more meaningful set of qualitative/quantitative information, which would significantly improve the accuracy of the screening, leading to a more robust and reliable interpretation of the results. The multi-marker approach is not new in the diagnostics area [25[25][71],34], but simpler, faster, and cheaper methods are needed for effective screening of DM and the consequent minimization of the related retinal damage in these patients. The designed sensor array should present the so-called ASSURED characteristics (affordable, sensitive, specific, user- friendly, rapid and robust, equipment free, and deliverable to end-users) as described by the World Health Organization, and they should permit their application as point-of-care (POC) screening devices [35][72].
4.2. The important role of ML
Sensor arrays can generate a great amount of data that, when correctly interpreted, provide filtered and relevant information. Such a great amount of data cannot always be understood intuitively by applying simple mathematical models—e.g., linear or polynomial regressions [36][73]. However, usually a hidden pattern explains the observed data, even if wthe researchers ignore the exact analytes and/or mechanisms that generate the output. By using ML approaches, it is possible to bypass the need for deep understanding of the hidden rules underlying the studied system, but still getting relevant information for the prediction of trends, groups, and characteristics [37,38][74][75]. ML models have proved to be robust for the diagnosis of several diseases [39–43][76][77][78][79][80], including ophthalmology-related ones [4,14][4][14]. In the literature, wthe resesarchers can find numerous examples of ML-sensor-array technologies for diagnostics, from techniques to detect lung cancer [44][81] to multi-sensors capable of diagnosing respiratory diseases and breast cancer from breath air [45[82][83],46], which proves the great potential of these approaches for pre-clinical diagnosis, screening purposes, and to assist practitioners in making fast decisions [46][83]. The miniaturization of such devices and the optimization of the related production process could lead in the near future to the fabrication of POC sensor-array systems, with coupled software trained to diagnose a disease or condition (or even more than one) by simple non-invasive analysis of the breath, urine, saliva, tears, and/or sweat of the patient.
4.3. Some non-invasive ML-powered sensing approaches
Electronic noses (gas electrochemical sensor arrays) are a promising technological platform for the diagnosis of T2D. Esfahani et al. [99][84] present electronic nose-based technologies that present a differentiated electrochemical response to urinary volatile organic compounds. After analyzing 140 urine samples from healthy and T2D patients and classifying the data using diverse ML approaches, they demonstrated that the developed tools discriminated between the two patient groups with an area under curve between 85–96%. A more recent publication [100][85] reaches 96–100% accuracy for T2D diagnosis exploiting the same electronic nose principle with urine samples, using both principal components analysis and an ML algorithm. Malik et al. [112][86], driven by the strong potential of electrochemical variations in saliva for the detection of blood glucose, developed an electrochemical ML sensing technology that could use this physiological fluid for the assessment of glucose in blood. They reached an 85% accuracy, which is comparable to the accuracy of commercially available glucose sensing dispositives. They also point out the possibility of miniaturizing these ion-selective sensor arrays for POC usage. Sarno et al. [123][87] propose an Arduino-assisted electronic nose capable of distinguishing among healthy (150 mg/dL) blood glucose concentrations by the analysis of the breath of the patient. The electrochemical data obtained from the sensor array was processed by a deep-learning classification method after optimization with discrete wavelet transform, and the output show an accuracy of 96.29%. A similar approach is also presented by Parte et al. [124][88], with a conductivity-based metal oxide gas sensor array and a modified deep learning convolution neural network algorithm integrated with support vector machines in order to detect acetone in breath and correlate it to DM. The later are just two recent representative examples of the great potential of electronic noses (and gas sensor arrays in general) coupled to ML approaches for the non-invasive diagnosis of diabetes [125][89].
5. Conclusion
The diagnosis of a disease is a complex task involving a great number of factors, variability and uncertainty, and DM and DR are no exception. It is implausible to achieve a satisfactory verdict within an acceptable confidence range by relying upon a single factor. That is one of the multiple reasons why there is a growing interest in big-data studies (and their related computational methods). ML techniques, such as principal component analysis (PCA) and partial least squares (PLS), are already widely used to model and predict inherent correlations in complex biological data, as is the case of metabolomics and proteomics studies [128,146][67][90].
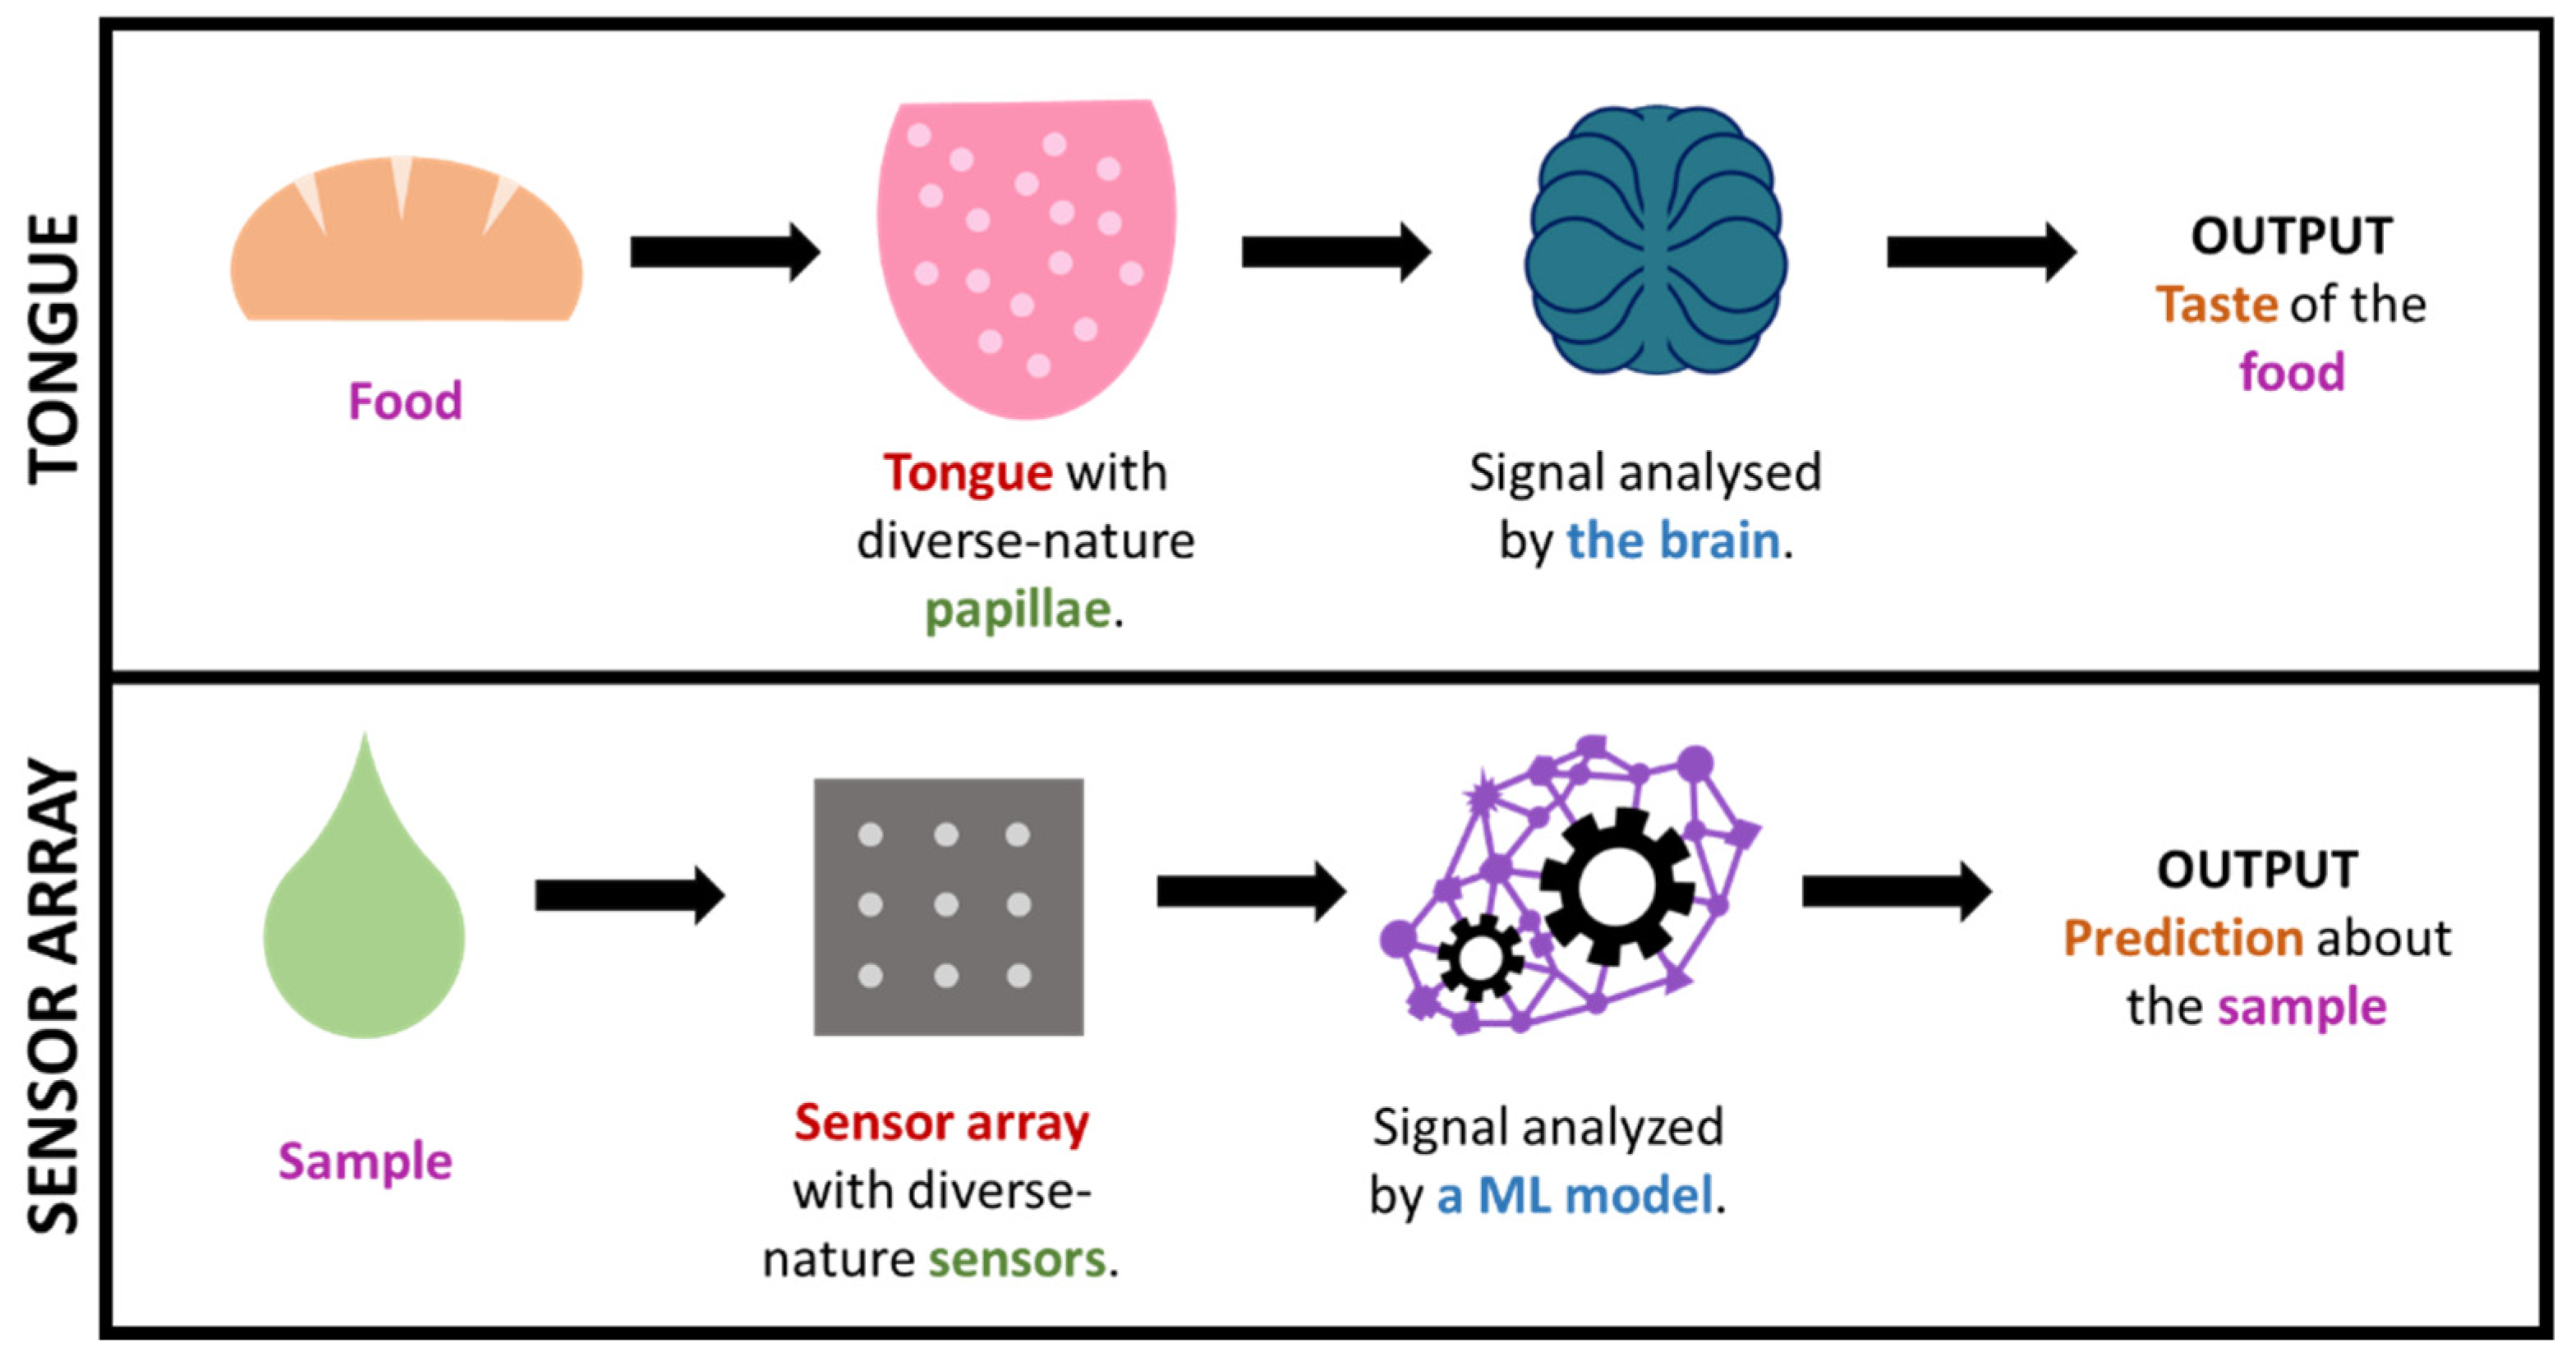
Figure 1. Simplified comparison of the sense of taste and a sensor array + ML technology.
In some cases, by using such big-data approaches, wthe researchers are, in a way, mimicking what nature already does in order to interpret complex information. This is the case, for in-stance, for taste or smell (See Figure 1), where a considerable amount of sensors presenting diverse responses to different odor/taste molecules produce a great amount of both relevant and irrelevant data, which creates a specific profile or ‘fingerprint’ that is latterly filtered and interpreted by the brain. This is how (generically speaking) some big-data/ML approaches work, including electronic noses/tongues [46,120,123,147–150][83][91][87][92][93][94][95]. It is worth highlighting that this fingerprint-based approach, which is commonly known as ‘non-targeted’, permits the gaining of useful output without the need of exactly knowing which specific analytes or processes occur in the sample (which tend to be markedly complex).
References
- Van Waateringe, R.P.; Fokkens, B.T.; Slagter, S.N.; Van Der Klauw, M.M.; Van Vliet-Ostaptchouk, J.V.; Graaff, R.; Paterson, A.D.; Smit, A.J.; Lutgers, H.L.; Wolffenbuttel, B.H.R. Skin autofluorescence predicts incident type 2 diabetes, cardiovascular disease and mortality in the general population. Diabetologia 2019, 62, 269–280.
- Mookiah, M.R.K.; Acharya, U.R.; Chua, C.K.; Lim, C.M.; Ng, E.Y.K.; Laude, A. Computer-aided diagnosis of diabetic retinopathy: A review. Comput. Biol. Med. 2013, 43, 2136–2155.
- Khalifa, N.E.M.; Loey, M.; Taha, M.H.N.; Mohamed, H.N.E.T. Deep transfer learning models for medical diabetic retinopathy detection. Acta Inform. Med. 2019, 27, 327–332.
- Grzybowski, A.; Brona, P.; Lim, G.; Ruamviboonsuk, P.; Tan, G.S.W.; Abramoff, M.; Ting, D.S.W. Artificial intelligence for diabetic retinopathy screening: A review. Eye 2020, 34, 451–460.
- Mamtora, S.; Sandinha, M.T.; Ajith, A.; Song, A.; Steel, D.H.W. Smart phone ophthalmoscopy: A potential replacement for the direct ophthalmoscope. Eye 2018, 32, 1766–1771.
- Furdova, A.; Furdova, A.; Krcmery, V. Our experience with smartphone and spherical lens for the eye fundus examination during humanitarian project in Africa. Int. J. Ophthalmol. 2017, 10, 157–160.
- Bolster, N.M.; Giardini, M.E.; Bastawrous, A. The Diabetic Retinopathy Screening Workflow: Potential for Smartphone Imaging. J. Diabetes Sci. Technol. 2016, 10, 318–324.
- Sengupta, S.; Singh, A.; Leopold, H.A.; Gulati, T.; Lakshminarayanan, V. Ophthalmic diagnosis using deep learning with fundus images—A critical review. Artif. Intell. Med. 2020, 102, 101758.
- Boral, Y.S. A Review on Automated Diabetic Retinopathy Detection using Pretrained Deep Neural Network. Int. J. Res. Appl. Sci. Eng. Technol. 2020, 8, 1568–1573.
- Alyoubi, W.L.; Shalash, W.M.; Abulkhair, M.F. Diabetic retinopathy detection through deep learning techniques: A review. Inform. Med. Unlocked 2020, 20, 15209–15252.
- Randive, S.N.; Senapati, R.K.; Rahulkar, A.D. A review on computer-aided recent developments for automatic detection of diabetic retinopathy. J. Med. Eng. Technol. 2019, 43, 87–99.
- Salamat, N.; Missen, M.M.S.; Rashid, A. Diabetic retinopathy techniques in retinal images: A review. Artif. Intell. Med. 2019, 97, 168–188.
- Tan, C.H.; Quah, W.H.; Tan, C.S.H.; Smith, H.; Car, L.T. Use of smartphones for detecting diabetic retinopathy: A protocol for a scoping review of diagnostic test accuracy studies. BMJ Open 2019, 9, e028811.
- Mateen, M.; Wen, J.; Hassan, M.; Nasrullah, N.; Sun, S.; Hayat, S. Automatic Detection of Diabetic Retinopathy: A Review on Datasets, Methods and Evaluation Metrics. IEEE Access 2020, 8, 48784–48811.
- Avram, R.; Olgin, J.E.; Kuhar, P.; Hughes, J.W.; Marcus, G.M.; Pletcher, M.J.; Aschbacher, K.; Tison, G.H. A digital biomarker of diabetes from smartphone-based vascular signals. Nat. Med. 2020, 26, 1576–1582.
- Devi, K.S.S.; Sasya, M.; Krishnan, U.M. Emerging vistas on electrochemical detection of diabetic retinopathy biomarkers. TrAC—Trends Anal. Chem. 2020, 125, 115838.
- Belsare, S.; Cot, G. Development of a colorimetric paper fluidic dipstick assay for measurement of glycated albumin to monitor gestational diabetes at the point-of-care. Talanta 2021, 223, 121728.
- Ki, H.; Jang, H.; Oh, J.; Han, G.-R.; Lee, H.; Kim, S.; Kim, M.-G. Simultaneous Detection of Serum Glucose and Glycated Albumin on a Paper-Based Sensor for Acute Hyperglycemia and Diabetes Mellitus. Anal. Chem. 2020, 92, 11530–11534.
- Hainsworth, D.P.; Gangula, A.; Ghoshdastidar, S.; Kannan, R.; Upendran, A. Diabetic Retinopathy Screening Using a Gold Nanoparticle–Based Paper Strip Assay for the At-Home Detection of the Urinary Biomarker 8-Hydroxy-2′-Deoxyguanosine. Am. J. Ophthalmol. 2020, 213, 306–319.
- Jenkins, A.J.; Joglekar, M.V.; Hardikar, A.A.; Keech, A.C.; O’Neal, D.N.; Januszewski, A.S. Biomarkers in diabetic retinopathy. Rev. Diabet. Stud. 2015, 12, 159–195.
- Krishnan, S.H.; Vinupritha, P.; Kathirvelu, D. Non-Invasive Glucose Monitoring using Machine Learning. In Proceedings of the 2020 International Conference on Communication and Signal Processing (ICCSP), Chennai, India, 28–30 July 2020; pp. 780–783.
- Diabetes Prevention Program Research Group. The prevalence of retinopathy in impaired glucose tolerance and recent-onset diabetes in the Diabetes Prevention Program. Diabet. Med. 2007, 24, 137–144.
- Savage, S.; Estacio, R.O.; Jeffers, B.; Schrier, R.W. Urinary albumin excretion as a predictor of diabetic retinopathy, neuropathy, and cardiovascular disease in NIDDM. Diabetes Care 1996, 19, 1243–1248.
- Ahmad, E.; Davies, M.J.; Khunti, K. Rapid Review: Diabetic Retinopathy Screening during the COVID-19 Pandemic; Centre for Evidence-Based Medicine, CEBM, University of Oxford: Oxford, UK, 2020; Available online: https://www.cebm.net/covid-19/rapid-review-diabetic-retinopathy-screening-during-the-covid-19-pandemic/ (accessed on 30 October 2021).
- Ahluwalia, T.S.; Kilpeläinen, T.O.; Singh, S.; Rossing, P. Editorial: Novel biomarkers for type 2 diabetes. Front. Endocrinol. (Lausanne) 2019, 10, 649.
- Huang, T.; Glass, K.; Zeleznik, O.A.; Kang, J.H.; Ivey, K.L.; Sonawane, A.R.; Birmann, B.M.; Hersh, C.P.; Hu, F.B.; Tworoger, S.S. A network analysis of biomarkers for type 2 diabetes. Diabetes 2019, 68, 281–290.
- Laakso, M. Biomarkers for type 2 diabetes. Mol. Metab. 2019, 27, S139–S146.
- Umeno, A.; Fukui, T.; Hashimoto, Y.; Kataoka, M.; Hagihara, Y.; Nagai, H.; Horie, M.; Shichiri, M.; Yoshino, K.; Yoshida, Y. Early diagnosis of type 2 diabetes based on multiple biomarkers and non-invasive indices. J. Clin. Biochem. Nutr. 2018, 62, 187–194.
- Umeno, A.; Yoshino, K.; Hashimoto, Y.; Shichiri, M.; Kataoka, M.; Yoshida, Y. Multi-biomarkers for early detection of type 2 diabetes, including 10- and 12-(Z,E)- hydroxyoctadecadienoic acids, insulin, leptin, and adiponectin. PLoS ONE 2015, 10, e0130971.
- Gonzales, W.V.; Mobashsher, A.T.; Abbosh, A. The progress of glucose monitoring—A review of invasive to minimally and non-invasive techniques, devices and sensors. Sensors 2019, 19, 800.
- Tiongco, R.E.; Bituin, A.; Arceo, E.; Rivera, N.; Singian, E. Salivary glucose as a non-invasive biomarker of type 2 diabetes mellitus. J. Clin. Exp. Dent. 2018, 10, e902–e907.
- Bruen, D.; Delaney, C.; Florea, L.; Diamond, D. Glucose sensing for diabetes monitoring: Recent developments. Sensors 2017, 17, 1866.
- Jang, S. Review of Emerging Approaches in Non- or Minimally Invasive Glucose Monitoring and their Application to Physiological Human Body Fluids. Int. J. Biosens. Bioelectron. 2018, 4, 5–9.
- Senf, B.; Yeo, W.H.; Kim, J.H. Recent Advances in Portable Biosensors for Biomarker Detection in Body Fluids. Biosensors 2020, 10, 127.
- Yang, C.; Feng, W.; Li, Y.; Tian, X.; Zhou, Z.; Lu, L.; Nie, Y. A promising method for diabetes early diagnosis via sensitive detection of urine glucose by Fe–Pd/rGO. Dye. Pigment. 2019, 164, 20–26.
- Nguyen, N.D.; Van Nguyen, T.; Chu, A.D.; Tran, H.V.; Tran, L.T.; Huynh, C.D. A label-free colorimetric sensor based on silver nanoparticles directed to hydrogen peroxide and glucose. Arab. J. Chem. 2018, 11, 1134–1143.
- Su, L.; Feng, J.; Zhou, X.; Ren, C.; Li, H.; Chen, X. Colorimetric detection of urine glucose based ZnFe2O4 magnetic nanoparticles. Anal. Chem. 2012, 84, 5753–5758.
- Cai, L.; Wang, Y.; Wu, Y.; Xu, C.; Zhong, M.; Lai, H.; Huang, J. Fabrication of a microfluidic paper-based analytical device by silanization of filter cellulose using a paper mask for glucose assay. Analyst 2014, 139, 4593–4598.
- Li, B.; Fu, L.; Zhang, W.; Feng, W.; Chen, L. Portable paper-based device for quantitative colorimetric assays relying on light reflectance principle. Electrophoresis 2014, 35, 1152–1159.
- Li, Z.; Hou, L.; Zhang, W.; Zhu, L. Preparation of paper micro-fluidic devices used in bio-assay based on drop-on-demand wax droplet generation. Anal. Methods 2014, 6, 878–885.
- Mohammadi, S.; Maeki, M.; Mohamadi, R.M.; Ishida, A.; Tani, H.; Tokeshi, M. An instrument-free, screen-printed paper microfluidic device that enables bio and chemical sensing. Analyst 2015, 140, 6493–6499.
- Sun, J.Y.; Cheng, C.M.; Liao, Y.C. Screen printed paper-based diagnostic devices with polymeric inks. Anal. Sci. 2015, 31, 145–151.
- Yang, X.; Forouzan, O.; Brown, T.P.; Shevkoplyas, S.S. Integrated separation of blood plasma from whole blood for microfluidic paper-based analytical devices. Lab Chip 2012, 12, 274–280.
- Zhang, A.L.; Zha, Y. Fabrication of paper-based microfluidic device using printed circuit technology. AIP Adv. 2012, 2, 022171.
- De Tarso Garcia, P.; Garcia Cardoso, T.M.; Garcia, C.D.; Carrilho, E.; Tomazelli Coltro, W.K. A handheld stamping process to fabricate microfluidic paper-based analytical devices with chemically modified surface for clinical assays. RSC Adv. 2014, 4, 37637–37644.
- Zhu, W.J.; Feng, D.Q.; Chen, M.; Chen, Z.D.; Zhu, R.; Fang, H.L.; Wang, W. Bienzyme colorimetric detection of glucose with self-calibration based on tree-shaped paper strip. Sens. Actuators B Chem. 2014, 190, 414–418.
- Cha, R.; Wang, D.; He, Z.; Ni, Y. Development of cellulose paper testing strips for quick measurement of glucose using chromogen agent. Carbohydr. Polym. 2012, 88, 1414–1419.
- Chen, X.; Chen, J.; Wang, F.; Xiang, X.; Luo, M.; Ji, X.; He, Z. Determination of glucose and uric acid with bienzyme colorimetry on microfluidic paper-based analysis devices. Biosens. Bioelectron. 2012, 35, 363–368.
- Gabriel, E.F.M.; Garcia, P.T.; Cardoso, T.M.G.; Lopes, F.M.; Martins, F.T.; Coltro, W.K.T. Highly sensitive colorimetric detection of glucose and uric acid in biological fluids using chitosan-modified paper microfluidic devices. Analyst 2016, 141, 4749–4756.
- Zhou, M.; Yang, M.; Zhou, F. Paper based colorimetric biosensing platform utilizing cross-linked siloxane as probe. Biosens. Bioelectron. 2014, 55, 39–43.
- Soni, A.; Jha, S. kumar A paper strip based non-invasive glucose biosensor for salivary analysis. Biosens. Bioelectron. 2014.
- Wei, X.; Tian, T.; Jia, S.; Zhu, Z.; Ma, Y.; Sun, J.; Lin, Z.; Yang, C.J. Microfluidic Distance Readout Sweet Hydrogel Integrated Paper-based Analytical Device (µDiSH-PAD) for Visual Quantitative Point-of-Care Testing. Anal. Chem. 2016, 88, 2345–2352.
- Li, X.; Gao, L.; Chen, Z. Highly sensitive colorimetric detection of glucose through glucose oxidase and Cu2+-catalyzed 3,3′,5,5′-tetramethylbenzidine oxidation. Spectrochim. Acta—Part A Mol. Biomol. Spectrosc. 2019, 213, 37–41.
- Galant, A.L.; Kaufman, R.C.; Wilson, J.D. Glucose: Detection and Analysis. Food Chem. 2015, 188, 149–160.
- Soares Nunes, L.A.; Mussavira, S.; Sukumaran Bindhu, O. Clinical and diagnostic utility of saliva as a non-invasive diagnostic fluid: A systematic review. Biochem. Med. 2015, 25, 177–192.
- Nieman, L.K. Cushing’s syndrome: Update on signs, symptoms and biochemical screening. Eur. J. Endocrinol. 2015, 173, M33–M38.
- Mussavira, S.; Dharmalingam, M.; Sukumaran, B.O. Salivary glucose and antioxidant defense markers in type II diabetes mellitus Saliv. Turkish J. Med. Sci. 2015, 45, 141–147.
- Das, S.; Pal, M. Review—Non-Invasive Monitoring of Human Health by Exhaled Breath Analysis: A Comprehensive Review. J. Electrochem. Soc. 2020, 167, 037562.
- Mazzone, P.J.; Wang, X.; Xu, Y. Exhaled Breath Analysis with a Colorimetric Sensor Array for the Identification and Characterization of Lung Cancer. J. Thorac. Oncol. 2012, 7, 137–142.
- Petters, W. Untersuchungen uber die Honigharnruhr. Vierteljahresschr. Prakt. Heilkd. 1857, 3, 81–94.
- Pereira, J.; Porto-Figueira, P.; Cavaco, C.; Taunk, K.; Rapole, S.; Dhakne, R.; Nagarajaram, H.; Câmara, J.S. Breath analysis as a potential and non-invasive frontier in disease diagnosis: An overview. Metabolites 2015, 5, 3–55.
- Righettoni, M.; Tricoli, A.; Pratsinis, S.E. Si:WO3 sensors for highly selective detection of acetone for easy diagnosis of diabetes by breath analysis. AIChE Annu. Meet. Conf. Proc. 2010, 82, 3581–3587.
- Corrie, S.R.; Coffey, J.W.; Islam, J.; Markey, K.A.; Kendall, M.A.F. Blood, sweat, and tears: Developing clinically relevant protein biosensors for integrated body fluid analysis. Analyst 2015, 140, 4350–4364.
- Csősz, É.; Boross, P.; Csutak, A.; Berta, A.; Tóth, F.; Póliska, S.; Török, Z.; Tőzsér, J. Quantitative analysis of proteins in the tear fluid of patients with diabetic retinopathy. J. Proteom. 2012, 75, 2196–2204.
- Torok, Z.; Peto, T.; Csosz, E.; Tukacs, E.; Molnar, A.; Maros-szabo, Z.; Berta, A.; Tozser, J.; Hajdu, A.; Nagy, V.; et al. Tear fluid proteomics multimarkers for diabetic retinopathy screening. BMC Ophthalmol. 2013, 13.
- Csősz, É.; Deák, E.; Kalló, G.; Csutak, A.; Tőzsér, J. Diabetic retinopathy: Proteomic approaches to help the differential diagnosis and to understand the underlying molecular mechanisms. J. Proteom. 2017, 150, 351–358.
- Torok, Z.; Peto, T.; Csosz, E.; Tukacs, E.; Molnar, A.M.; Berta, A.; Tozser, J.; Hajdu, A.; Nagy, V.; Domokos, B.; et al. Combined Methods for Diabetic Retinopathy Screening, Using Retina Photographs and Tear Fluid Proteomics Biomarkers. J. Diabetes Res. 2015, 2015.
- Kim, H.-J.; Kim, P.-K.; Yoo, H.-S.; Kim, C.-W. Comparison of tear proteins between healthy and early diabetic retinopathy patients. Clin. Biochem. 2012, 45, 60–67.
- Choi, J.; Kang, D.; Han, S.; Kim, S.B.; Rogers, J.A. Thin, Soft, Skin-Mounted Microfluidic Networks with Capillary Bursting Valves for Chrono-Sampling of Sweat. Adv. Healthc. Mater. 2017, 6, 1–10.
- Bandodkar, A.J.; Gutruf, P.; Choi, J.; Lee, K.H.; Sekine, Y.; Reeder, J.T.; Jeang, W.J.; Aranyosi, A.J.; Lee, S.P.; Model, J.B.; et al. Battery-free, skin-interfaced microfluidic/electronic systems for simultaneous electrochemical, colorimetric, and volumetric analysis of sweat. Sci. Adv. 2019, 5, 1–16.
- American Diabetes Association. Diagnosis and classification of diabetes mellitus. Diabetes Care 2010, 33, S62–S69.
- Martinez, A.W.; Phillips, S.T.; Whitesides, G.M.; Carrilho, E. Diagnostics for the developing world: Microfluidic paper-based analytical devices. Anal. Chem. 2010, 82, 3–10.
- Takami, G.; Tokuoka, M.; Goto, H.; Nozaka, Y. Machine Learning Applied to Sensor Data Analysis. Yokogawa Techn. Rep. Engl. Ed. 2016, 59, 27–30. Available online: https://web-material3.yokogawa.com/rd-te-r05901-006.pdf (accessed on 30 October 2021).
- Alpaydin, E. Introduction to Machine Learning, 2nd ed.; Alpaydin, E., Ed.; The MIT Press: Cambridge, MA, USA, 2010; ISBN 9780262012430.
- Zhao, W.; Bhushan, A.; Santamaria, A.D.; Simon, M.G.; Davis, C.E. Machine learning: A crucial tool for sensor design. Algorithms 2008, 1, 130–152.
- Myszczynska, M.A.; Ojamies, P.N.; Lacoste, A.M.B.; Neil, D.; Saffari, A.; Mead, R.; Hautbergue, G.M.; Holbrook, J.D.; Ferraiuolo, L. Applications of machine learning to diagnosis and treatment of neurodegenerative diseases. Nat. Rev. Neurol. 2020, 16, 440–456.
- Sajda, P. Machine learning for detection and diagnosis of disease. Annu. Rev. Biomed. Eng. 2006, 8, 537–565.
- Kononenko, I. Machine learning for medical diagnosis: History, state of the art and perspective. Artif. Intell. Med. 2001, 23, 89–109.
- de Bruijne, M. Machine learning approaches in medical image analysis: From detection to diagnosis. Med. Image Anal. 2016, 33, 94–97.
- Zhang, K.; Wang, J.; Liu, T.; Luo, Y.; Loh, X.J.; Chen, X. Machine Learning-Reinforced Noninvasive Biosensors for Healthcare. Adv. Healthc. Mater. 2021, 10.
- Huang, C.H.; Zeng, C.; Wang, Y.C.; Peng, H.Y.; Lin, C.S.; Chang, C.J.; Yang, H.Y. A study of diagnostic accuracy using a chemical sensor array and a machine learning technique to detect lung cancer. Sensors 2018, 18, 2845.
- Yang, H.Y.; Wang, Y.C.; Peng, H.Y.; Huang, C.H. Breath biopsy of breast cancer using sensor array signals and machine learning analysis. Sci. Rep. 2021, 11, 103.
- Chen, C.Y.; Lin, W.C.; Yang, H.Y. Diagnosis of ventilator-associated pneumonia using electronic nose sensor array signals: Solutions to improve the application of machine learning in respiratory research. Respir. Res. 2020, 21, 45.
- Esfahani, S.; Wicaksono, A.; Mozdiak, E.; Arasaradnam, R.P.; Covington, J.A. Non-invasive diagnosis of diabetes by volatile organic compounds in urine using FAIMs and FOX4000 electronic nose. Biosensors 2018, 8, 121.
- Gumelar, S.F.; Mustafa Budiyanto, H.; Fawwaz Mayda, M.; Alldino Ardi Sumbodo, B. Exploration of Electronic-Nose Potential as Diabetes Urine Detection using Machine Learning Algorithms. Int. J. Adv. Res. Sci. Eng. Technol. 2019, 6, 10157–10166.
- Malik, S.; Khadgawat, R.; Anand, S.; Gupta, S. Non-invasive detection of fasting blood glucose level via electrochemical measurement of saliva. Springerplus 2016, 5, 701.
- Sarno, R.; Sabilla, S.I.; Rahmanwijaya, D. Electronic nose for detecting multilevel diabetes using optimized deep neural network. Eng. Lett. 2020, 28, 31–42.
- Parte, R.S.; Patil, A.; Patil, A.; Kad, A.; Kharat, S. Non-Invasive Method for Diabetes Detection using CNN and SVM Classifier Abstract. Int. J. Res. Eng. Sci. Manag. 2020, 3, 659–661.
- Lekha, S.; Suchetha, M. Recent Advancements and Future Prospects on E-Nose Sensors Technology and Machine Learning Approaches for Non-Invasive Diabetes Diagnosis: A Review. IEEE Rev. Biomed. Eng. 2021, 14, 127–138.
- Sen, P.; Lamichhane, S.; Mathema, V.B.; McGlinchey, A.; Dickens, A.M.; Khoomrung, S.; Orešič, M. Deep learning meets metabolomics: A methodological perspective. Brief. Bioinform. 2020, 22, 1531–1542.
- Valle, M. Sensor Arrays and Electronic Tongue Systems. Int. J. Electrochem. 2012, 2012, 986025.
- del Valle, M. Electronic Tongues Employing Electrochemical Sensors. Electroanalysis 2010, 22, 1539–1555.
- Winquist, F. Voltammetric electronic tongues—Basic principles and applications. Microchim. Acta 2008, 163, 3–10.
- Kirsanov, D.; Correa, D.S.; Gaal, G.; Riul, A.; Braunger, M.L.; Shimizu, F.M.; Oliveira, O.N.; Liang, T.; Wan, H.; Wang, P.; et al. Electronic tongues for inedible media. Sensors 2019, 19, 5113.
- Riul, A.; Dantas, C.A.R.; Miyazaki, C.M.; Oliveira, O.N. Recent advances in electronic tongues. Analyst 2010, 135, 2481–2495.