Your browser does not fully support modern features. Please upgrade for a smoother experience.
Please note this is a comparison between Version 2 by Beatrix Zheng and Version 1 by Ellas Spyratou.
Cancer still constitutes one of the main global health challenges. Novel approaches towards understanding the molecular composition of the disease can be employed as adjuvant tools to current oncological applications. Raman spectroscopy has been contemplated and pursued to serve as a noninvasive, real time, in vivo tool which may uncover the molecular basis of cancer and simultaneously offer high specificity, sensitivity, and multiplexing capacity, as well as high spatial and temporal resolution.
- Raman spectroscopy
- cancer
- diagnosis
- in situ biopsy
- surgical oncology
- molecular fingerprint
1. Introduction
According to World Health Organization (WHO) [1], in 2020 nearly 10 million cancer deaths have been accounted worldwide while the most common cancer cases pertain breast cancer (2.26 million cases); lung cancer (2.21 million cases); and colon and rectum cancer (1.93 million cases) [2,3,4][2][3][4]. Therefore, the early and accurate diagnosis as well as the precise and adequate surgical removal of a malignancy can lead to the reduction of cancer’s high mortality rates [5,6,7][5][6][7]. Since the differentiation among benign tumors, premalignant, early-stage malignant and healthy tissue is challenging, repeated biopsies are often necessary. Positive predictive values regarding tissue sampling are as low as 22% for prostate cancer diagnosis, 1.4% for breast cancer, 18.5% in lung cancer screenings and 7–23% for melanoma diagnosis [8,9,10,11][8][9][10][11]. Various conventional imaging techniques have attempted to serve as adjuvant tools for biopsy and surgery guidance. In the field of ionizing radiation, positron emission tomography (PET), computed tomography (CT) and single photon emission computed tomography (SPECT) offer great results, with undisputable drawback relating to the dose deposition to the patient [12,13,14][12][13][14]. Simultaneously, magnetic resonance imaging (MRI), optical coherence tomography (OCT), white light reflectance (WLR), fluorescence, and high frequency ultrasound by exploiting non-ionizing radiation have proved to be valuable diagnostic tools [15,16,17,18][15][16][17][18]. Nonetheless, currently, no single imaging modality has been proven sufficient in terms of the required standards of specificity, sensitivity, multiplexing capacity, spatial and temporal resolution, and low cost [19,20][19][20]. Moreover, most techniques are unable to provide information regarding the molecular tissue composition [21,22][21][22]. They just confide on visual changes of the tissue structure and thus present lack of specificity [23,24][23][24].
2. Advanced Raman Systems in Clinical Praxis
2.1. Raman Systems for Early Diagnosis
According to the literature, Raman spectroscopy-based biopsy guidance presents overall specificities and sensitivities between 66–100% and 73–100% respectively [21,24][21][24]. The use of this technique promises a drastic increase in the accuracy of cancer diagnosis and an important reduction in the number of false positive biopsies [31,33,34][25][26][27]. The detector technology improvement, the in vivo fiber-optic probe design and the use of artificial intelligence algorithms as well as the collection of large independent comprehensive datasets obtained in the actual clinical workflow enable the facilitation of Raman-based systems into the routine clinical settings [23].
Fiber-optic probes have enabled the access of Raman spectroscopy in in vivo diagnostic techniques [55][28]. The ability of fiber probes to be inserted endoscopically, especially in hollow and solid organs, such as the upper gastrointestinal tract, the colorectal, and cervical cancers, or the oral cavity, the bladder, and the lung, enables in vivo measurements and in vivo assessment [55,75,76,77][28][29][30][31]. Advanced fiber probes such as probes with plasmonic nanostructures on their distal end surface can provide enhancement of the surface Raman scattering signal [78][32]. Moreover, fiber probes can overcome the limited penetration depth of laser radiation in tissues due to the high diffusion and scattering of photons. Figure 31 shows a portable Raman imaging system based on SERS fiber-optics probes capable of conducting white light endoscopy [79][33].
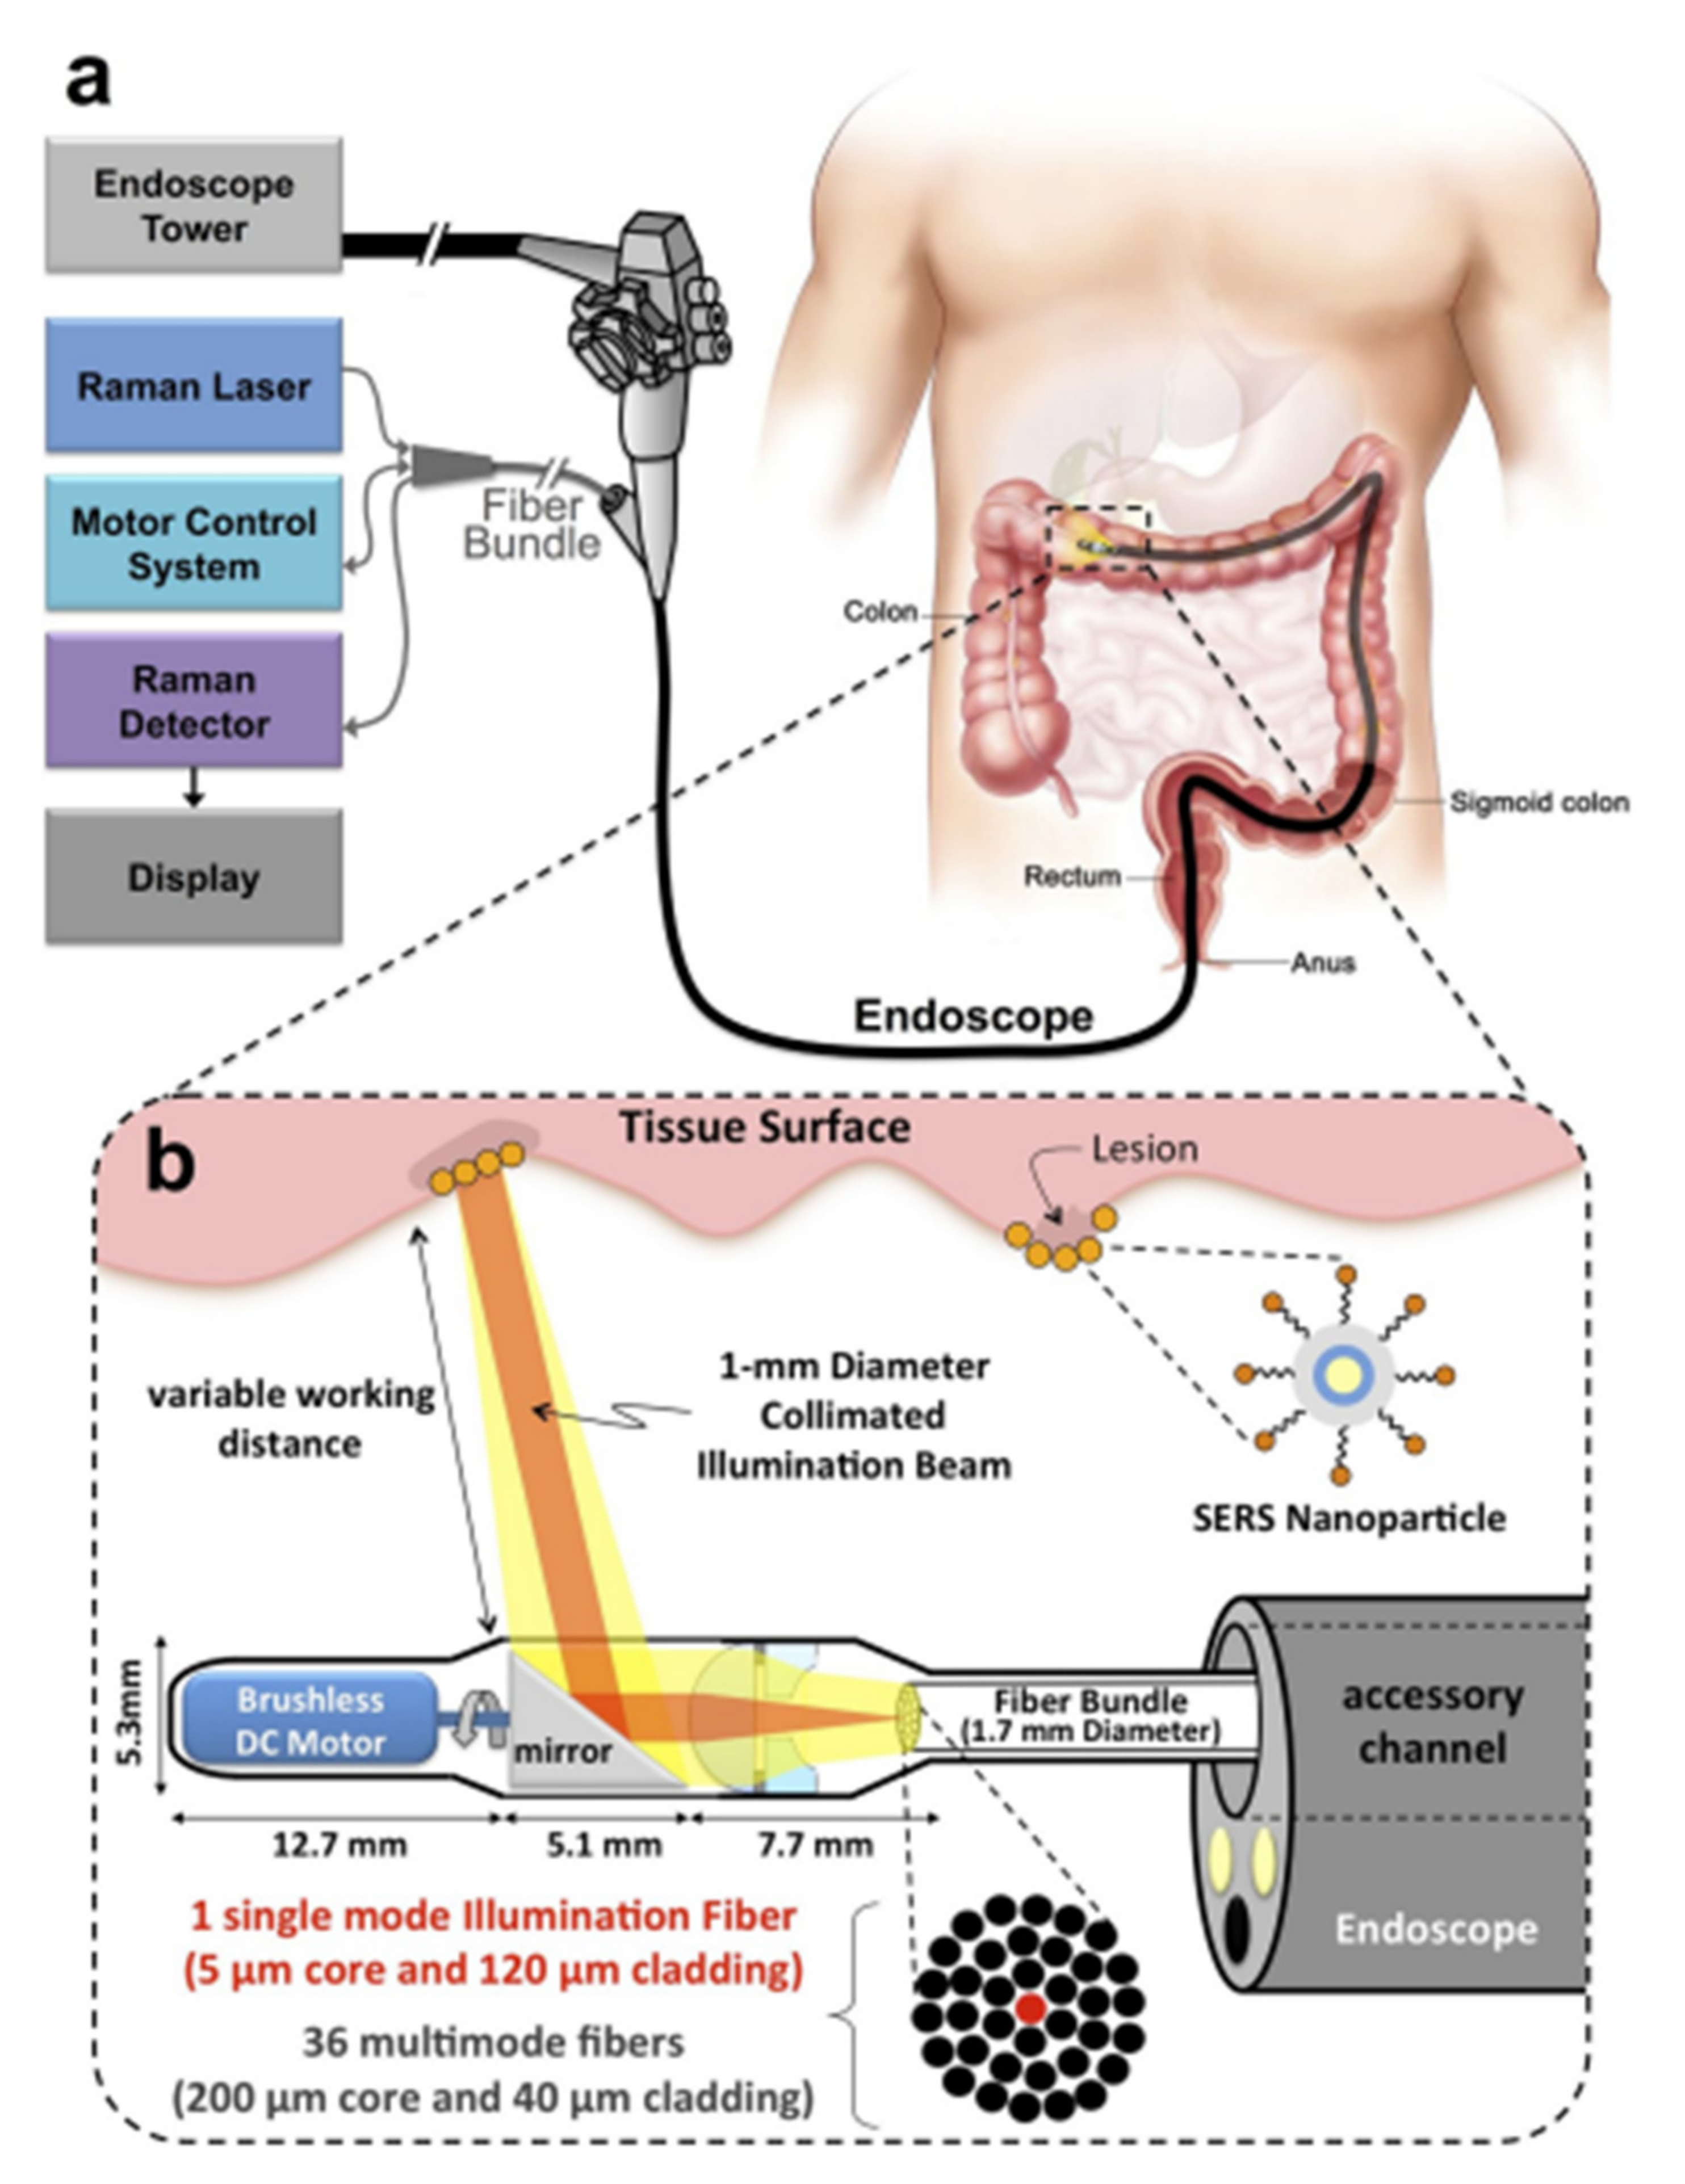
Figure 31. Schematic representation of a Raman system with SERS fiber-optic probe based Raman system which can perform white light endoscopy. (a) The design allows the Raman imaging system to get adapted on a clinical endoscope and scan the lumen as the endoscope is being retracted in the GI tract. (b) An expanded schematic illustration of the distal end of the device. The collimated beam can be swept by a brushless DC motor and its focus can be adjusted by a system of plano-convex and plano-concave lenses [79][33], https://doi.org/10.1371/journal.pone.0123185, access on 10 January 2022 ).
Moreover, novel Raman techniques combined with advanced fiber probes can offer a boost to Raman Spectroscopy’s application in clinical praxis. For example, Micro-scale spatially offset Raman spectroscopy with an optical fiber probe (micro-SORS) can collect photons from deeper layers by offsetting the position of the laser excitation beam [80][34] and by reaching a penetration depth up to 5 cm [81][35]. Recently, Zhang et al. combined micro-SORS with Surface-enhanced Raman spectroscopy (SERS) applied on a tissue phantom of agarose gel and biological tissue of porcine muscle [82][36]. According to their results, the penetration depth could be improved over 4 cm in agarose gel and 5 mm in porcine tissue compared to the 2 cm depth of agarose gel and the 3 mm depth in porcine muscle received by SERS measurements.
Stevens et al. and Wang et al. investigated epithelial tissue associated with dysplasia and developed a Raman probe coupled with a ball lens that could enhance in vivo Raman measurements from gastric premalignant epithelial tissue during endoscopy [83,84][37][38]. Due to the use of a ball lens, they managed to decrease the collection depth at 300 nm, which is the relevant depth for the analysis of gastric epithelium [83,84][37][38]. Moreover, they exploited a multimodal image-guided Raman technique to achieve real time in vivo cancer detection. Bergholt et al. used this high wavenumber system in combination with a foot pedal control switch and auditory feedback to the gastroenterologist during colonoscopy diagnosis [85][39]. Another team, Agenant et al., developed a novel Raman probe that could take measurements at the depth of 0–200 μm (average urothelium depth), the adequate level for superficial tissue sampling, in order to improve in vivo diagnosis of urothelial carcinoma [86][40]. This novel probe was comparted of seven collection fibers, one excitation fiber and two component front lens [86][40]. Figure 42 shows the different geometries of fiber-optics probes used in clinical applications such as endoscopic probes without any focusing optics, confocal endoscopic probes, and fiber probes for side-viewing [87][41].
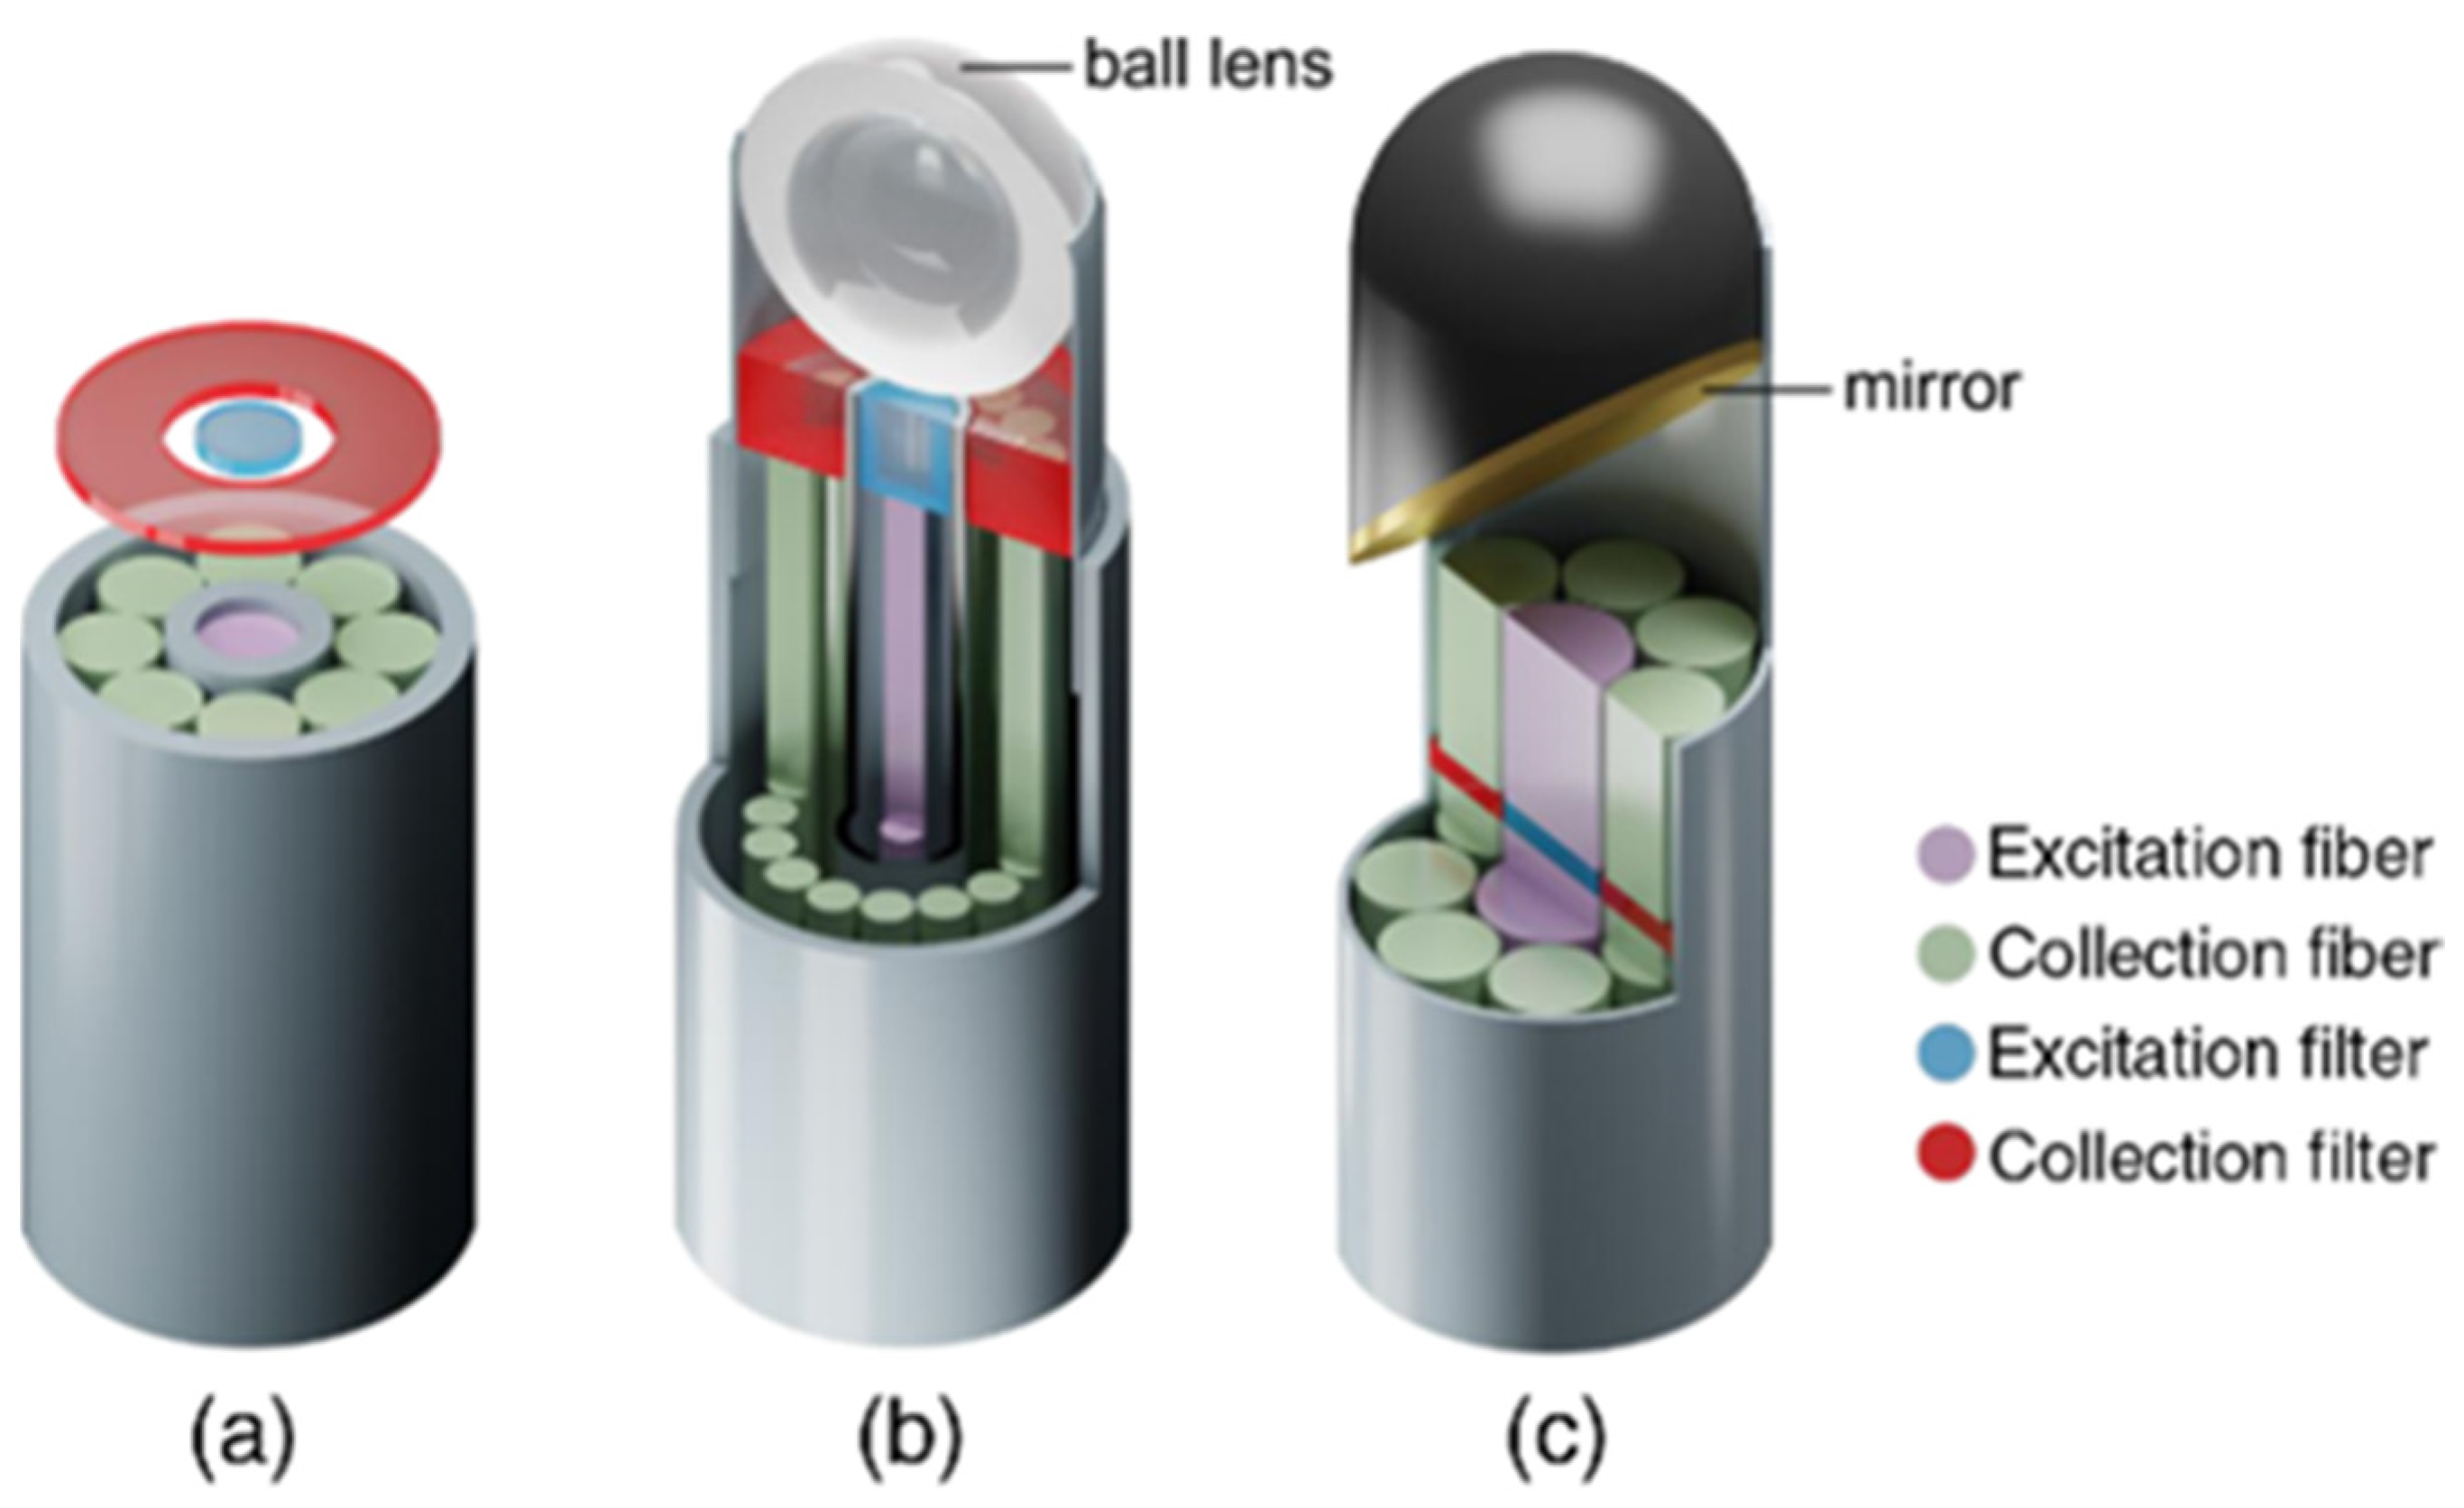
Figure 42. Different geometries of fiber-probes used in clinical applications: (a) non-superficial endoscopic probe with one excitation fiber in the center and seven collection fibers arranged around the emitter (b) confocal endoscopic fiber probe with a ball lens (c) fiber probes with mirror (or prisms) [87][41]. https://doi.org/10.1117/1.JBO.23.7.071210, access on 10 January 2022. PMID: 29956506. Excitation and collection filters are also depicted.
Challenges of fiber probe’s use pertain to the intense resemblance between the excitation laser light and the collection of the scattered light by the different tissue’s anatomical regions [88][42]. Some of the problems arise due to the background Raman and fluorescence signals created by the fiber’s materials and due to the intrinsic fluorescence signal (autofluorescence) of the tissue [54,89][43][44]. The separation between the collection and the excitation pathways is still a valid issue for Raman tissue measurements. The background Raman and fluorescence signals created inside the fiber require the separation between the collection and excitation pathway [27][45]. This generates a challenge regarding the minimum size of such devices. Nijssen et al. attempted to overcome this difficulty by detecting the high wavenumber region from 2500 to 3800 cm−1 (near-infrared region) of the Raman spectrum [47][46]. That way, the same silica-based fiber optic probe could both guide laser light to the tissue and simultaneously collect scattered light. At the same time, low overlap was achieved with the generated parasitic signals (Rayleigh scattering and Raman from the probe) [47][46] offering that way a perspective towards the miniaturization of such systems.
Moreover, the development of Raman instrumentation regarding in vivo and ex vivo applications is mainly focusing on the overcoming of issues such as: the speed of measurement, the instrumentation cost, and the background interference due to the different types of tissue. Advanced focal-plane detectors, volume-phase holographic gratings, stabilized diode lasers, and imaging polychromators are building a new perspective towards robust Raman instrumentation [90,91][47][48] which achieves high quantum efficiency, simultaneous spectral integration from the high spectral and lateral range and low background noise [90,91][47][48]. Therefore, the traditional limitations of low sensitivity and poor detection capability that Raman spectroscopy systems used to present are now dropping drastically [92][49]. New innovative techniques allow infrared and near infrared detection while cutting edge technologies promise system architectures with single photon detection capabilities and hybrid imaging technologies [91,93,94][48][50][51]. The development of an in vertical-external-cavity surface-emitting semiconducting laser presents a large gain area and transverse mode control of the extended cavity, and hence accomplishes a combination of high continuous wave output power and a near diffraction limited beam [93][50]. Furthermore, semiconductor lasers present the advantages of easy array fabrications and low cost of production [95][52].
2.2. Raman Systems for Guided Surgery
According to current practice, the primary treatment for solid tumors is surgical removal [96,97,98,99][53][54][55][56]. Adequate surgical margins, vital for disease control, are selected for the resection of the entirety of the cancerous tissue. Of vital importance is the preservation of all healthy structures, in cases where the anatomical regions allow it. However, the surgical resection techniques that are currently used are based on subjective methods, such as visual inspection or palpation to verify the exact margins between malignant and normal tissue [96,97,98,99][53][54][55][56]. This may lead to partial removal of the malignancies and consequently to the occurrence of residual tumors, strongly correlated with poor survival rates [96,97,98,99][53][54][55][56]. In addition to that, additional surgeries, or adjuvant therapies such as radiation therapy or chemotherapy may be required. Studies indicate that the five-year survival rate decreases drastically when a solid tumor is not dissected to its entirety [23,96,97,98,99][23][53][54][55][56]. Portable Raman systems have been implemented into the clinical environment of oncological surgeries presenting excellent assets such as the ability to offer representative sampling towards correct pathological diagnosis and accurate assistance in the definition of resection margins during surgery. As can be depicted in Figure 53, the objectivity of Raman spectroscopy as an imaging technique collaborated with the data analysis and classification capabilities of Machine Learning techniques could constitute a valuable intraoperative guidance tool.
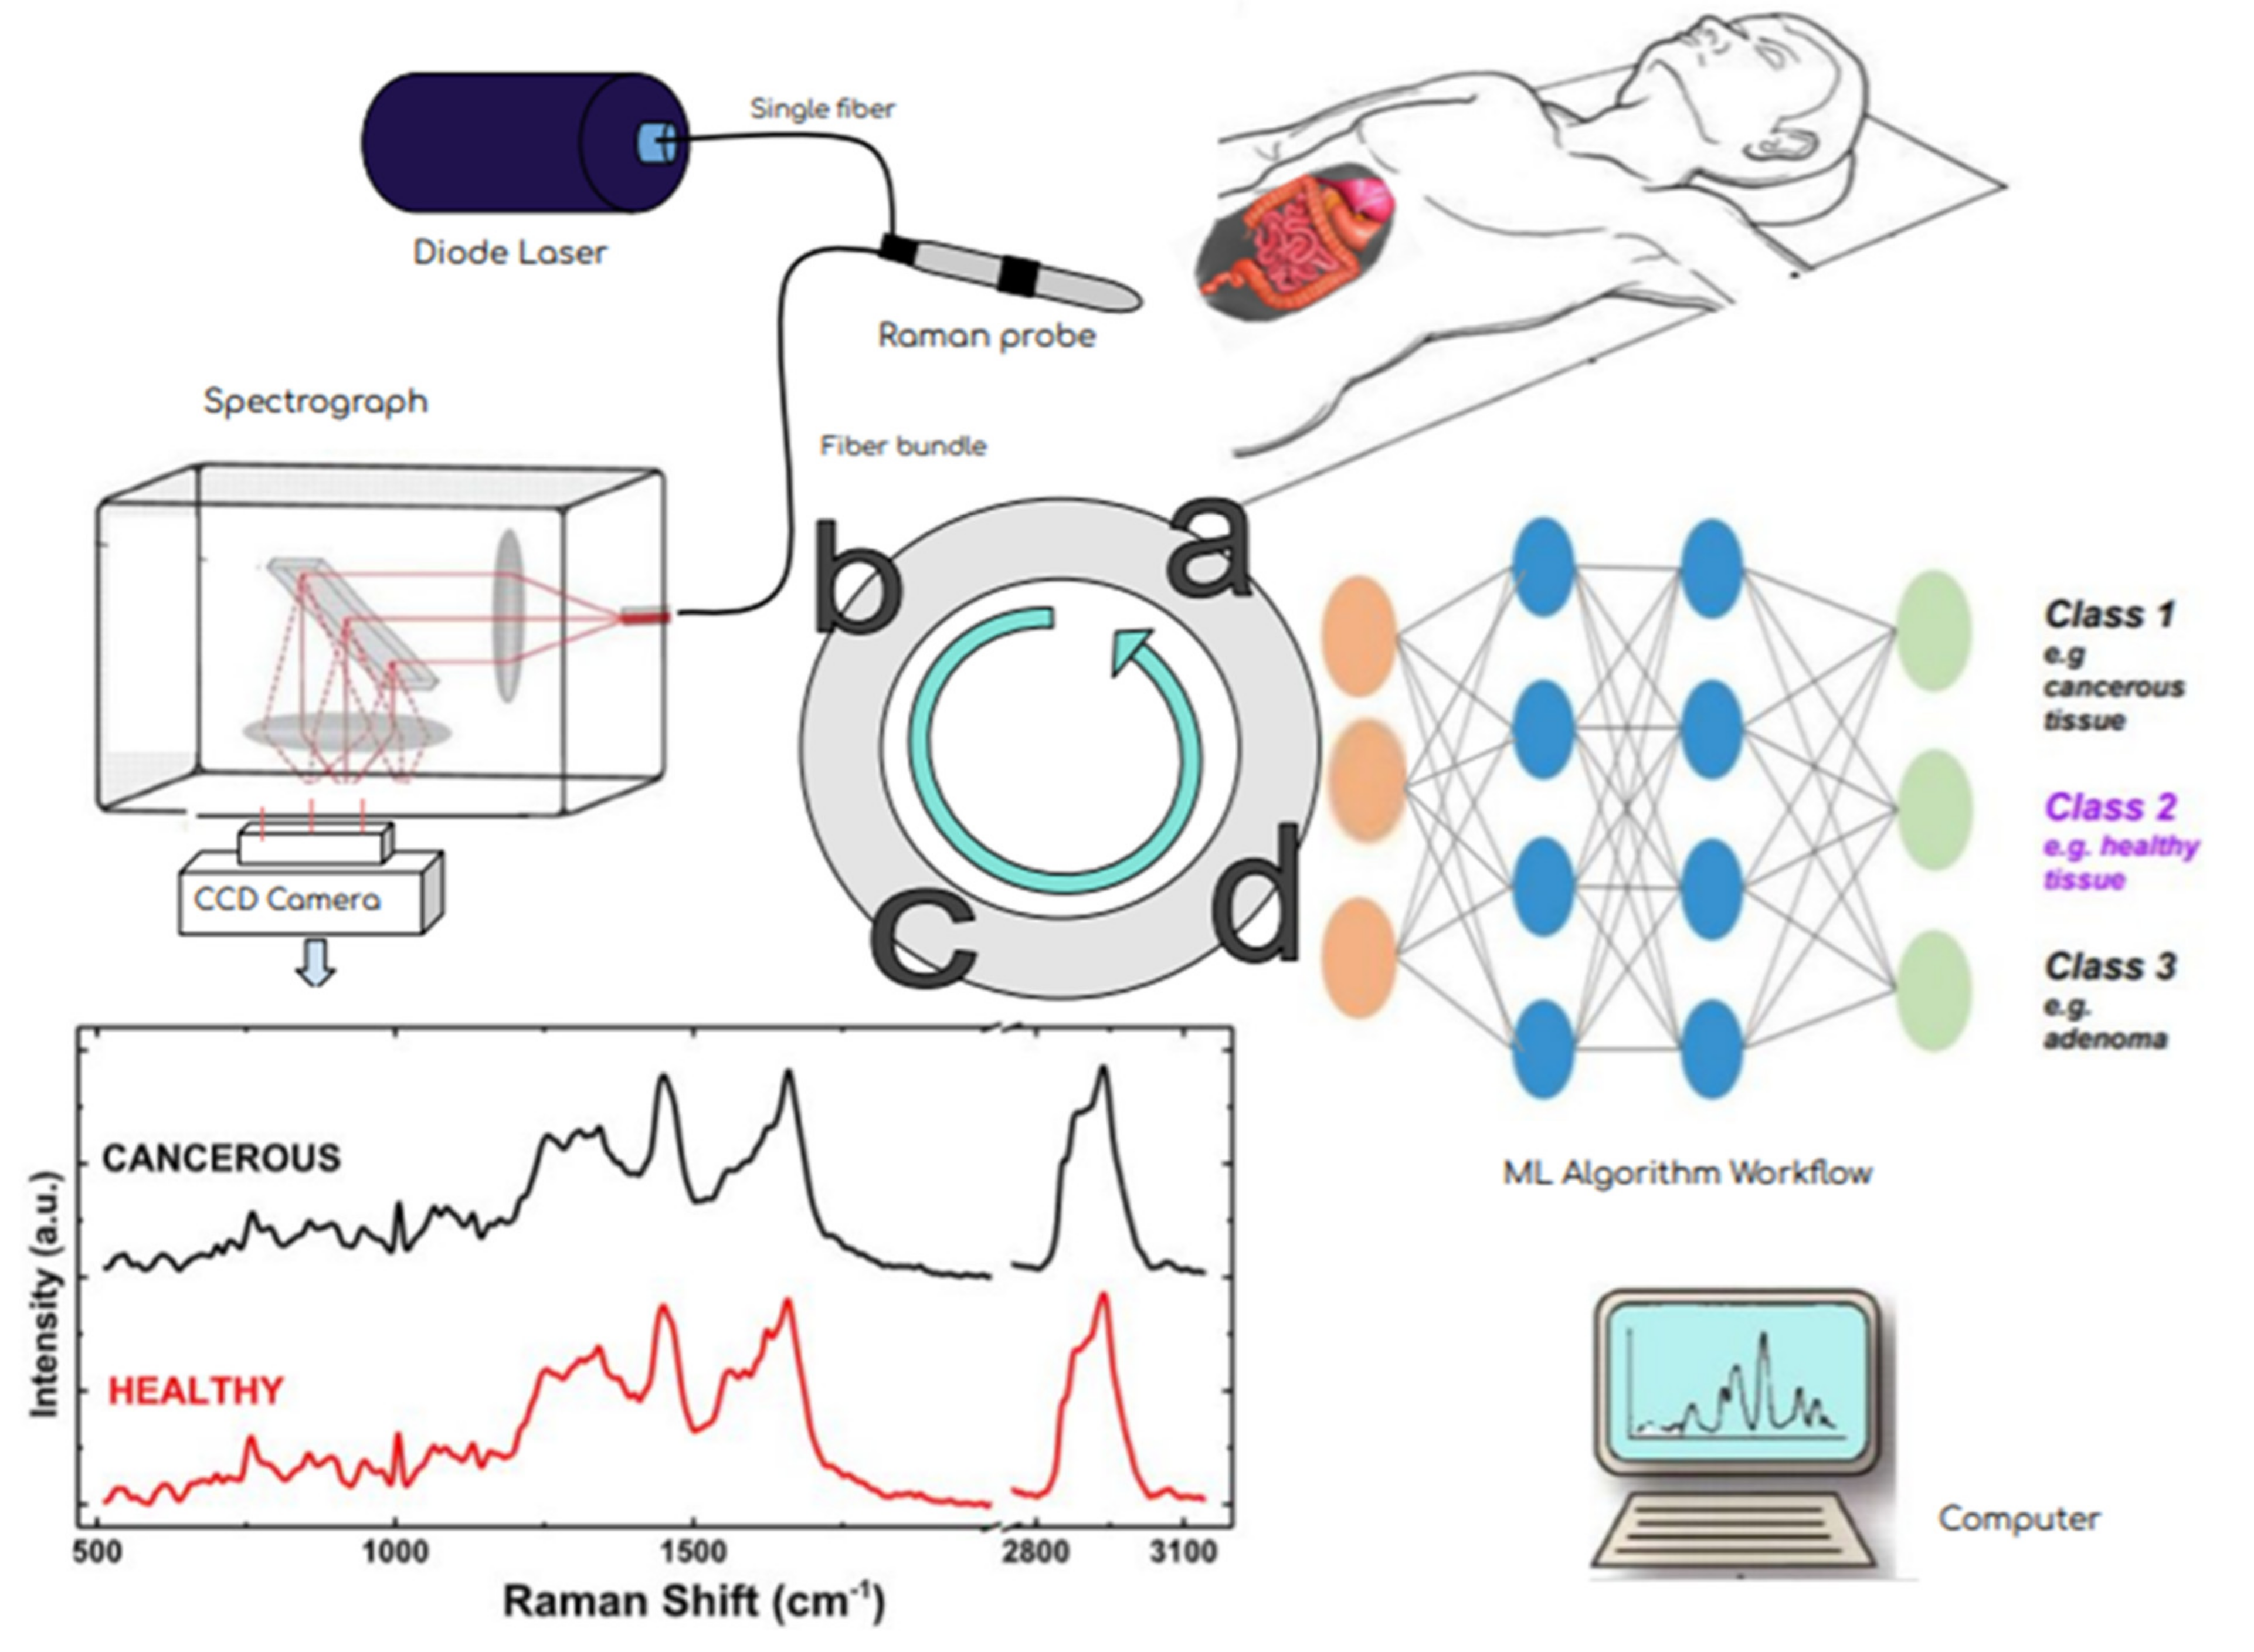
Figure 53. Effectiveness of oncologic surgery depends on precisely distinguishing healthy from malignant tissue during the operation. This flow diagram shows the steps of RS- based diagnosis from the patiant examination (a) via the multicomponent instrumentation (laser excitation–Raman probe-scattered light dispersion and detection) (b) in order to acquire the Raman spectra (schematic, not real data) in (c) and towards their analysis and classification via mashine learning techniques (d). A simple multi-layer perceptron neural network architecture is presented. In fact, the input layer is a data matrix with intensity values from different observations at various Raman frequencies. This combined methodology potentially has the ability to accurately differentiate benign from malignant tissue in real time and eventually improve the surgical outcome.
An intraoperative Raman system that directly measures brain tissue in patients has proven to distinguish dense and low-density cancer infiltration from benign brain tissue with a sensitivity of 93% and a specificity of 91% [100,101][57][58]. More precisely, the experimental setup was pertaining to a hand-held optic Raman probe and a 785 nm NIR Laser [101][58]. The research team exploited the boosted trees supervised machine learning algorithm to process their data and eventually differentiate the spectrum among cancerous and healthy brain tissue [101][58]. In another study, a real-time Raman intraoperative system was used during breast cancer surgery for the assessment of freshly resected specimens [102][59]. A total of 220 Raman spectra were collected with the aid of an 830-nm-diode laser focused on a Raman optical fiber probe [102][59]. This research has demonstrated that Raman spectroscopy could discriminate cancerous tissue from normal breast tissue with a sensitivity of 83% and a specificity of 93% [102][59].
A handheld contact Raman spectroscopy probe was used for real-time identification of brain cancer during surgery. Jermyn et al. obtained very fast and high-quality pure Raman signals from 0.5 mm tissue areas with sampling depth up to 1 mm during the tumor resection [66][60] by using micrometer-scale filters that were placed directly at the tip of the optical fibers [66][60]. A portable clinical fiber probe system in combination with a classification AI algorithm with the ability to differentiate healthy breast tissue from cancerous tissue was utilized by Barman et al. as a guidance tool for mastectomy procedures. The recorded specificity was 100% with sensitivity of 62.5% [33][26]. The differentiation among normal, breast cancer, fibroadenoma, and fibrocystic change was achieved with accuracy of 82.2% [33][26].
In order to reduce the time measurement of whole tissue sections in skin cancer, Kong et al. developed the approach of using auto-fluorescence images at excitation wavelengths of 377 nm and 292 nm in combination with Raman spectroscopy [42][61]. Since these wavelengths are the corresponding excited peaks of tryptophan and collagen, they managed to differentiate normal dermis (characterized by high collagen expression) to cancerous segments [42][61]. This method recorded measurements with specificity of 94% and sensitivity of 95% [42][61]. Short et al. conducted a study using Raman spectroscopy on ex vivo colon tissue from 18 patients, measuring both the fingerprint and high-wavenumber spectral regions [77][31]. The results indicated that, using the high-wavenumber region, the non-malignant and the malignant groups could be classified correctly with a specificity of 89% [77][31]. The authors referred that the high-wavenumber region could be used in vivo to improve the identification of neoplastic lesions. In the domain of colorectal cancer, Bergholt et al. using an endoscopic multi-fiber Raman probe measured both the fingerprint and high-wavenumber spectral regions of 50 patients in vivo [55][28]. The team attempted to differentiate Adenomatous polyps from hyperplastic polyps with a specificity of 83% and a sensitivity of 91% [55][28].
References
- Global Initiative for Cancer Registry Development. Available online: https://gicr.iarc.fr/about-the-gicr/the-value-of-cancer-data/ (accessed on 5 February 2021).
- Lyon: International Agency for Research on Cancer. Global Initiative for Cancer Registry Development. Available online: https://gco.iarc.fr/today (accessed on 5 February 2021).
- Global Health Data Exchange. Available online: http://ghdx.healthdata.org/gbd-results-tool (accessed on 5 February 2021).
- Martel, C.; Georges, D.; Bray, F.; Ferlay, J.; Clifford, G.M. Global burden of cancer attributable to infections in 2018: A worldwide incidence analysis. Lancet Glob. Health 2020, 8, 180–190.
- Wild, C.P.; Weiderpass, E.; Stewart, B.W. World Cancer Report: Cancer Research for Cancer Prevention; IARC Publications: Lyon, France, 2020.
- World Health Organization. Available online: https://www.who.int/publications/i/item/ncd-ccs-2019 (accessed on 5 March 2021).
- Geboes, K.; Geboes, K.; Jouret-Mourin, A. Endoscopy and Histopathology. In Endoscopy; IntechOpen: London, UK, 2013; Volume 1, pp. 3–32.
- Bokhorst, L.P.; Zhu, X.; Bul, M.; Bangma, C.H.; Schröder, F.H.; Roobol, M.J. Positive predictive value of prostate biopsy indicated by prostate-specific-antigen-based prostate cancer screening: Trends over time in a European randomized trial. BJU Int. 2012, 110, 1654.
- Rominger, M.; Wisgickl, C.; Timmesfeld, N. Breast microcalcifications as type descriptors to stratify risk of malignancy: A systematic review and meta-analysis of 10665 cases with special focus on round/punctate microcalcifications. Rofo 2012, 184, 1144–1152.
- McWilliams, A.; Tammemagi, M.C.; Mayo, J.R.; Roberts, H.; Liu, G.; Soghrati, K.; Yasufuku, K.; Martel, S.; Laberge, F.; Gingras, M.; et al. Probability of cancer in pulmonary noduls detected on first screening CT. N. Engl. J. Med. 2013, 369, 910–919.
- Carli, P.; Mannone, F.; De Giorgi, V.; Nardini, P.; Chiarugi, A.; Giannoti, B. The problem of false-positive diagnosis in melanoma screening: The impact of dermoscopy. Melanoma Res. 2003, 13, 179–182.
- Gambhir, S.S. Molecular imaging of cancer with positron emission tomography. Nat. Rev. Cancer 2002, 2, 683–693.
- Khalil, M.M.; Tremoleda, J.L.; Bayomy, T.B.; Gsell, W. Molecular SPECT Imaging: An Overview. Int. J. Mol. Imaging 2011, 2011, 1–15.
- Power, S.P.; Moloney, F.; Twomey, M.; James, K.; O’Connor, O.J.; Maher, M.M. Computed tomography and patient risk: Facts, perceptions and uncertainties. World J. Radiol. 2016, 8, 902–915.
- Kuo, W.-C.; Kim, J.; Shemonski, N.D.; Chaney, E.J.; Spillman, D.R.; Boppart, A.B. Real-time three-dimensional optical coherence tomography image-guided core-needle biopsy system. Biomed. Opt. Express 2012, 3, 1149–2012.
- Song, L.-M.W.K.; Banerjee, S.; Desilets, D.; Diehl, D.L.; Farraye, F.A.; Kaul, V.; Kethu, S.R.; Kwon, R.S.; Mamula, P.; Pedrosa, M.C.; et al. Autofluorescence imaging. Gastrointest. Endosc. 2011, 73, 647–650.
- Shin, D.; Vigneswaran, N.; Gillenwater, A.; Richards-Kortum, R. Advances in fluorescence imaging techniques to detect oral cancer and its precursors. Future Oncol. 2010, 6, 1143–1154.
- Haris, M.; Yadav, S.K.; Rizwan, A.; Singh, A.; Wang, E.; Hariharan, H.; Reddy, R.; Marincola, F.M. Molecular magnetic resonance imaging in cancer. J. Transl. Med. 2015, 13, 313.
- Keren, S.; Zavaleta, C.; Cheng, Z.; de la Zerda, A.; Gheysens, O.; Gambhir, S.S. Noninvasive molecular imaging of small living subjects using Raman spectroscopy. Proc. Natl. Acad. Sci. USA 2008, 105, 5844–5849.
- Blasberg, R.G. Molecular Imaging and Cancer. Mol. Cancer Ther. 2003, 2, 335.
- Wang, W.; Zhao, J.; Short, M.; Zeng, H. Real-time in vivo cancer diagnosis using raman spectroscopy. J. Biophotonics 2015, 8, 527–545.
- Nijssen, A.; Koljenović, S.; Schut, T.C.B.; Caspers, P.J.; Puppels, G.J. Towards oncological application of Raman spectroscopy. J. Biophotonics 2009, 2, 29–36.
- Kallaway, C.; Almond, L.M.; Barr, H.; Wood, J.; Hutchings, J.; Kendall, C.; Stone, N. Advances in the clinical application of Raman spectroscopy for cancer diagnostics. Photodiagnosis Photodyn. Ther. 2013, 10, 207–219.
- Santos, I.P.; Barroso, E.M.; Bakker Schut, T.C.; Caspers, P.J.; van Lanschot, C.G.F.; Choi, D.-H.; van der Kamp, M.F.; Smits, R.W.H.; van Doorn, R.; Verdijk, R.M.; et al. Raman spectroscopy for cancer detection and cancer surgery guidance: Translation to the clinics. Analyst 2017, 142, 3025–3047.
- Wang, W.; McGregor, H.; Short, M.; Zeng, H. Clinical utility of Raman spectroscopy: Current applications and ongoing developments. Adv. Health Care Technol. 2016, 2, 13–29.
- Barman, I.; Dingari, N.C.; Saha, A.; McGee, S.; Galindo, L.H.; Liu, W.; Plecha, D.; Klein, N.; Dasari, R.R.; Fitzmaurice, M. Application of Raman Spectroscopy to Identify Microcalcifications and Underlying Breast Lesions at Stereotactic Core Needle Biopsy. Cancer Res. 2013, 73, 3206–3215.
- Bratchenko, I.A.; Artemyev, D.A.; Myakinin, O.O.; Khristoforova, Y.A.; Moryatov, A.A.; Kozlov, S.V.; Zakharov, V.P. Combined Raman and autofluorescence ex vivo diagnostics of skin cancer in near-infrared and visible regions. J. Biomed. Opt. 2017, 22, 27005.
- Bergholt, M.S.; Lin, K.; Wang, J.; Zheng, W.; Xu, H.; Huang, Q.; Ren, J.L.; Ho, K.Y.; Teh, M.; Srivastava, S.; et al. Simultaneous fingerprint and high-wavenumber fiber-optic Raman spectroscopy enhances real-time in vivo diagnosis of adenomatous polyps during colonoscopy. J. Biophotonics 2015, 9, 333–342.
- Short, M.A.; Lam, S.; McWilliams, A.M.; Ionescu, D.N.; Zeng, H. Using Laser Raman Spectroscopy to Reduce False Positives of Autofluorescence Bronchoscopies: A Pilot Study. J. Thorac. Oncol. 2011, 6, 1206–1214.
- Krishna, H.; Majumder, S.K.; Chaturvedi, P.; Sidramesh, M.; Gupta, P.K. In vivo Raman spectroscopy for detection of oral neoplasia: A pilot clinical study. J. Biophotonics 2014, 7, 690–702.
- Short, M.A.; Tai, I.T.; Owen, D.; Zeng, H. Using high frequency Raman spectra for colonic neoplasia detection. Opt. Express 2013, 21, 5025–5034.
- Kwak, J.; Lee, W.; Kim, J.B.; Bae, S.I.; Jeong, K.H. Fiber-optic plasmonic probe with nanogap-rich Au nanoislands for on-site surface-enhanced Raman spectroscopy using repeated solid-state dewetting. J. Biomed. Opt. 2019, 24, 1–6.
- Garai, E.; Sensarn, S.; Zavaleta, C.L.; Loewke, N.O.; Rogalla, S.; Mandella, M.J.; Flet, S.A.; Friedland, S.; Liu, J.T.C.; Contag, C.H.; et al. A Real-Time Clinical Endoscopic System for Intraluminal, Multiplexed Imaging of Surface-Enhanced Raman Scattering Nanoparticles. PLoS ONE 2015, 10, e0123185.
- Matousek, P.; Clark, I.P.; Draper, E.R.C.; Morris, M.D.; Goodship, A.E.; Everall, N.; Towrie, M.; Finney, W.F.; Parker, A.W. Subsurface probing in diffusely scattering media using spatially offset Raman spectroscopy. Appl. Spectrosc. 2005, 59, 393–400.
- Stone, N.; Kerssens, M.; Lloyd, G.R.; Faulds, K.; Graham, D.; Matousek, P. Surface enhanced spatially offset Raman spectroscopic (SESORS) imaging—the next dimension. Chem. Sci. 2011, 2, 776–780.
- Yumin, Z.; Li, L.; Jing, H.Y. Optical penetration of surface-enhanced micro-scale spatial offset Raman spectroscopy in turbid gel and biological tissue. J. Innov. Opt. Health Sci. 2021, 14, 2141001.
- Stevens, O.; Petterson, I.E.I.; Day, J.C.C.; Stone, N. Developing fiber optic Raman probes for applications in clinical spectroscopy. Chem. Soc. Rev. 2016, 45, 1919–1934.
- Wang, J.; Lin, K.; Zheng, W.; Ho, K.; Teh, M.; Yeoh, K.; Huang, Z. Comparative study of the endoscope-based bevelled and volume fiber-optic Raman probes for optical diagnosis of gastric dysplasia in vivo at endoscopy. Anal. Bioanal. Chem. 2015, 407, 8303–8310.
- Duraipandian, C.; Bergholt, M.D.; Zheng, W.; Ho, K.Y.; Teh, M.; Yeoh, K.G.; So, J.B.Y.; Shabbir, A.; Huang, Z. Real-time Raman spectroscopy for in vivo, online gastric cancer diagnosis during clinical endoscopic examination. J. Biomed. Opt. 2012, 17, 81418.
- Agenant, M.; Grimbergen, M.; Draga, R.; Marple, E.; Bosch, R.; Van Swol, C. Clinical superficial Raman probe aimed for epithelial tumor detection: Phantom model results. Biomed. Opt. Express 2014, .5, 1203–1216.
- Cordero, E.; Latka, I.; Matthäus, C.; Schie, I.; Popp, J. In-vivo Raman spectroscopy: From basics to applications. J. Biomed. Opt. 2018, 23, 1–23.
- Latka, I.; Dochow, S.; Krafft, C.; Dietzek, B.; Popp, J. Fiber optic probes for linear and nonlinear Raman applications—Current trends and future development. Laser and Photonics Rev. 2013, 7, 698–731.
- Ly, S.; McNerney, G.; Fore, S.; Chan, J.; Huser, T. Time-gated single photon counting enables separation of CARS microscopy data from multiphoton-excited tissue autofluorescence. Opt. Express 2007, 15, 16839–16851.
- Motz, J.T.; Gandhi, S.J.; Scepanovic, O.R.; Haka, A.S.; Kramer, J.R.; Dasari, R.R.; Feld, M.S. Real-time Raman system for in vivo disease diagnosis. J. Biomed. Opt. 2005, 10, 31113.
- Wachsmann-Hogiu, S.; Weeks, T.; Huser, T. Chemical analysis in vivo and in vitro by Raman spectroscopy—from single cells to humans. Curr. Opin. Biotechnol. 2009, 20, 63–73.
- Nijssen, A.; Maquelin, K.; Santos, L.F.; Caspers, P.J.; Bakker Schut, T.C.; den Hollander, J.C.; Neumann, M.H.A.; Puppels, G.J. Discriminating basal cell carcinoma from perilesional skin using high wave-number Raman spectroscopy. J. Biomed. Opt. 2007, 12, 34004.
- Chen, K.; Qin, Y.; Zheng, F.; Sun, M.; Shi, D. Diagnosis of colorectal cancer using Raman spectroscopy of laser-trapped single living epithelial cells. Opt. Lett. 2006, 31, 2015–2017.
- Denson, S.C.; Pommier, C.J.S.; Denton, M.B. The Impact of Array Detectors on Raman Spectroscopy. J. Chem. Educ. 2007, 84, 67–74.
- Sharma, S.K.; Egan, M.J. Raman Spectroscopy, Remote Compositional Analysis; Cambridge University Press: Cambridge, UK, 2019; pp. 120–146.
- Okhotnikov, O.G. Semiconductor Disk Lasers: Physics and Technology; WILEY-VCH: Weinheim, Germany, 2010.
- Pallmann, W.P.; Zaugg, C.A.; Mangold, M.; Wittwer, V.J.; Moench, H.; Gronenborn, S.; Miller, M.; Tilma, B.W.; Südmeyer, T.; Keller, U. Gain characterization and passive modelocking of electrically pumped VECSELs. Opt. Express 2012, 20, 24791.
- Yan, Y.; Zheng, Y.; Sun, H.; Duan, J. Review of Issues and Solutions in High-Power Semiconductor Laser Packaging Technology. Front. Phys. 2021, 9, 669591.
- Smits, R.W.H.; Koljenović, S.; Hardillo, J.A.; Hove, I.T.; Meeuwis, C.A.; Sewnaik, A.; Dronkers, E.A.; Schut, T.C.B.; Langeveld, T.P.M.; Molenaar, J.; et al. Resection margins in oral cancer surgery: Room for improvement. Head Neck 2016, 38 (Suppl. S1), E2197–E2203.
- Binahmed, A.; Nason, R.W.; Abdoh, A.A. The clinical significance of the positive surgical margin in oral cancer. Oral Oncol. 2007, 43, 780–784.
- Neuzillet, Y.; Soulie, M.; Larre, S.; Roupret, M.; Defortescu, G.; Murez, T.; Pignot, G.; Descazeaud, A.; Patard, J.J.; Bigot, P.; et al. Positive surgical margins and their locations in specimens are adverse prognosis features after radical cystectomy in non-metastatic carcinoma invading bladder muscle: Results from a nationwide case-control study. BJU Int. 2013, 111, 1253–1260.
- Wong, J.M.; Panchmatia, J.R.; Ziewacz, J.E.; Bader, A.M.; Dunn, I.F.; Laws, E.R.; Gawande, A.A. Patterns in neurosurgical adverse events: Intracranial neoplasm surgery. Neurosurg. Focus 2012, 33, E16.
- Auner, G.W.; Koya, S.K.; Huang, C.; Broadbent, B.; Trexler, M.; Auner, Z.; Elias, A.; Curtin Mehne, K.; Brusatori, M.A. Applications of Raman spectroscopy in cancer diagnosis. Cancer Metastasis Rev. 2018, 37, 691–717.
- Haka, A.S.; Volynskaya, Z.; Gardecki, J.A.; Nazemi, J.; Shenk, R.; Wang, N.; Dasari, R.R.; Fitzmaurice, M.; Feld, M.S. Diagnosing breast cancer using Raman spectroscopy: Prospective analysis. J. Biomed. Opt. 2009, 14, 54023.
- World Health Organization. Available online: http://globocan.iarc.fr (accessed on 22 March 2017).
- Jermyn, M.; Mok, K.; Mercier, J.; Desroches, J.; Pichette, J.; Saint-Arnaud, K.; Bernstein, L.; Guiot, M.C.; Petrecca, K.; Leblond, F. Intraoperative brain cancer detection with Raman spectroscopy in humans. Sci. Transl. Med. 2015, 7, 274ra19.
- Kong, K.; Rowlands, C.J.; Varma, S.; Perkins, W.; Leach, I.H.; Koloydenko, A.A.; Williams, H.C.; Notingher, I. Diagnosis of tumors during tissue-conserving surgery with integrated autofluorescence and Raman scattering microscopy. Proc. Natl. Acad. Sci. USA 2013, 110, 15189–15194.
More