Your browser does not fully support modern features. Please upgrade for a smoother experience.
Please note this is a comparison between Version 1 by Hussein Awada and Version 2 by Lindsay Dong.
Myelodysplastic syndromes (MDS) are characterized by variable clinical manifestations and outcomes. Machine learning (ML) algorithms can be helpful in developing more precise prognostication models that integrate complex genomic interactions at a higher dimensional level. These techniques can potentially generate automated diagnostic and prognostic models and assist in advancing personalized therapies.
- Myelodysplastic syndromes
- Machine Learning
1. Introduction
Myelodysplastic syndromes (MDS) constitute a heterogeneous group of clonal disorders arising from the defective cellular differentiation of hematopoietic progenitors and the expansion of malignant hematopoietic stem cells (HSCs). The hallmarks of MDS are the presence of bone marrow (BM) dysplasia, peripheral cytopenias, and the risk of transformation to acute myeloid leukemia (AML). The application of next-generation sequencing elucidated the molecular landscape of MDS by unraveling the sequential acquisition of recurrent somatic mutations in driver and subclonal genes such as DNMT3A, TET2, IDH1/2, ASXL1, TP53, RUNX1, SF3B1, U2AF1, SRSF2, and ZRSR2 [1][2][3][4][5][6][7][1,2,3,4,5,6,7]. Rarely, individuals can have a genetic predisposition to develop MDS as a result of germline mutations affecting ANKRD26, CEBPA, RUNX1, DDX41, telomere machinery genes (TERC and TERT), SRP72, and GATA2, among others, segregating within families [8][9][8,9]. Such a complex mutational profile further reinforces the genomic heterogeneity of MDS subtypes along with their diverse clinical presentations and disease outcomes.
Machine learning (ML) is a subfield of artificial intelligence (AI) that allows the recognition of patterns in high-dimensional space. In order to make practical use of trained models, datasets are divided into training and test cohorts to assess the generalizability of the models to unseen data and hence applicability in real-world scenarios. Common lists of ML algorithms span from linear and logistic regression, decision tree and random forest, to the gradient boosting algorithms, which improve robustness of prediction. Deep learning (DL) is a subset of ML in which artificial neural networks (ANNs) are used in learning increasingly complex functions [45]. DL often involves a subtype of ANNs called convolutional neural networks (CNNs) that are capable of identifying visual features that can help in predicting outcomes [45]. Nevertheless, they are prone to overfitting if not carefully constructed or regularized appropriately for the given model and dataset.
The revolution of ML methods is reflected by their growing use in MDS research and by the continuous interest in their implementation in clinical practice. However, the complexity of ML tools and the black-box nature of the methods still hamper its incorporation in prognostic scoring systems, so extensive validation is required.
2. Machine Learning Tools in Myelodysplastic Syndrome
2.1. Diagnostics
Several studies have applied ML methodologies in MDS to enhance diagnostic and prognostic precision in specific settings. Acevedo et al. and Kimura et al. applied CNNs with gradient boosting (XGBoost, v1.5.2) techniques to develop automated diagnostic systems for morphology assessment [10][11][12][46,47,48]. The usage of XGBoost improves the accuracy of models by sequentially combining the errors and outputs of individual trees to improve predictions. They used 136 and 3261 peripheral blood smears to create 5810 and 695,030 images, respectively, to train their CNNs [11][12][47,48]. Training these models through several cycles refined their ability to identify hypogranulated dysplastic neutrophils among 97 morphological features and 17 cells types in peripheral blood smears [11][12][47,48]. The achieved efficacy of these methods is evident in their success in discriminating MDS from other differential diagnoses with very high sensitivities (≥94%) and specificities (≥94.3%) [11][12][47,48]. Improving the diagnostic role of peripheral blood smears in MDS has been a long-standing goal. The reported accuracies of the models of Acevedo et al., Kimura et al., and Radakovich et al. represent substantial improvements [13][14][15][16][17][50,51,52,53,54]. While manual microscopy remains the gold-standard in the diagnosis of MDS, these models overcome some of its limitations including interobserver variability, required experts, and time. Furthermore, ML-based methods are able to provide an elaborate differentiation of a broad range of blood cell types and morphological aberrancies, some of which may be challenging and extremely time-consuming to detect through visual inspection by pathologists. Thus, these noninvasive and easy-to-use models have the potential to be applied in the initial evaluation of peripheral blood smears excluding or prompting further BM evaluation in suspected MDS patients.Although BM evaluation is a conditio sine qua non for the definitive diagnosis of MDS, few studies previously employed ML for the detection and morphological characterization of dysplastic cells in BM smears [18][19][20][21][22][55,56,57,58,59]. The identification of BM dysplasia for establishing an MDS diagnosis may be challenging because of the presence of many types of progenitor cells at different stages of maturation and the absence of specific pathognomonic features. Therefore, automatic machine-assisted approaches are required especially for mild cytopenias and sparse dysplastic changes that may be undetected by pathologists [23][24][25][60,61,62].
With that being said, Mori et al. established AKIRA as the first CNN-based AI system capable of detecting BM dysplasia by assessing neutrophil granularity [21][58]. The downside of this model is its inability to differentiate immature granulocytes from dysplastic hypogranular cells with concomitant nuclear hyposegmentation [21][58]. Interestingly, AKIRA promoted a “doctor in the loop” model by further improving the system via reduction in human error when labeling the images [26][63]. Correction of mistakes and subsequent retraining of AKIRA with 1797 images from 35 BM smears further fine-tuned its accuracy to 97.2% [21][58]. Thus, AI can assist human judgement through a feedback process by which the cooperation between the two entities maximizes statistical outcomes.
Alternatively, ML-based imaging flow cytometry (IFC) can be used to detect BM dyserythropoiesis by identifying and quantifying morphometric aberrancies in erythroid precursors [22][59]. One of the features of dyserythropoiesis in MDS is the presence of enlarged cells with normal cytoplasmic/nuclear maturation profile, also known as macronormoblasts [24][61]. IFC detects macronormoblastic changes while enhancing the recognition of binucleated events through its ability to process thousands of cells along with ML’s decision-making accuracy [22][59]. Rosenberg et al. demonstrated this by quantifying morphometric changes in a median of 5953 erythroblasts (range 489–68,503) from 14 MDS patients, 11 healthy controls, 6 non-MDS patients with increased erythropoiesis (e.g., megaloblastic anemia due to vitamin B12 deficiency), and 6 patients with other-causes cytopenia [22][59]. However, these dysplastic changes are unspecific and not present in MDS cases with dysplasia of other lineages (dysgranulo- or dysmegakaryocytopoiesis); as such, erythropoiesis should not be assessed in isolation when MDS is suspected [24][61].
2.2. Risk Assessments and Prognostics
3.2. Risk Assessments and Prognostics
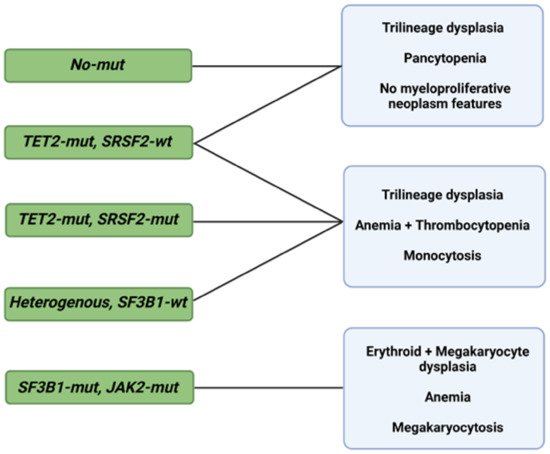
As in the case of diagnosis, morphological changes also provide prognostic insight, specifically when coupled with information deriving from the IPSS-R [27][65]. Some of these changes are shaped by somatic mutations, but specific associations between the two, in addition to SF3B1 and ring sideroblasts, remain unclear [28][29][30][66,67,68]. Bayesian ML techniques (probabilistic frameworks allowing for prior knowledge to be incorporated into the model) interrogating interdependencies identified 5 morphological profiles and 14 genetic signatures in a big cohort of 1079 MDS patients [31][69]. Independent analysis of the two sets unmasked six morphologic profile/genetic signature associations of prognostic implications (Figure 12) [31][69].


Figure 12. Morphological profiles and associated genetic signatures. Representation of prognostically significant groups according to mutations, morphologic phenotypes, and their combination. Abbreviations: mut, mutation; wt, wild type; TET2, ten-eleven translocation 2; SRSF2, serine and arginine rich splicing factor 2; SF3B1, splicing factor 3b, subunit 1; JAK2, Janus kinase 2. Modified from Nagata et al. [31][69]. BioRender was used to make the figure.
Despite the incremental benefit of using AI- and ML-based techniques for a better definition of the diagnosis and the prognosis of MDS, the genetic components of the described associations are currently not part of the conventional prognostic systems. Bersanelli et al. analyzed the clinical and genomic features of 2043 patients with MDS for classification and assessment of personalized prognostic outcomes. Overall, eight genomic-based MDS groups were identified, and each group possessed a significantly different probability of survival [32][70]. The inclusion of genetic mutations, mutational patterns, and demographic features allowed researchers to overcome the IPSS-R limitations, as evidenced by the improved prognostication power (C-index 0.74) [32][70]. The prognostic value of these features is further demonstrated by the dynamic ML-based genoclinical model described by Nazha et al. [33][71]. The proposed multicenter-validated model has a C-index of 0.74 and 0.81 for OS and leukemic transformation, respectively, overpowering the IPSS, IPSS-R, and even the models previously described by the same group [34][33][29,71].
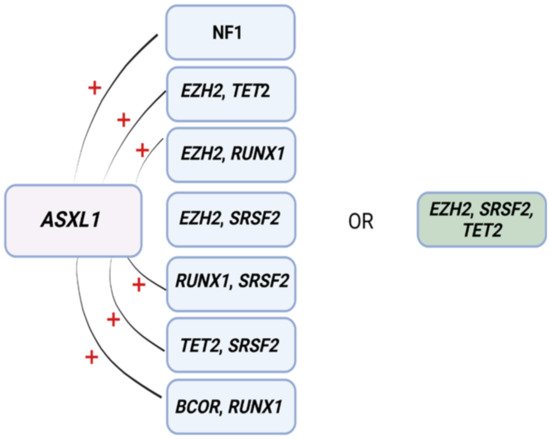
ML has also proven to be useful for predicting resistance to HMA [35][72]. In another study, eight patterns associated with HMA resistance were identified in 1/3 of MDS patients by means of an a priori market basket algorithm [35][72]. This type of algorithm is helpful in unmasking existing associations of events that occur together frequently (i.e., items falling into the same basket). The model was able to predict poor response to HMA therapy according to the occurrence of any of the identified patterns of mutations (Figure 23) [35][72]. Patients carrying any of these associations had worse median survival (14.6 months) compared to those with ≥3 mutations not including such lesions (22.8 months) [35][72]. Although these associations exist in 1/3 of MDS patients, recognizing their presence as a part of routine MDS workup may prevent prolonged exposure to ineffective therapy, unnecessary toxicities, and avoidable treatment costs.


Figure 23. Mutational patterns conferring resistance to hypomethylating agents. Associations among genes identified to induce resistance to hypomethylating drugs. Abbreviations: ASXL1, ASXL transcriptional regulator; NF1, neurofibromin 1, EZH2, enhancer of Zeste 2 polycomb repressive complex 2 subunit; TET2, ten-eleven translocation 2; RUNX1, RUNX family transcription factor 1; SRSF2, serine and arginine rich splicing factor 2; BCOR, BCL6 corepressor. Modified from Nazha et al. [35][72]. BioRender was used to make the figure.
