Your browser does not fully support modern features. Please upgrade for a smoother experience.
Please note this is a comparison between Version 2 by Catherine Yang and Version 1 by Michael T. Chin.
Hypertrophic Cardiomyopathy (HCM) is a common inherited disorder characterized by unexplained left ventricular hypertrophy with or without left ventricular outflow tract (LVOT) obstruction. Single-nuclei RNA-sequencing (snRNA-seq) of both obstructive and nonobstructive HCM patient samples has revealed alterations in communication between various cell types, but no direct and integrated comparison between the two HCM phenotypes has been reported.
- Hypertrophic Cardiomyopathy
- hypertrophic cardiomyopathy
1. Introduction
Hypertrophic Cardiomyopathy (HCM) is a common inherited disorder affecting approximately 1 out of 500 live births that is characterized by unexplained left ventricular hypertrophy. In most cases, the hypertrophy is asymmetric, involving the interventricular septum (IVS), and can lead to left ventricular outflow (LVOT) obstruction, an important cause of heart failure symptoms. Patients with LVOT obstruction often do well with septal reduction therapy, which is achieved by surgical myectomy in most cases or by alcohol septal ablation for high-risk surgical candidates [1]. A significant percentage (30%) of patients do not develop LVOT obstruction but can develop intractable heart failure, despite guideline directed medical management, and often proceed to heart transplantation. The factors that influence the development of an obstructive phenotype vs. a nonobstructive phenotype are unknown.
HCM has traditionally been considered a disease of the sarcomere, based on numerous familial cohorts with mutations in sarcomere genes [2]. Broader analysis of the general HCM population has led to the consensus that up to 70% of HCM patients do not have demonstrable sarcomere gene mutations, leading some to call for new paradigms to understand the origins of HCM [3]. The decision to pursue routine genetic screening must thus be individualized [4], and the consideration of mechanisms beyond the sarcomere has been discussed [5]. The comparison of patients with sarcomere mutations to those who do not has indicated a higher incidence of adverse events in those with known sarcomere mutations [6]. More recently, large-scale genetic analyses have identified polygenic contributors to HCM that can act as modifiers of existing sarcomere mutations and also affect modifiable traits such as diastolic blood pressure [7,8,9][7][8][9]. Further genotype-phenotype correlations have been elusive, however, and, to the best of our knowledge, no genetic features distinguish obstructive HCM and nonobstructive HCM.
2. Ligand–Receptor Pair Gene Expression Analysis Reveals Alterations in Ligand and Receptor Gene Expression That Varies by Cell Type in Nonobstructive and Obstructive HCM
L–R components were considered expressed if expression was detectable in more than 20% of the cells within a cell type, as has been done in prior studies [13,14,22,25][10][11][12][13]. Among the different conditions, normal cells demonstrated the greatest number of potential L–R interactions among the 8 cell types (n = 817), compared to nonobstructive HCM cells (n = 502) and obstructive HCM cells (n = 359) (Figure 41A). Among cell types, fibroblasts broadcasted the most ligands among all cell types in all conditions (Figure 41B). In obstructive HCM when compared to nonobstructive HCM, a reduction in ligand expression was particularly notable in cardiomyocytes, fibroblasts, pericytes, and neurons (Figure 41B). In nonobstructive HCM, endothelial cells showed a disproportionate decrease in ligand expression compared to obstructive HCM, while reductions in dendritic cell, leukocyte, and smooth muscle cell ligands were comparable in both types of HCM (Figure 41B). Receptor expression was disproportionally reduced in most cell types in obstructive HCM compared to nonobstructive HCM, including cardiomyocytes, fibroblasts, dendritic cells, leukocytes, smooth muscle cells, and neurons, but comparable in endothelial cells and pericytes (Figure 41B).
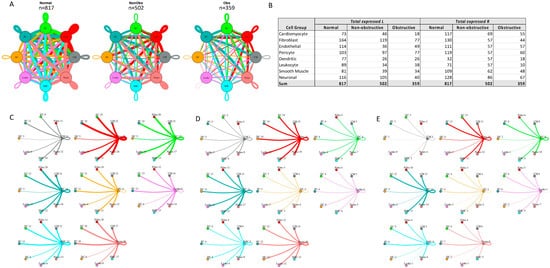
Figure 41. Intercellular communication networks in normal, nonobstructive, and obstructive HCM. (A) Cell–cell communication networks between cardiac cell types in normal control (left), nonobstructive (middle), and obstructive HCM (right) conditions. Line color indicates ligand broadcasting by the cell population with the same color. Lines connect to cell types which expressed cognate receptors. Line thickness is proportional to the number of uniquely expressed ligand–receptor pairs. Loops indicate communication within a cell type. (B) Quantity of ligands and receptors in expressed ligand–receptor pairs described by cell type and condition (normal control, nonobstructive HCM, or obstructive HCM). (C–E) Cell–cell communication networks broken down by cell type in normal control (C), nonobstructive HCM (D), and obstructive HCM (E) conditions. Figure formatting in C-E follows panel A and numbers indicate the quantity of uniquely expressed ligand–receptor pairs between the broadcasting cell type (expressing ligand) and receiving cell type (expressing receptor).
The greatest potential relative reductions in intercellular communication in obstructive HCM compared to nonobstructive HCM involved pathways between neurons and fibroblasts (12 total L–R pairs vs. 4 total L–R pairs, fibroblasts and leukocytes (14 L–R pairs vs. 3 L–R pairs), fibroblasts and dendritic cells (14 L–R pairs vs. 4 L–R pairs), and neurons and dendritic cells (12 L–R pairs vs. 2 L–R pairs; Figure 41C–E). The reduction in neuron to fibroblast communication was due to the loss of neuronal expression of several cognate ligands for the ITGB1 receptor (COL1A2, COL4A1, COL6A1, FN1, LAMA2, TGM2) and loss of RYR2 expression in fibroblasts. The reduction in fibroblast to leukocyte communication is attributable to the loss of ITGB1 receptor in leukocytes, which disabled communications with several cognate ligands (COL1A2, COL3A1, COL4A1, COL6A1, COL6A2, COL6A3, FN1, LAMA2, LGALS1, LUM). The reduction in fibroblast to dendritic cell communication is again attributable to the loss of ITGB1 receptor expression in dendritic cells, which disrupted communication with the same set of cognate ligands described for fibroblast to leukocyte communication. The reduction in neuron to dendritic cell communication was due primarily to the loss of ITGB1 receptor expression in dendritic cells but, as noted, there was also a decrease in the ITGB1 ligand expression in neurons. It is important to view these changes in a more global comparison with intercellular communication in normal tissues, where reductions in neuron to fibroblast communication are seen in both types of HCM but more severe in obstructive HCM, while a reduction in fibroblast to leukocyte communication is only observed in obstructive HCM compared to normal tissue. The relative reduction in fibroblast and neuron to dendritic cell communication in obstructive HCM is a consequence of the increased communication between these cell types in nonobstructive HCM rather than a large change compared to normal tissue (Figure 41C–E), consistent with the enhanced role of dendritic cells in the pathogenesis of nonobstructive HCM. Dendritic cells play an important role in antigen presentation and immune system activation and have been implicated in the pathogenesis of heart failure [26,27][14][15]. Integrin-b1 is known to affect dendritic cell anti-inflammatory function [28,29][16][17].
The greatest potential relative increases in intercellular communication in obstructive HCM compared to nonobstructive HCM involved pathways between endothelial cells and endothelial cells (4 L–R pairs vs. 8 L–R pairs), endothelial cells and fibroblasts (4 L–R pairs vs. 8 L–R pairs), endothelial cells and cardiomyocytes (5 L–R pairs vs. 8 L–R pairs), and endothelial cells and neurons (7 L–R pairs vs. 10 L–R pairs; Figure 41C–E, Supplementary Figure S2). In all cases, the increase in communication pathways is due to the endothelial cells in obstructive HCM expressing additional ligands for ITGB1 (COL6A2, HSPG2, LUM). Relative to normal cells, endothelial cell communication is reduced in both types of HCM but less so in obstructive compared to nonobstructive HCM (Figure 41C–E). The induction of ECM gene expression in mature endothelial cells has been reported to be induced by hypoxic conditions [30][18], and thus the increase seen in nonobstructive vs. obstructive HCM may reflect relative tissue hypoxia in nonobstructive HCM.
3. Gene Ontology Enrichment Analysis of Alterations in Ligand–Receptor Pair Gene Expression Reveal Common and Distinct Alterations in Molecular Function in Nonobstructive and Obstructive HCM That Vary by Cell Type
To determine the molecular functions potentially affected by alterations in L–R pair gene expression in both nonobstructive and obstructive HCM across all cell types, we performed GO enrichment analysis as previously described [13,14][10][11]. In general, there were numerous decreases in ligands associated with many molecular functions in both types of HCM relative to normal tissue, with some variation in their degree (Figure 52A), as well as increases in various ligands associated with specific molecular functions that were unique to nonobstructive HCM. Reductions in endopeptidase inhibitor activity, endopeptidase regulator activity, enzyme inhibitor activity, extracellular matrix structural constituent, extracellular matrix structural constituent conferring tensile strength, growth factor binding, integrin binding, peptidase inhibitor activity, peptidase regulator activity, platelet-derived growth factor binding, protease binding, and SMAD binding, for example, appear to be processes affected in both types of HCM. In contrast, increases in adenylate cyclase binding, calcium channel inhibitor activity, calcium channel regulator activity, channel inhibitor activity, disordered domain specific binding, protein kinase activity, protein N-terminus binding, protein phosphatase activator activity, and titin binding are uniquely implicated in nonobstructive HCM. The analysis of cell-type-specific changes in molecular function indicate that these changes are most notable in cardiomyocytes (Figure 52B), dendritic cells (Figure 52F), leukocytes (Figure 52G), and smooth muscle cells (Figure 52H).
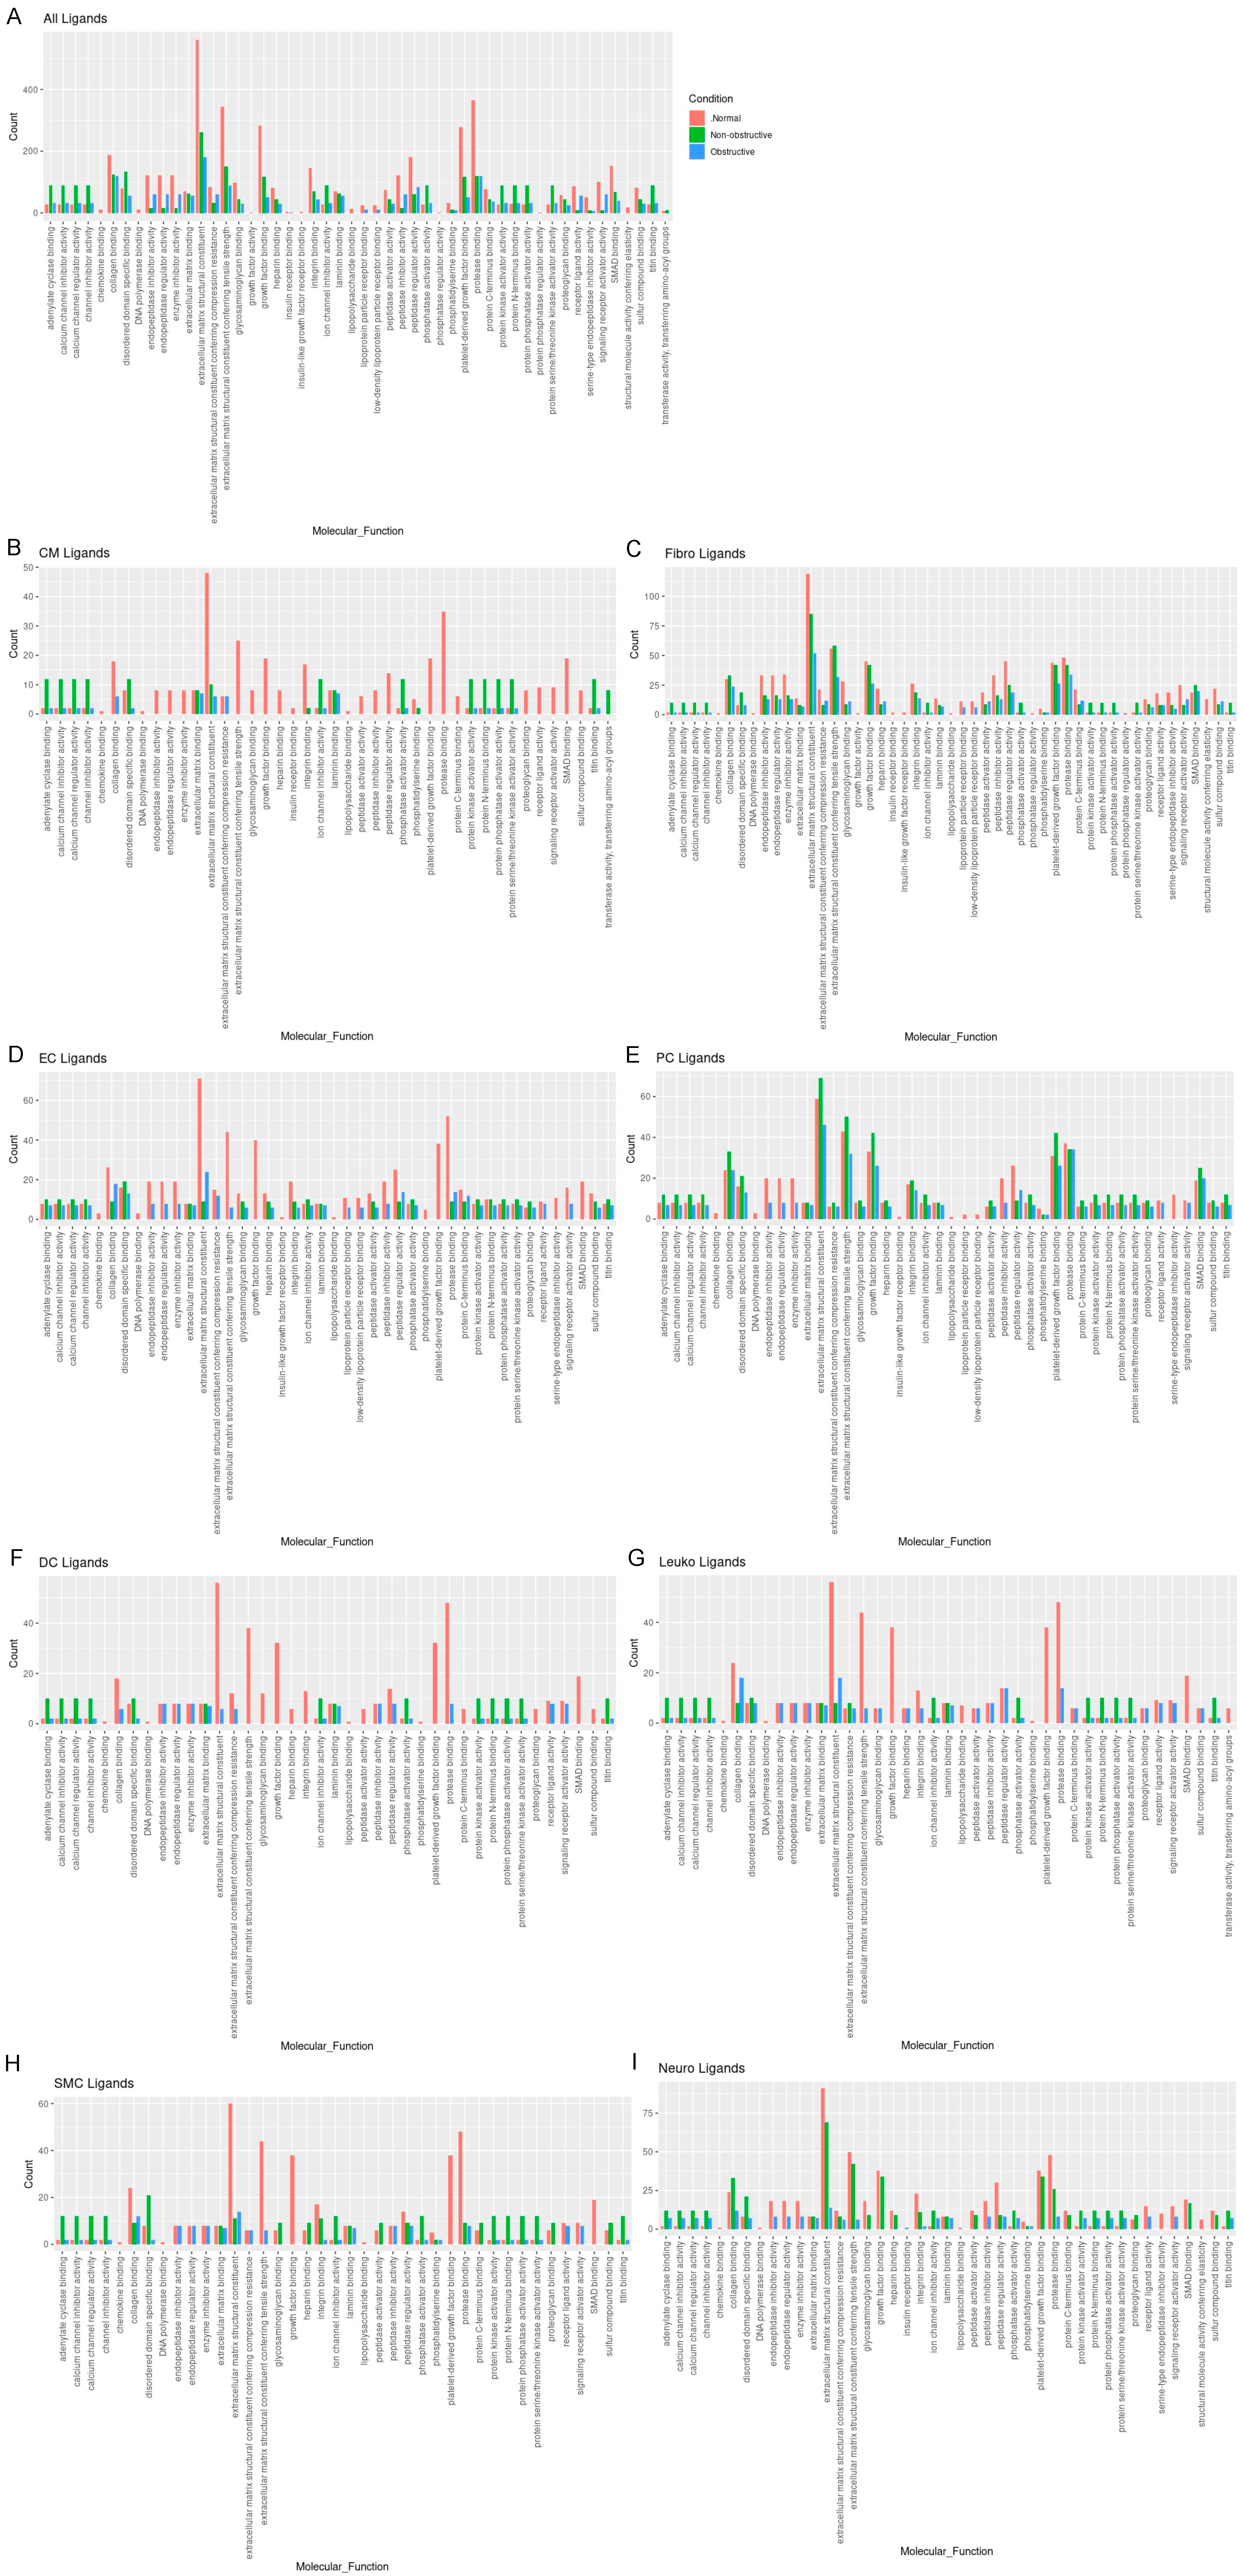
Figure 52. Bar plot representing the total count of ligands (in expressed ligand–receptor pairs) associated with different cellular processes in normal, nonobstructive HCM, and obstructive HCM IVS Cells. Bar color distinguishes ligand count in normal, nonobstructive HCM, or obstructive HCM conditions. (A) Comparison of molecular functions across all cell types. (B) Comparison in cardiomyocytes. (C) Fibroblasts. (D) Endothelial cells. (E) Pericytes. (F) Dendritic cells. (G) Leukocytes. (H) Smooth muscle cells. (I) Neurons.
Reductions in amyloid beta binding, cargo receptor activity, growth factor binding, lipoprotein particle receptor activity, low-density lipoprotein particle receptor activity, peptide binding, scavenger receptor activity, transmembrane receptor protein kinase activity, and transmembrane receptor protein tyrosine kinase activity are common to both nonobstructive and obstructive HCM (
Figure 6A). Increases in amide binding, calcium channel activity, calcium ion transmembrane transporter activity, calcium release channel activity, calmodulin binding, cation channel activity, channel activity, divalent inorganic cation transmembrane transporter activity, gated channel activity, intracellular ligand-gated ion channel activity, ion channel activity, ion channel binding, ligand-gated calcium channel activity, ligand-gated cation channel activity, ligand-gated channel activity, ligand-gated ion channel activity, metal ion transmembrane transporter activity, passive transmembrane transporter activity, protein kinase A catalytic subunit binding, protein kinase A regulatory subunit binding, and sulfur compound binding are uniquely associated with nonobstructive HCM.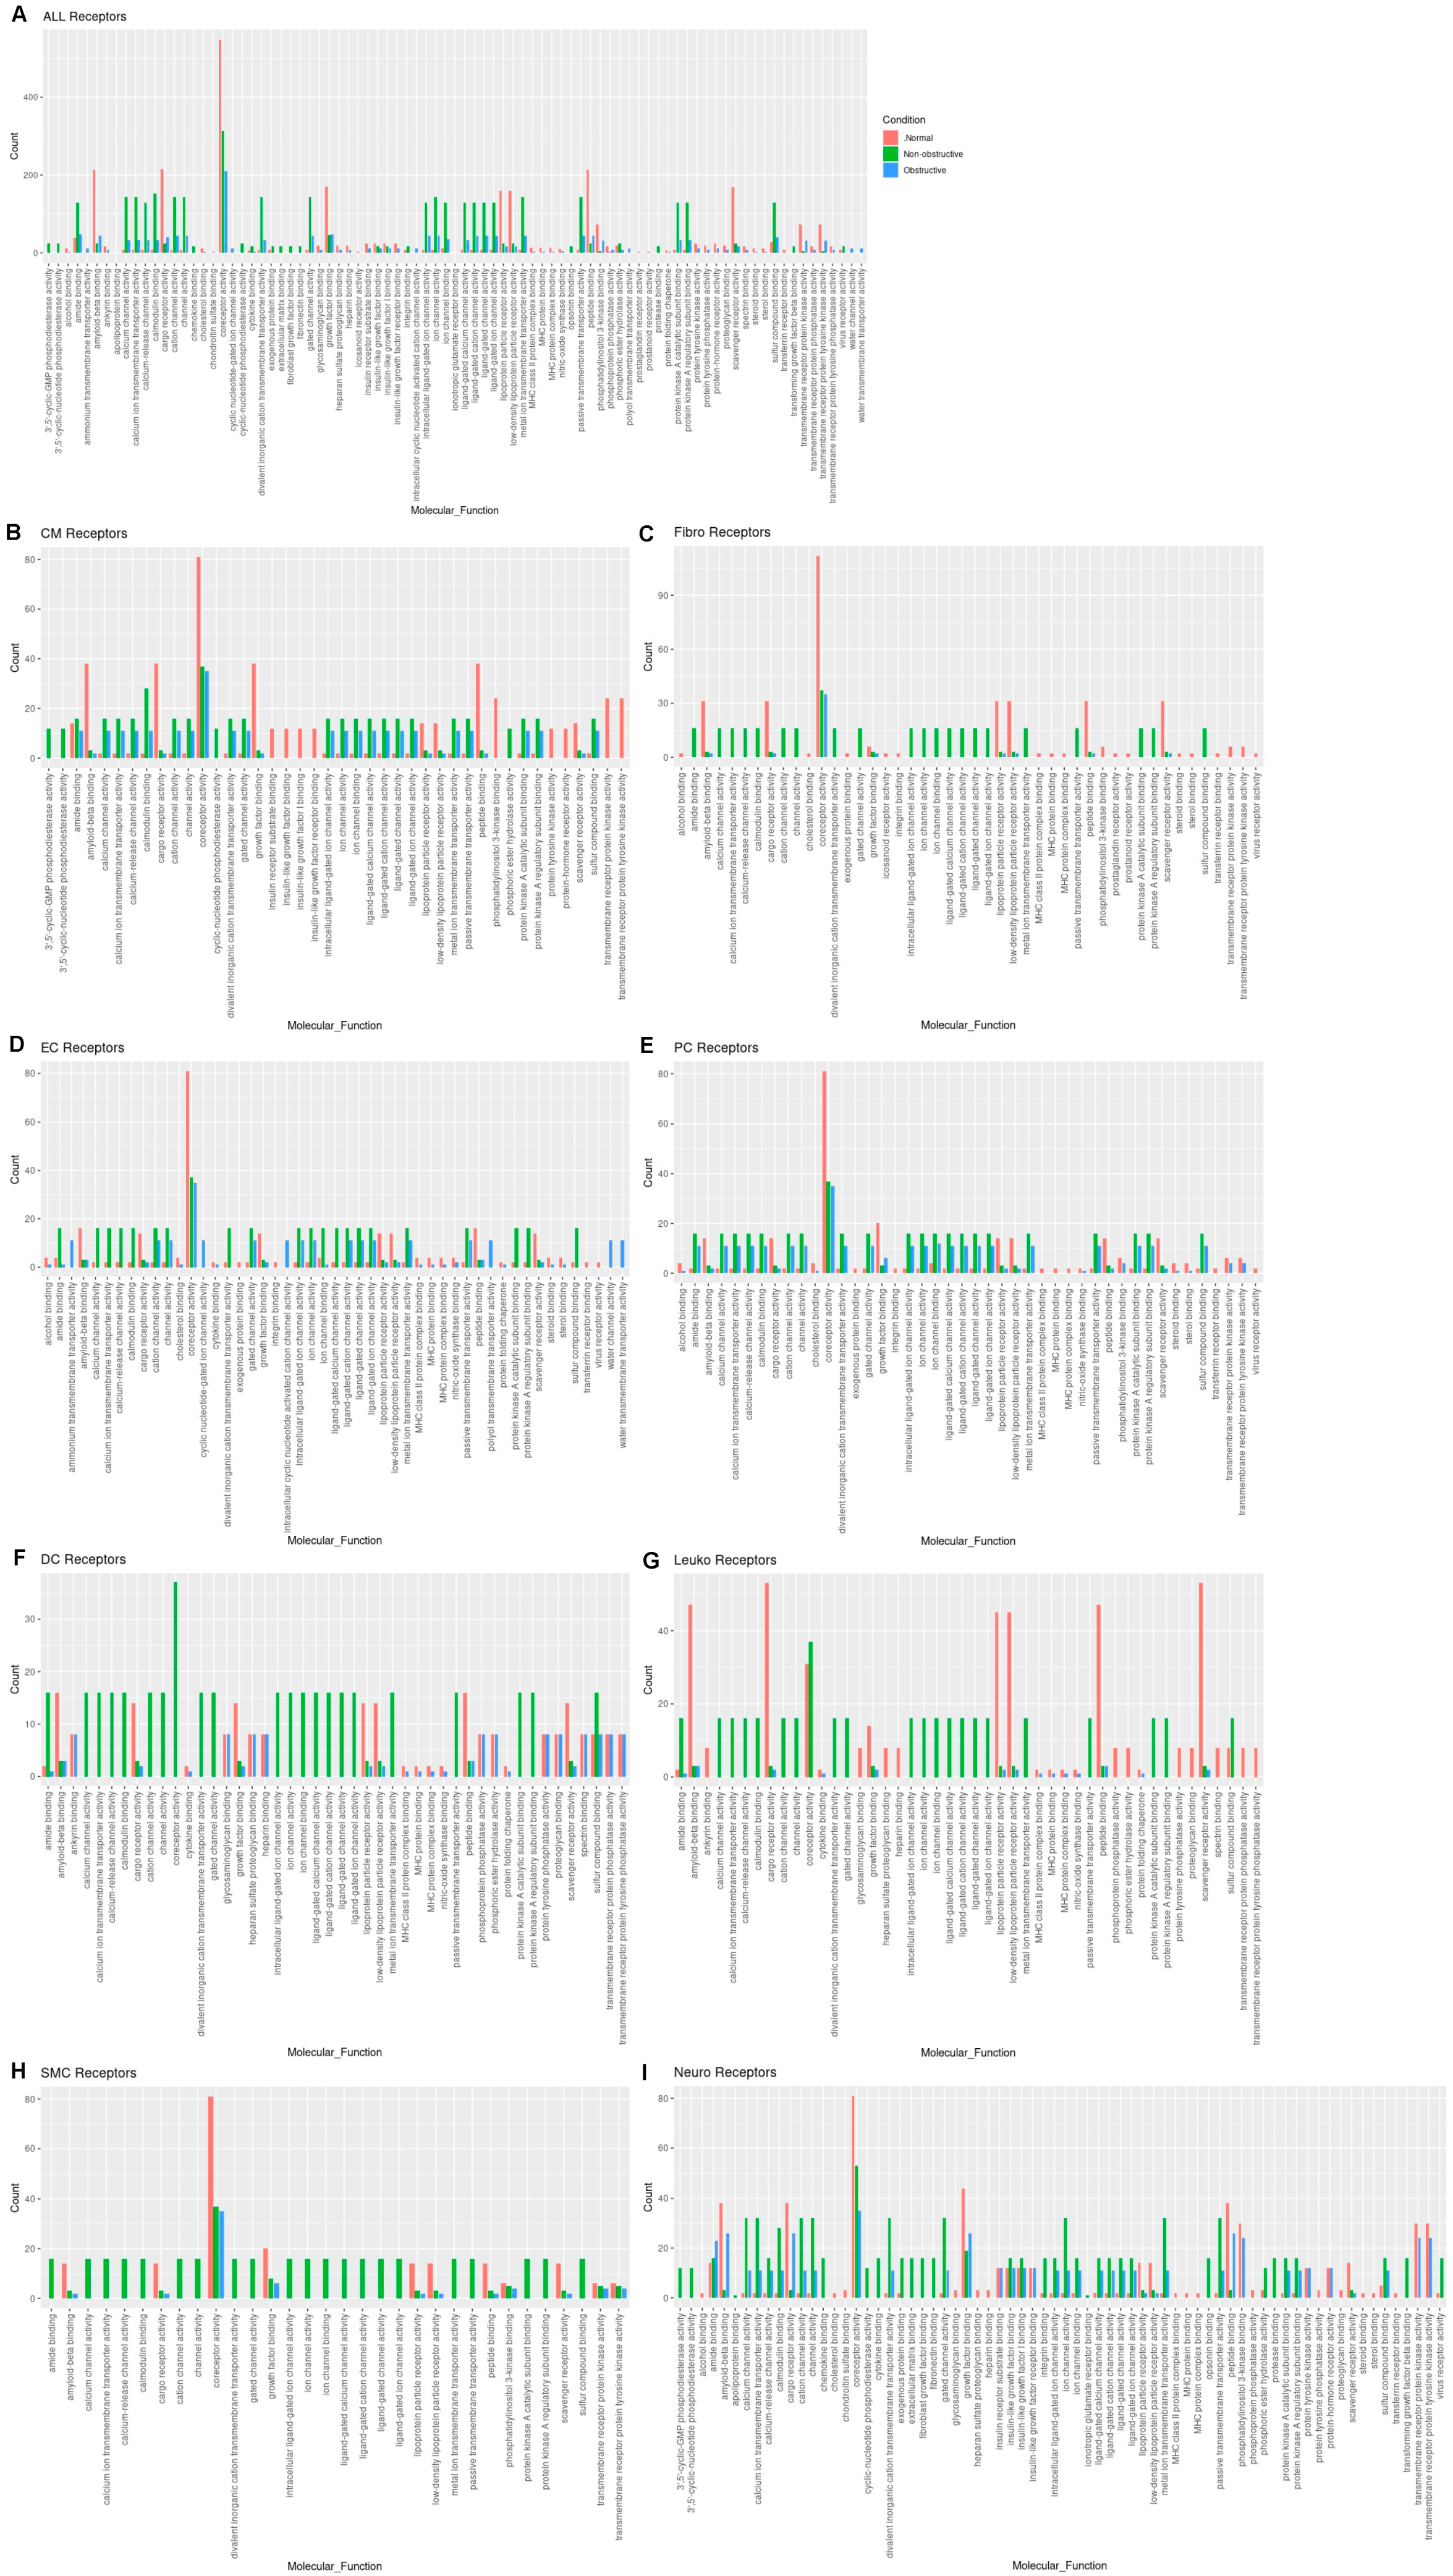
3A). Increases in amide binding, calcium channel activity, calcium ion transmembrane transporter activity, calcium release channel activity, calmodulin binding, cation channel activity, channel activity, divalent inorganic cation transmembrane transporter activity, gated channel activity, intracellular ligand-gated ion channel activity, ion channel activity, ion channel binding, ligand-gated calcium channel activity, ligand-gated cation channel activity, ligand-gated channel activity, ligand-gated ion channel activity, metal ion transmembrane transporter activity, passive transmembrane transporter activity, protein kinase A catalytic subunit binding, protein kinase A regulatory subunit binding, and sulfur compound binding are uniquely associated with nonobstructive HCM.
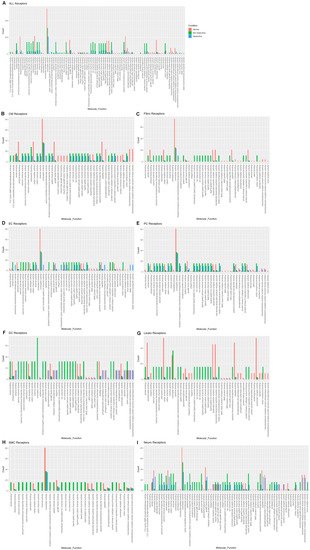
Figure 63. Bar plot representing the total count of receptors (in expressed ligand–receptor pairs) associated with different cellular processes in normal, nonobstructive HCM, and obstructive HCM IVS cells. Bar color distinguishes receptor count in normal or nonobstructive HCM conditions. (A) Comparison of molecular functions across all cell types. (B) Comparison in cardiomyocytes. (C) Fibroblasts. (D) Endothelial cells. (E) Pericytes. (F) Dendritic cells. (G) Leukocytes. (H) Smooth muscle cells. (I) Neurons.
The analysis of receptor gene expression changes by specific cell type reveals both common and cell-type-specific changes in associated molecular functions (Figure 63B–I). Cardiomyocytes demonstrated the decreases in molecular functions associated with the aggregates of all cell types for each condition, as well as additional decreases in insulin receptor substrate binding, insulin-like growth factor binding, insulin-like growth factor I binding, insulin-like growth factor receptor binding, protein tyrosine kinase activity, protein-hormone receptor activity, transmembrane receptor kinase activity, and transmembrane receptor protein tyrosine kinase activity in both nonobstructive and obstructive HCM. Cardiomyocytes also showed increases in calcium channel activity, calcium ion transporter activity, calcium-release channel activity, calmodulin binding, cation channel activity, channel activity, divalent inorganic cation transmembrane transporter activity, gated channel activity, intracellular ligand-gated ion channel activity, ion channel activity, ion channel binding, ligand-gated calcium channel activity, ligand-gated cation channel activity, ligand-gated channel activity, ligand-gated ion channel activity, metal ion transmembrane transporter activity, passive transmembrane transporter activity, protein kinase A catalytic subunit binding, protein kinase A regulatory subunit binding, and sulfur compound binding as noted in the aggregate, but these changes occurred in cardiomyocytes from both nonobstructive and obstructive HCM (Figure 63B), which differ in that the aggregate nuclei population only showed these changes in nonobstructive HCM (Figure 63A). Cardiomyocytes in nonobstructive HCM showed unique increases in 3′,5-cyclic-GMP phosphodiesterase activity, 3′,5′-cyclic nucleotide phosphodiesterase activity, cyclic nucleotide phosphodiesterase activity, and phosphoric ester hydrolase activity. Fibroblasts (Figure 63C), dendritic cells (Figure 63F), leukocytes (Figure 63G), and smooth muscle cells (Figure 63H) demonstrate receptor gene expression patterns similar to those shown for the general aggregate population of nuclei. Endothelial cell receptor gene expression profiles generally paralleled the general population, except that for the various ion and calcium channel activities the increases occurred in both nonobstructive HCM and obstructive HCM, as was seen in cardiomyocytes, and for ammonium transmembrane transporter activity, cyclic nucleotide-gated ion channel activity, intracellular cyclic nucleotide activated cation channel activity, polyol transmembrane transporter activity, water channel activity, and water transmembrane transporter activity, which were uniquely increased in obstructive HCM (Figure 63D). Pericytes showed receptor gene expression patterns similar to those of the general population, except that the differences between nonobstructive and obstructive HCM were less pronounced (Figure 63E). Neurons also showed receptor gene expression patterns similar to those of the general population but shared some features with cardiomyocytes (increased 3′,5′ cyclic GMP and nucleotide phosphodiesterase and less pronounced differences between nonobstructive and obstructive HCM for other molecular functions (Figure 63I)). Overall, these findings indicate that there are changes in ligand and receptor gene expression that are cell-specific and either common or unique to each type of HCM that may provide unique, personalized, and cell-specific therapeutic targets for future therapy.
4. Fibroblast and Cardiomyocyte Subtypes Communicate Differently in Nonobstructive and Obstructive HCM
In prior studies, fibroblast subtypes in both obstructive and nonobstructive HCM developed distinctive interaction profiles with other cells [13,14][10][11]. To compare the fibroblast interactome in both nonobstructive and obstructive HCM, we analyzed the L–R pair gene expression for all fibroblast subtypes (composed of five clusters) in conjunction with all other cell types (Figure 74). As expected, the fibroblast subtype intercellular communication networks for normal (2157), nonobstructive HCM (1291), and obstructive HCM (838) were qualitatively similar to the general cell interaction network in that fibroblast subtypes from nonobstructive HCM demonstrated reduced interactions compared to normal tissue and interactions were reduced to a greater extent in obstructive HCM tissue (Figure 74A). The greatest reduction in L–R pairs was found in ligands broadcasted from fibroblast clusters 2 and 3 to receptors on fibroblast clusters 1, 4, and 5 and leukocytes in obstructive HCM compared to nonobstructive HCM (Figure 74C,D). This reduction was due to the loss of ITGB1 receptor expression in the recipient clusters in obstructive HCM. There are no cases of increased L–R interaction in obstructive HCM compared to nonobstructive HCM.
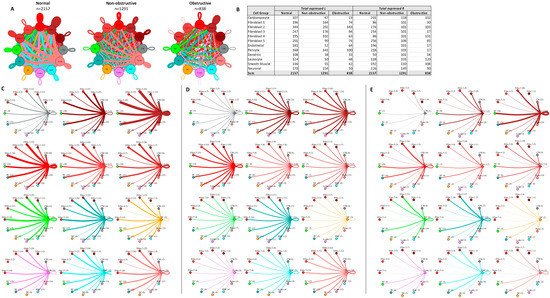
Figure 74. Cell–cell communication networks between fibroblast subtypes and other heart cell types in normal control, nonobstructive HCM, and obstructive HCM conditions. (A) Comparison of normal (left), nonobstructive (middle), and obstructive HCM (right) communication networks. Line color indicates ligand broadcast by the cell population with the same color. Lines connect to cell types that expressed cognate receptors. Line thickness is proportional to the number of uniquely expressed ligand–receptor pairs. Loops indicate communication within a cell type. (B) Quantity of ligands and receptors in expressed ligand–receptor pairs described by cell type and condition (normal, nonobstructive HCM, or obstructive HCM). (C–E) Cell–cell communication networks broken down by cell type and fibroblast cluster in normal control (C), nonobstructive (D), and obstructive (E) conditions. Figure formatting follows panel A. Numbers indicate the quantity of uniquely expressed ligand–receptor pairs between the broadcasting cell type (expressing ligand) and receiving cell type (expressing receptor).
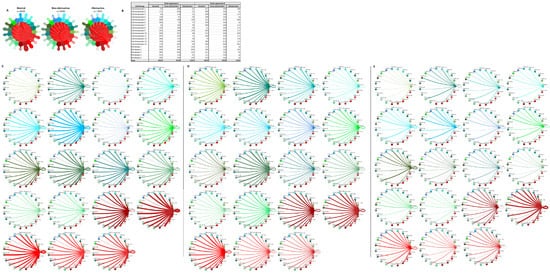
Cardiomyocyte subtypes also demonstrate diversity in their intercellular interactions in normal and HCM tissue, as previously reported [13,14][10][11]. To understand how these interactions compare and contrast in nonobstructive and obstructive HCM, we analyzed the L–R pair gene expression for all cardiomyocyte subtypes in conjunction with all other cell types (Figure 85). As with the general population and the fibroblast subtype interaction networks, in the cardiomyocyte subtype interactome there was a stepwise decrease in L–R pairs from normal (n = 4854) to nonobstructive (n = 3836) to obstructive (n = 2294) HCM. Cardiomyocyte clusters 1, 2, 3, 7, and 8 did not follow this trend, however, expressing higher numbers of ligands in nonobstructive HCM compared to both normal and obstructive HCM tissue. Cardiomyocyte clusters 3 and 7 also demonstrated higher than normal numbers of ligands in obstructive HCM, but to a far lesser extent (Figure 85B–E). Cardiomyocyte clusters 3, 5, and 7 and dendritic cells expressed higher numbers of receptors than normal tissue in nonobstructive HCM. Cardiomyocyte clusters 3 and 7 also showed higher numbers of receptors in obstructive HCM compared to normal tissue, but less than those in nonobstructive HCM (Figure 85B–E). Comparing L–R pairs more directly in HCM samples indicates that cardiomyocyte cluster 10 demonstrates the greatest reduction in L–R pairs in obstructive HCM compared to nonobstructive HCM, while cardiomyocyte cluster 9 shows the greatest increase (Figure 85D,E). The reduction in cardiomyocyte cluster 10 communication to dendritic cells; leukocytes; and cardiomyocyte clusters 4, 5, 8, 10, 12, 13, and 14 in obstructive HCM is driven by a loss of ITGB1 receptor expression in conjunction with a reduction in the expression of ITGB1 ligands. The increase in cardiomyocyte cluster 9 communication involves cardiomyocyte clusters 7, 9, and 13 and is driven by the increased expression of the ITGB1 ligands COL6A2, LUM, and VEGFA and the ligand CALM2.
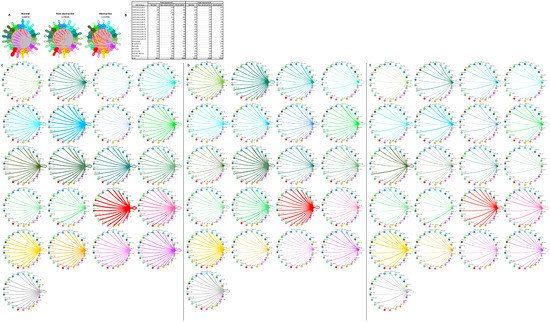
Figure 85. Cell–cell communication networks between cardiomyocyte subtypes and other heart cells in normal control, nonobstructive HCM, and obstructive HCM conditions. (A) Comparison of normal (left), nonobstructive HCM (middle), and obstructive HCM (right) communication networks. Line color indicates ligand broadcast by the cell population with the same color. Lines connect to cell types that expressed cognate receptors. Line thickness is proportional to the number of uniquely expressed ligand–receptor pairs. Loops indicate communication within a cell type. (B) Quantity of ligands and receptors in expressed ligand–receptor pairs described by cell type and condition (normal, nonobstructive HCM, or obstructive HCM). (C–E) Cell–cell communication networks broken down by cell type and cardiomyocyte cluster in normal control (C), nonobstructive HCM (D), and obstructive HCM (E) conditions. Figure formatting follows panel A. Numbers indicate the quantity of uniquely expressed ligand–receptor pairs between the broadcasting cell type (expressing ligand) and receiving cell type (expressing receptor).
The cardiomyocyte–fibroblast interaction network has also been postulated to play an important role in the pathogenesis of HCM through direct cellular interactions and indirect interactions with the extracellular matrix, and prior studies have shown HCM-associated alterations in cardiomyocyte–fibroblast interactions [5,13,14]. The analysis of L–R pairs among the cardiomyocytes and fibroblasts reveals the same trend seen in the general population of cells, with the greatest number of potential interactions occurring in normal cells (n = 4500) followed by nonobstructive HCM cells (n = 3509) then obstructive HCM cells (n = 1933;
The cardiomyocyte–fibroblast interaction network has also been postulated to play an important role in the pathogenesis of HCM through direct cellular interactions and indirect interactions with the extracellular matrix, and prior studies have shown HCM-associated alterations in cardiomyocyte–fibroblast interactions [5][10][11]. The analysis of L–R pairs among the cardiomyocytes and fibroblasts reveals the same trend seen in the general population of cells, with the greatest number of potential interactions occurring in normal cells (n = 4500) followed by nonobstructive HCM cells (n = 3509) then obstructive HCM cells (n = 1933;
Figure 9A,B). Cardiomyocyte clusters 1, 2, 3, 7, and 14 do not follow this trend by expressing higher numbers of ligands in nonobstructive HCM compared to both normal and obstructive tissue. Cardiomyocyte clusters 3 and 7 also express higher numbers of ligand in obstructive HCM than normal tissue, although the numbers are less than those seen in nonobstructive tissue (
6A,B). Cardiomyocyte clusters 1, 2, 3, 7, and 14 do not follow this trend by expressing higher numbers of ligands in nonobstructive HCM compared to both normal and obstructive tissue. Cardiomyocyte clusters 3 and 7 also express higher numbers of ligand in obstructive HCM than normal tissue, although the numbers are less than those seen in nonobstructive tissue (
Figure 9B). Cardiomyocyte clusters 8, 10, and 12 and fibroblast clusters 1 and 4 express higher levels of receptors than normal cells in nonobstructive HCM. Cardiomyocyte clusters 8 and 12 also express higher levels of receptors than normal cells, but to a lesser degree than nonobstructive HCM cells (
6B). Cardiomyocyte clusters 8, 10, and 12 and fibroblast clusters 1 and 4 express higher levels of receptors than normal cells in nonobstructive HCM. Cardiomyocyte clusters 8 and 12 also express higher levels of receptors than normal cells, but to a lesser degree than nonobstructive HCM cells (
Figure 9B–E). A more direct comparison of nonobstructive HCM and HCM reveals that the greatest difference in L–R pair number occurs in cardiomyocyte cluster 10, with reduced communication with cardiomyocyte clusters 5, 8, 10, 12, 13, and 14 and with fibroblast clusters 1, 4, and 5, largely due to the loss of the ITGB1 receptor and many ITGB1 ligands (
6B–E). A more direct comparison of nonobstructive HCM and HCM reveals that the greatest difference in L–R pair number occurs in cardiomyocyte cluster 10, with reduced communication with cardiomyocyte clusters 5, 8, 10, 12, 13, and 14 and with fibroblast clusters 1, 4, and 5, largely due to the loss of the ITGB1 receptor and many ITGB1 ligands (
Figure 9D,E). The greatest increase in communication in the cardiomyocyte–fibroblast interaction network occurs between fibroblast cluster 2 and itself and cardiomyocyte cluster 9 and itself. The increase in communication in fibroblast cluster 2 is driven by the increased expression of ITGB1 ligands such as COL1A1, FBLN1, FBN1, HPG2, LAMC1, LGALS38P, and the LRP1 receptor. The increase in communication in cardiomyocyte cluster 9 is driven by the expression of the CALM2 ligand; the ITGB1 receptor ligands COL6A2, LUM, and VEGF-A; the receptor INSR; and at least one component of the L–R pair TIMP1 and CD63.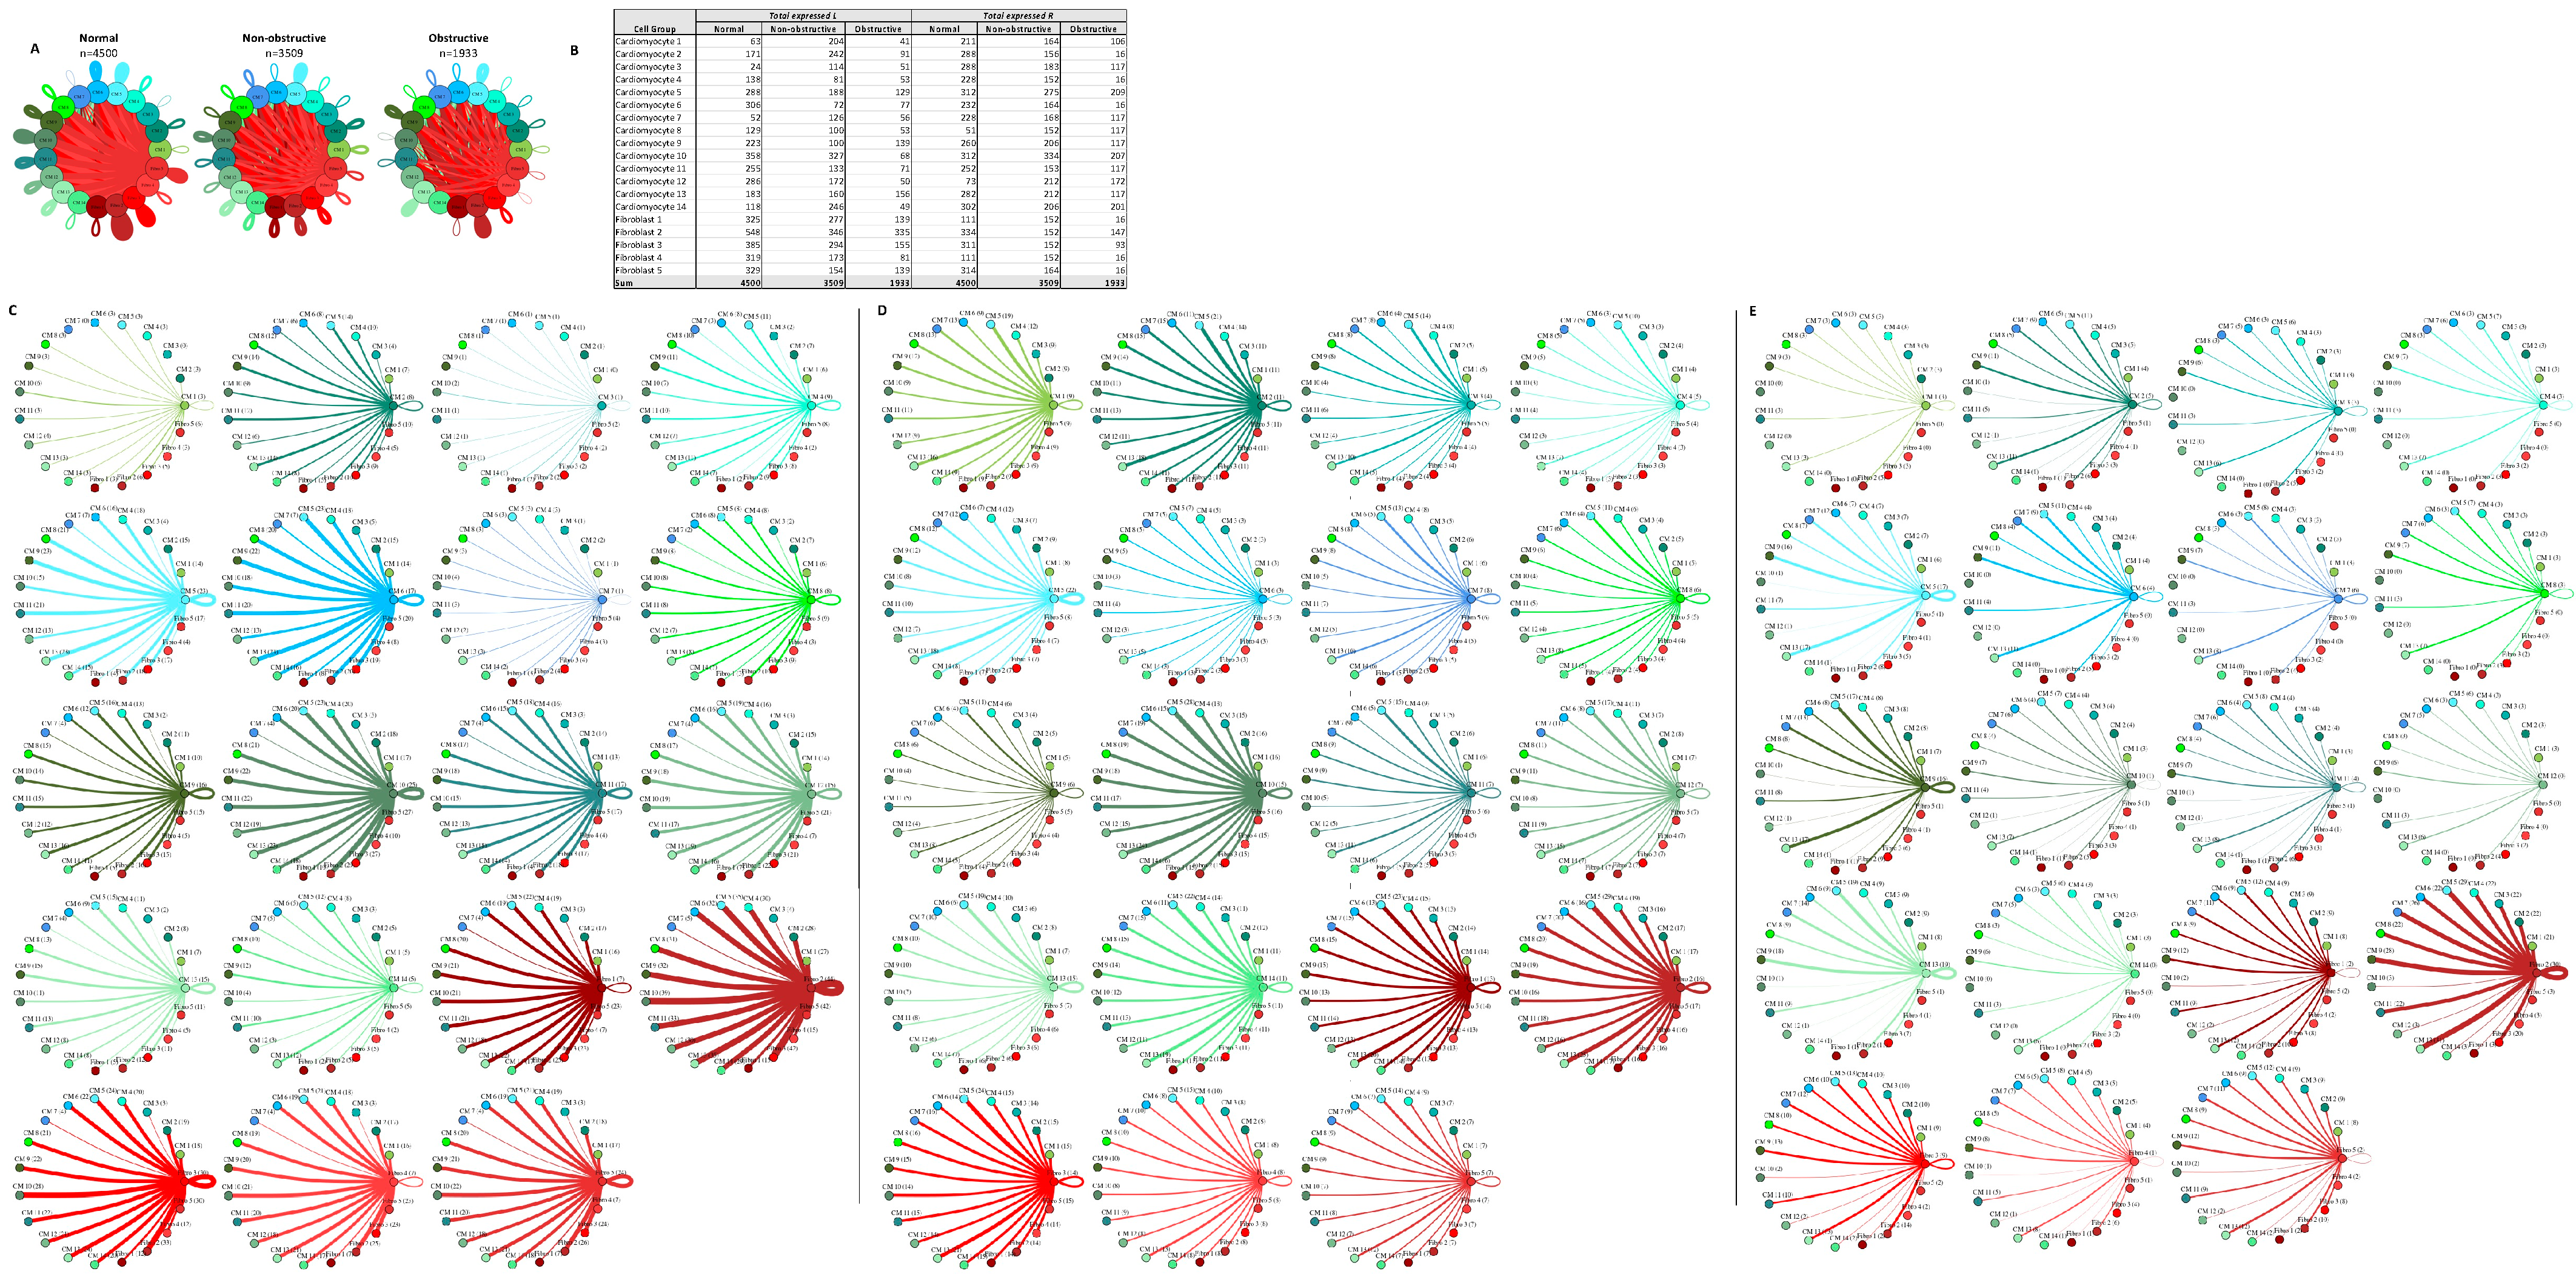
6D,E). The greatest increase in communication in the cardiomyocyte–fibroblast interaction network occurs between fibroblast cluster 2 and itself and cardiomyocyte cluster 9 and itself. The increase in communication in fibroblast cluster 2 is driven by the increased expression of ITGB1 ligands such as COL1A1, FBLN1, FBN1, HPG2, LAMC1, LGALS38P, and the LRP1 receptor. The increase in communication in cardiomyocyte cluster 9 is driven by the expression of the CALM2 ligand; the ITGB1 receptor ligands COL6A2, LUM, and VEGF-A; the receptor INSR; and at least one component of the L–R pair TIMP1 and CD63.
Figure 96. Cell–cell communication networks between cardiac fibroblast and cardiomyocyte subtypes in normal control, nonobstructive HCM, and obstructive HCM conditions. (A) Overall communication networks between normal, nonobstructive, and obstructive HCM cardiomyocytes and fibroblasts. Line color indicates ligand broadcast by the cell population with the same color. Lines connect to cell types which expressed cognate receptors. Line thickness is proportional to the number of uniquely expressed ligand–receptor pairs. Loops indicate communication within a cell type. (B) Quantity of ligands and receptors in expressed ligand–receptor pairs described by cell type and condition (normal, nonobstructive HCM, or obstructive HCM). (C–E) Cell–cell communication networks broken down by cardiomyocyte cluster and fibroblast cluster in normal control (C), nonobstructive HCM (D), and obstructive HCM (E) conditions. Figure formatting follows panel A. Numbers indicate the quantity of uniquely expressed ligand–receptor pairs between the broadcasting cell type (expressing ligand) and receiving cell type (expressing receptor).
References
- Maron, B.J.; Longo, D.L. Clinical Course and Management of Hypertrophic Cardiomyopathy. N. Engl. J. Med. 2018, 379, 655–668.
- Thierfelder, L.; Watkins, H.; MacRae, C.; Lamas, R.; McKenna, W.; Vosberg, H.P.; Seidman, J.G.; Seidman, C.E. Alpha-tropomyosin and cardiac troponin T mutations cause familial hypertrophic cardiomyopathy: A disease of the sarcomere. Cell 1994, 77, 701–712.
- Maron, B.J.; Maron, M.S.; Maron, B.A.; Loscalzo, J. Moving Beyond the Sarcomere to Explain Heterogeneity in Hypertrophic Cardiomyopathy: JACC Review Topic of the Week. J. Am. Coll. Cardiol. 2019, 73, 1978–1986.
- Bonaventura, J.; Polakova, E.; Vejtasova, V.; Veselka, J. Genetic Testing in Patients with Hypertrophic Cardiomyopathy. Int. J. Mol. Sci. 2021, 22, 10401.
- Chou, C.; Chin, M.T. Pathogenic Mechanisms of Hypertrophic Cardiomyopathy beyond Sarcomere Dysfunction. Int. J. Mol. Sci. 2021, 22, 8933.
- Ho, C.Y.; Day, S.M.; Ashley, E.A.; Michels, M.; Pereira, A.C.; Jacoby, D.; Cirino, A.L.; Fox, J.C.; Lakdawala, N.K.; Ware, J.S.; et al. Genotype and Lifetime Burden of Disease in Hypertrophic Cardiomyopathy: Insights from the Sarcomeric Human Cardiomyopathy Registry (SHaRe). Circulation 2018, 138, 1387–1398.
- Harper, A.R.; Goel, A.; Grace, C.; Thomson, K.L.; Petersen, S.E.; Xu, X.; Waring, A.; Ormondroyd, E.; Kramer, C.M.; Ho, C.Y.; et al. Common genetic variants and modifiable risk factors underpin hypertrophic cardiomyopathy susceptibility and expressivity. Nat. Genet. 2021, 53, 135–142.
- Tadros, R.; Francis, C.; Xu, X.; Vermeer, A.M.C.; Harper, A.R.; Huurman, R.; Kelu Bisabu, K.; Walsh, R.; Hoorntje, E.T.; Te Rijdt, W.P.; et al. Shared genetic pathways contribute to risk of hypertrophic and dilated cardiomyopathies with opposite directions of effect. Nat. Genet. 2021, 53, 128–134.
- Watkins, H. Time to Think Differently About Sarcomere-Negative Hypertrophic Cardiomyopathy. Circulation 2021, 143, 2415–2417.
- Larson, A.; Codden, C.J.; Huggins, G.S.; Rastegar, H.; Chen, F.Y.; Maron, B.J.; Rowin, E.J.; Maron, M.S.; Chin, M.T. Altered Intercellular Communication and Extracellular Matrix Signaling as a Potential Disease Mechanism in Human Hypertrophic Cardiomyopathy. medRxiv 2021.
- Codden, C.J.; Larson, A.; Awata, J.; Perera, G.; Chin, M.T. Single nucleus RNA-sequencing reveals altered intercellular communication and dendritic cell activation in nonobstructive hypertrophic cardiomyopathy. medRxiv 2021.
- Skelly, D.A.; Squiers, G.T.; McLellan, M.A.; Bolisetty, M.T.; Robson, P.; Rosenthal, N.A.; Pinto, A.R. Single-Cell Transcriptional Profiling Reveals Cellular Diversity and Intercommunication in the Mouse Heart. Cell Rep. 2018, 22, 600–610.
- McLellan, M.A.; Skelly, D.A.; Dona, M.S.I.; Squiers, G.T.; Farrugia, G.E.; Gaynor, T.L.; Cohen, C.D.; Pandey, R.; Diep, H.; Vinh, A.; et al. High-Resolution Transcriptomic Profiling of the Heart During Chronic Stress Reveals Cellular Drivers of Cardiac Fibrosis and Hypertrophy. Circulation 2020, 142, 1448–1463.
- Wang, H.; Kwak, D.; Fassett, J.; Liu, X.; Yao, W.; Weng, X.; Xu, X.; Xu, Y.; Bache, R.J.; Mueller, D.L.; et al. Role of bone marrow-derived CD11c(+) dendritic cells in systolic overload-induced left ventricular inflammation, fibrosis and hypertrophy. Basic Res. Cardiol. 2017, 112, 25.
- Athanassopoulos, P.; Balk, A.H.; Vaessen, L.M.; Caliskan, K.; Takkenberg, J.J.; Weimar, W.; Bogers, A.J. Blood dendritic cell levels and phenotypic characteristics in relation to etiology of end-stage heart failure: Implications for dilated cardiomyopathy. Int. J. Cardiol. 2009, 131, 246–256.
- Yokota-Nakatsuma, A.; Ohoka, Y.; Takeuchi, H.; Song, S.Y.; Iwata, M. Beta 1-integrin ligation and TLR ligation enhance GM-CSF-induced ALDH1A2 expression in dendritic cells, but differentially regulate their anti-inflammatory properties. Sci. Rep. 2016, 6, 37914.
- Swetman Andersen, C.A.; Handley, M.; Pollara, G.; Ridley, A.J.; Katz, D.R.; Chain, B.M. beta1-Integrins determine the dendritic morphology which enhances DC-SIGN-mediated particle capture by dendritic cells. Int. Immunol. 2006, 18, 1295–1303.
- Kusuma, S.; Zhao, S.; Gerecht, S. The extracellular matrix is a novel attribute of endothelial progenitors and of hypoxic mature endothelial cells. FASEB J. 2012, 26, 4925–4936.
More