Your browser does not fully support modern features. Please upgrade for a smoother experience.
Please note this is a comparison between Version 1 by Fernando Fernández-Aranda and Version 2 by Yvaine Wei.
Food addiction (FA) has been mentioned as a potential subtype of obesity, and has been associated with Eating Disorders (ED). A first approach of a phenotypic characterization of food addiction (FA) found three clusters (dysfunctional, moderate and functional).
- food addiction
- eating disorders
- treatment outcome
1. Introduction
Even though food addiction (FA) has not being included as a formal mental disorder in the Diagnostic and Statistical Manual (DSM-5) [1], it is a concept of ongoing scientific interest and debate. According to the FA model, some foods, especially palatable ones, may be involved in producing both overeating and addictive-like behaviours, thus, phenomenological similarities with addictive disorders could been found [2].
FA mainly in binge spectrum disorders as bulimia nervosa (BN) [3][4][6,7] and binge eating disorder (BED) [5][6][8,9]. It has been associated with higher body mass index (BMI), binge-eating episodes, higher eating psychopathology, more impulsive personality traits, and craving for highly palatable food [7][8][9][10,11,12], as well as poorer response to therapy [10][11][13,14].
Additionally, other predictors of developing severe symptomatology of food addiction are presenting dysfunctional personality traits, high emotional dysregulation, and high general psychopathology [12][13][15,16], and be women [14][17].
In the prior study, a sample of Eating Disorders (ED) and obesity patients was included, and three clusters were obtained: (a) dysfunctional cluster (mainly represented by other specified feeding or eating disorders (OSFED)OSFED and BN), (b) moderate cluster (mainly represented by BN and BED patients) and (c) functional cluster (mainly represented by obesity and BED patients).
2. Findings of Different Clusters
Figure 1 displays the 100% stacked bar chart with the percentage of patients with a specific ED subtype within each cluster. Differences between the groups were found: The dysfunctional cluster (C1) included a high and similar distribution for BN and OSFED patients; the moderate (C2) cluster included mostly BN patients, following by a high percentage as well of BED; the functional (C3) cluster included a high proportion of BN patients, and similar percentage of BED and OSFED.
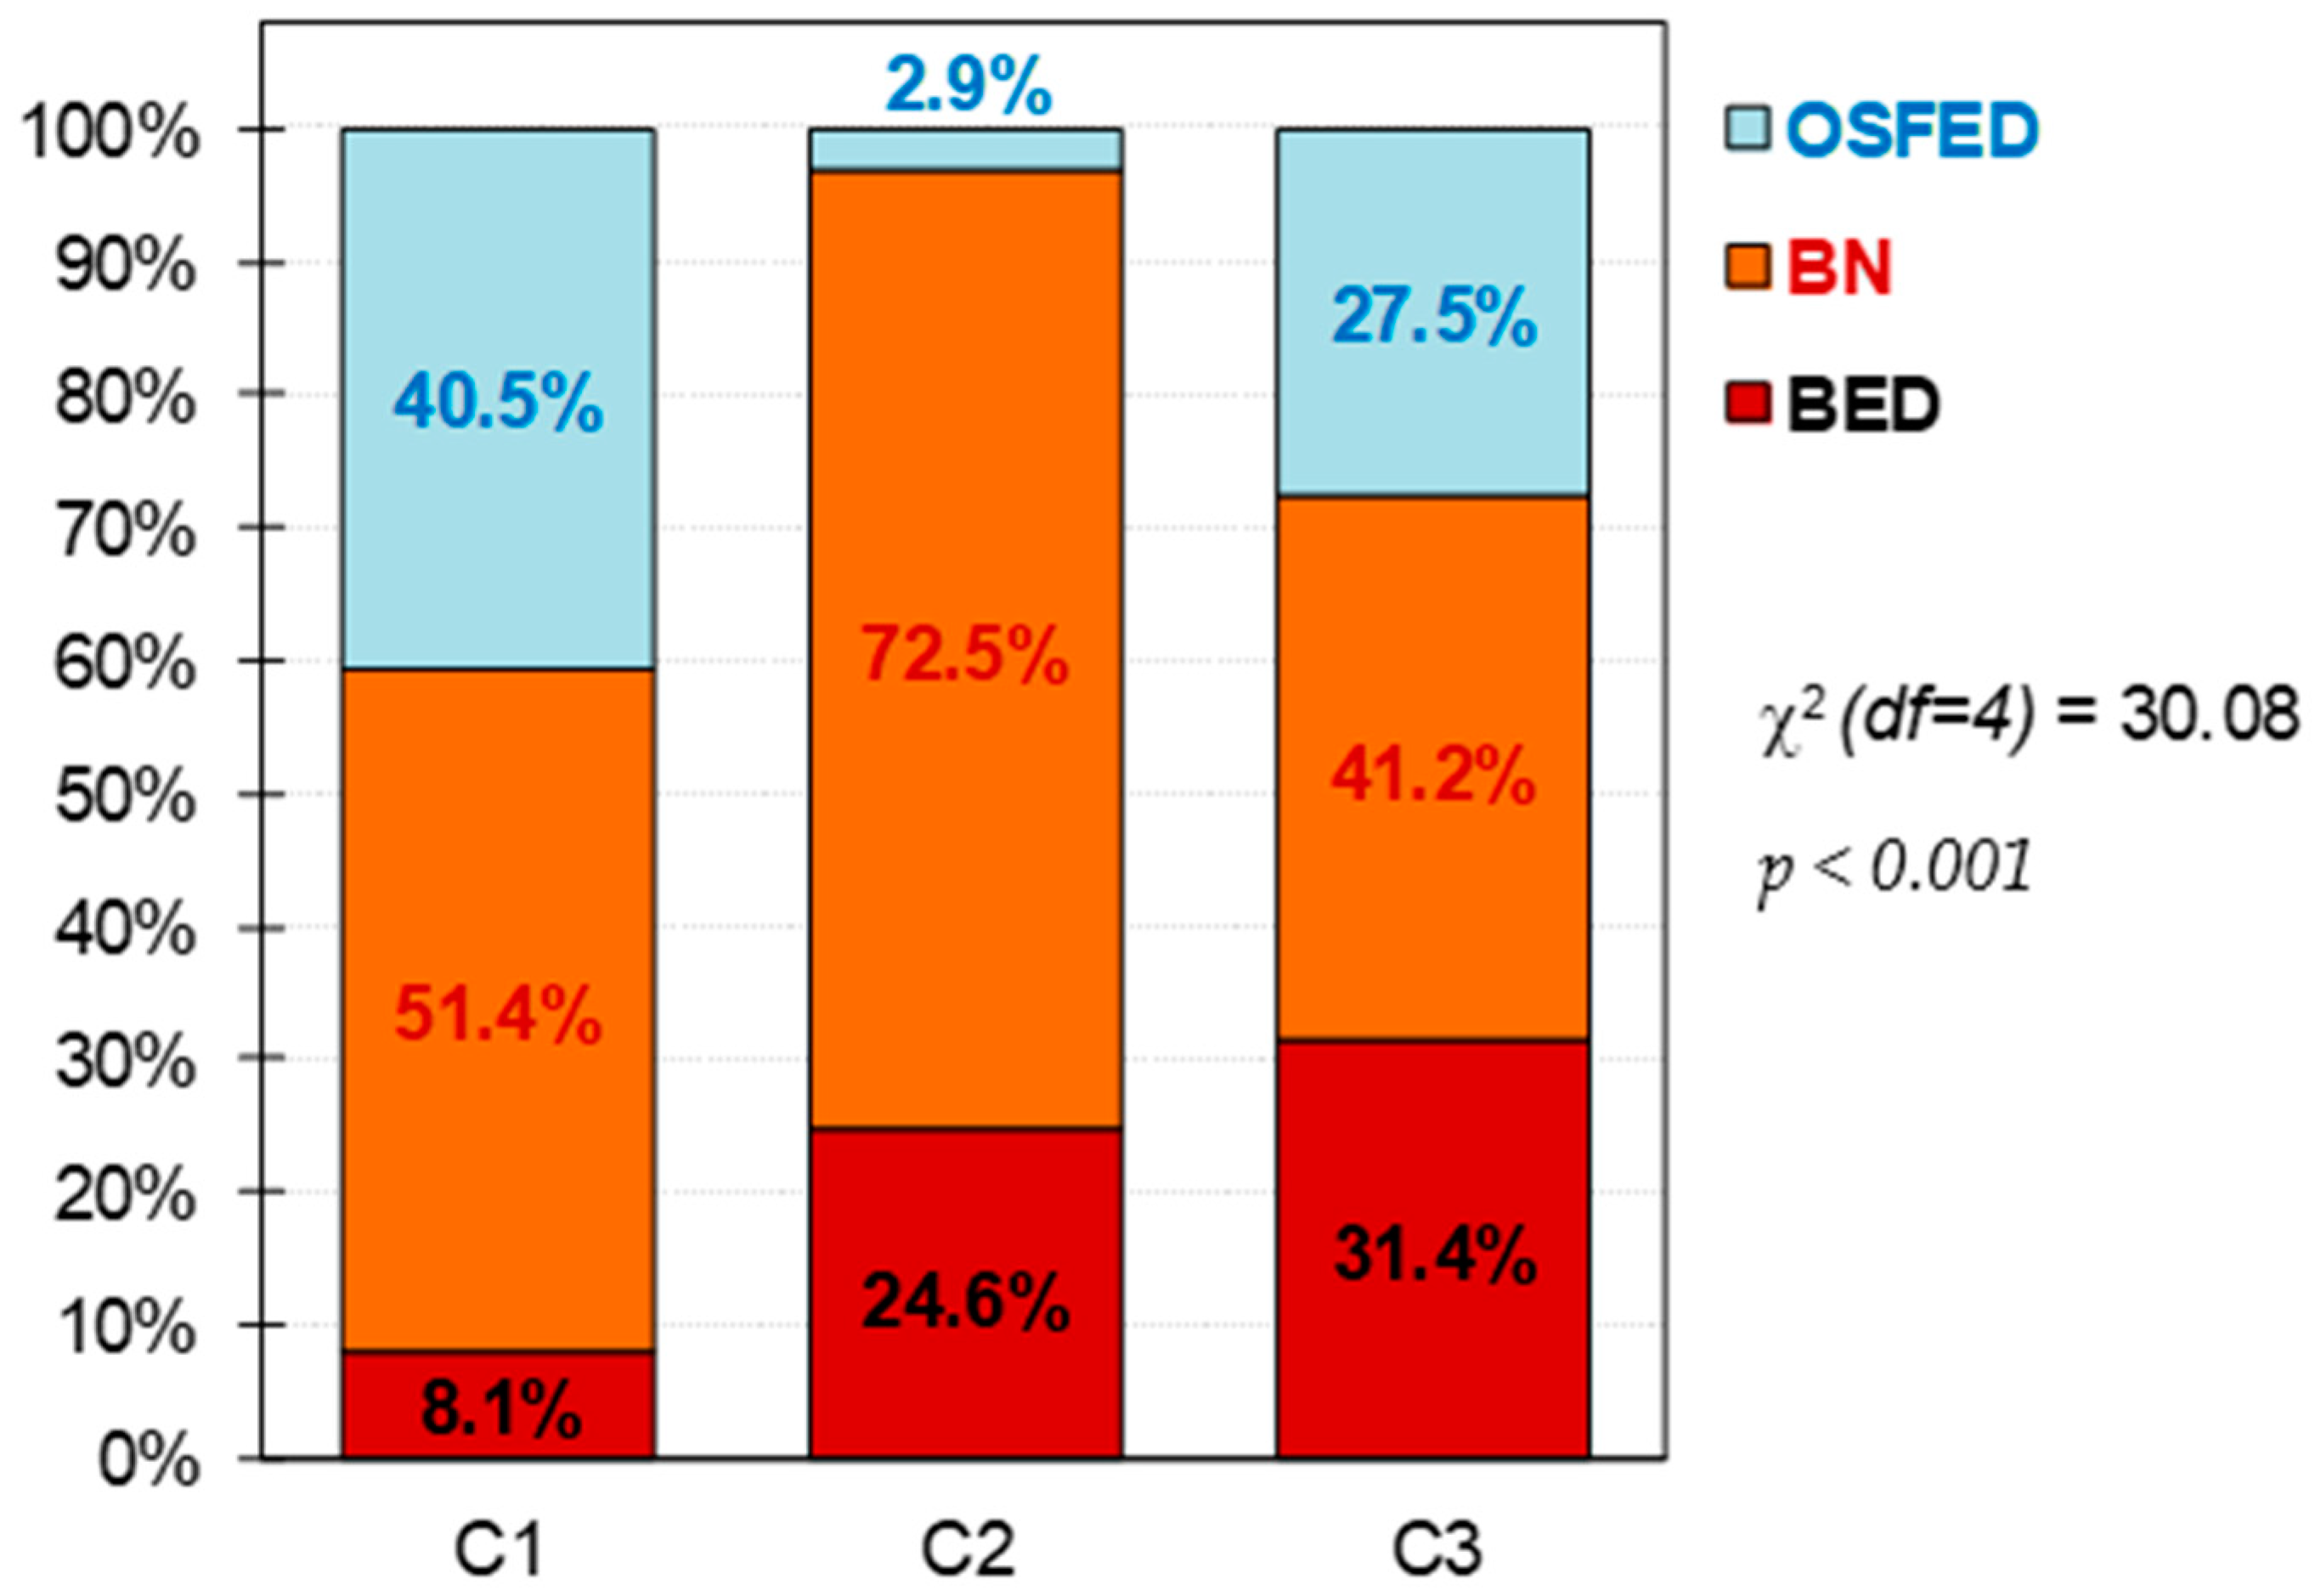
Figure 1. Composition of the clusters. Note. C1: cluster 1, dysfunctional cluster. C2: cluster 2, moderate cluster. C3: cluster 3, functional cluster. BED: binge eating disorder. BN: bulimia nervosa. OSFED: other specified feeding eating disorder. df = degrees of freedom. Sample size: n = 157.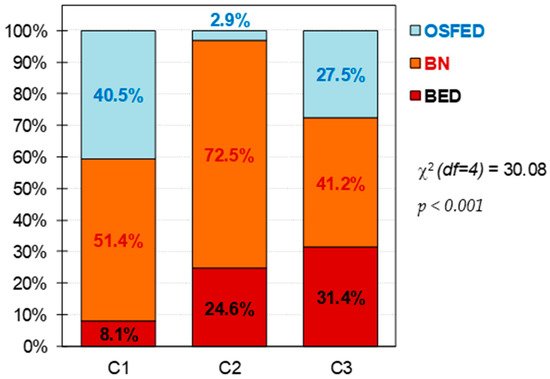
Figure 1. Composition of the clusters. Note. C1: cluster 1, dysfunctional cluster. C2: cluster 2, moderate cluster. C3: cluster 3, functional cluster. BED: binge eating disorder. BN: bulimia nervosa. OSFED: other specified feeding eating disorder. df = degrees of freedom. Sample size: n = 157.
The upper part of Table 12 shows the comparison between the clusters at baseline, and the lower part of the table shows the comparison for the CBT treatment outcomes. FA levels was higher in the moderate cluster (C2), followed by the dysfunctional one (C1), while the C3 (functional) presented the lower levels of FA. According to clinical characteristics, the dysfunctional cluster (C1) was characterized by the lowest mean for the BMI, the highest ED symptom levels (except for the EDI-2 bulimia scale), the worst psychopathology global state, and the highest levels in the personality domains of harm avoidance and self-transcendence. This cluster was also the one with the lowest percentage of participant with full remission (see also Figure 2). The functional cluster (C3) was the cluster with the lowest ED severity level, best psychological state, the lowest score in harm avoidance, and the highest scores in the personality traits of reward-dependence, persistence, self-directedness and cooperativeness. As well, this cluster also had the highest percentage of patients with full remission (Figure 2). C2, the moderate one, present intermediate levels of these clinical characteristics; however, it had the highest levels of dropouts.
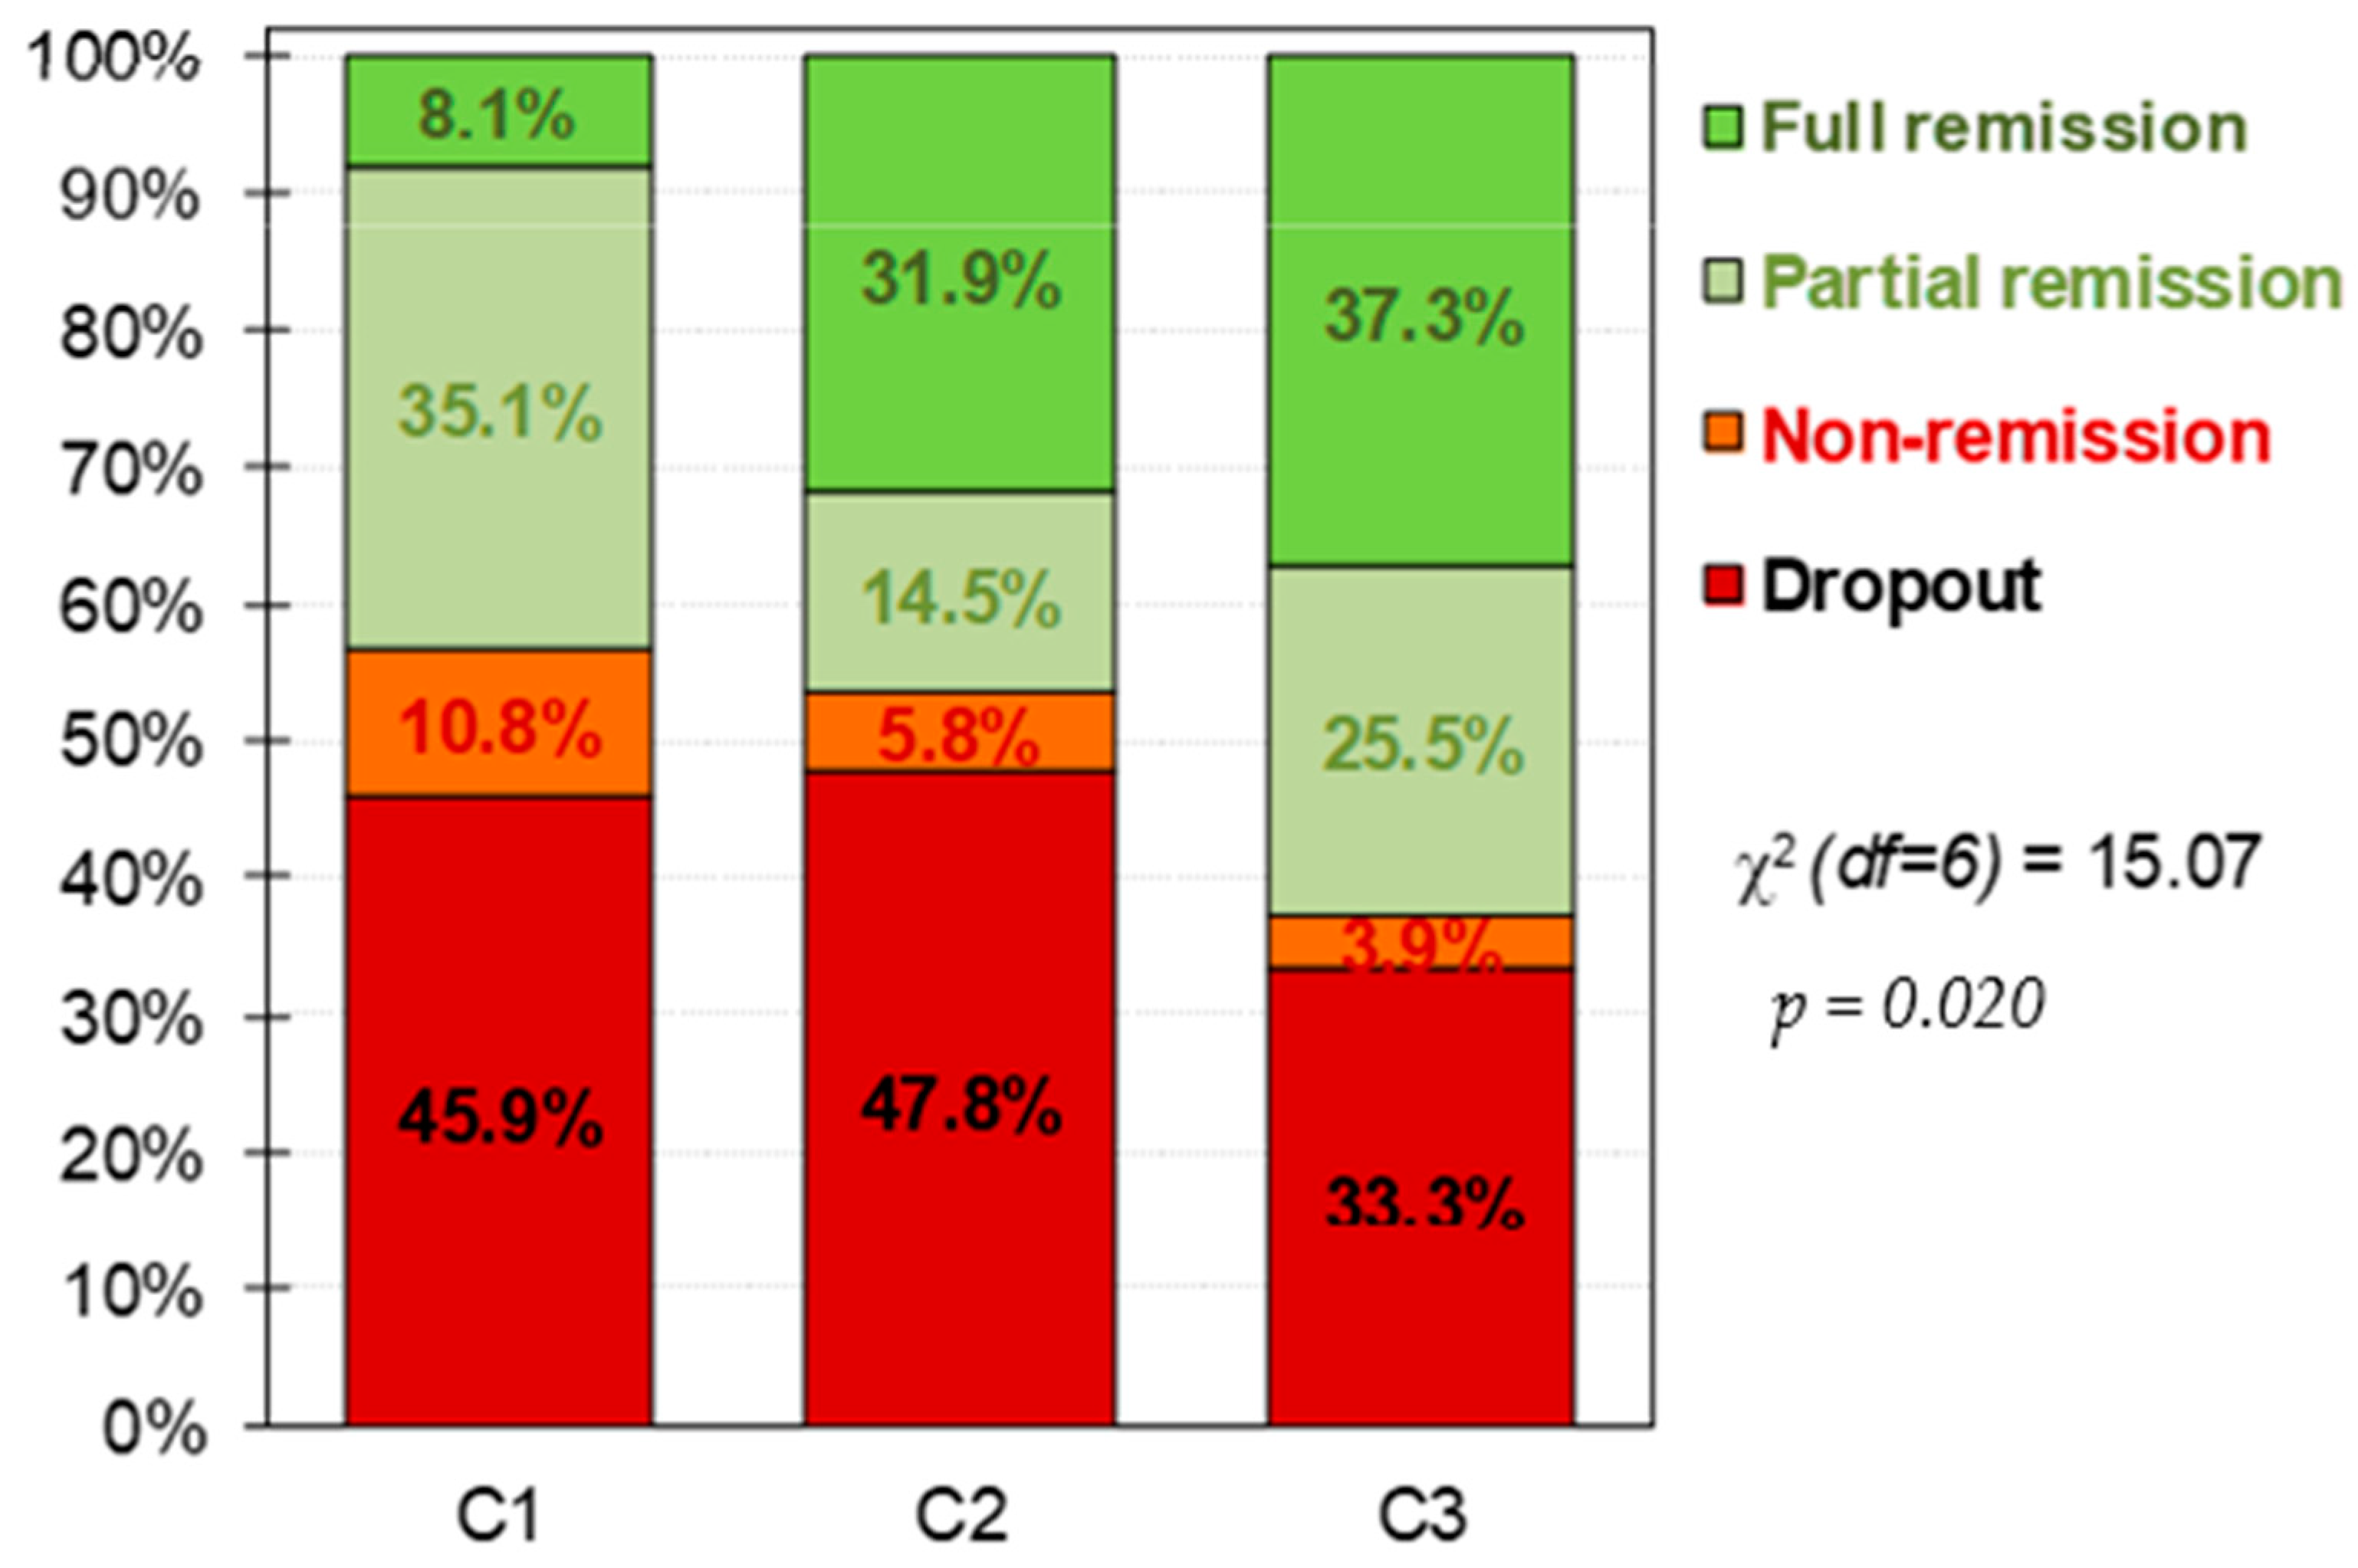
Figure 2. Distribution of the CBT outcomes within the clusters. Note. C1: cluster 1, dysfunctional cluster. C2: cluster 2, moderate cluster. C3: cluster 3, functional cluster. df = degrees of freedom. Sample size: n = 157.
Figure 2. Distribution of the CBT outcomes within the clusters. Note. C1: cluster 1, dysfunctional cluster. C2: cluster 2, moderate cluster. C3: cluster 3, functional cluster. df = degrees of freedom. Sample size: n = 157.
Table 12.
Comparison of clusters at baseline and CBT outcomes.
| Cluster-1 (n = 37) |
Cluster-2 (n = 69) |
Cluster-3 (n = 51) |
Cluster-1 vs. Cluster-2 |
Cluster-1 vs. Cluster-3 |
Cluster-2 vs. Cluster-3 |
||||||||
|---|---|---|---|---|---|---|---|---|---|---|---|---|---|
| α | Mean | SD | Mean | SD | Mean | SD | p | |d| | p | |d| | p | |d| | |
| BMI-FA | |||||||||||||
| BMI (kg/m2) | 25.96 | 7.44 | 29.42 | 8.54 | 30.77 | 10.15 | 0.057 | 0.43 | 0.013 * | 0.54 † | 0.411 | 0.14 | |
| YFAS total score | 0.939 | 8.46 | 2.38 | 9.48 | 1.99 | 7.53 | 2.72 | 0.034 * | 0.46 | 0.068 | 0.36 | 0.001 * | 0.82 † |
| EDI -2 Drive-thinness | 0.767 | 18.03 | 2.71 | 15.94 | 4.77 | 14.14 | 4.94 | 0.022 * | 0.54 † | 0.001 * | 0.98 † | 0.029 * | 0.37 |
| EDI-2 Body-dissatisfac. | 0.850 | 21.30 | 5.73 | 20.59 | 6.52 | 16.96 | 7.17 | 0.600 | 0.11 | 0.003 * | 0.67 † | 0.003 * | 0.53 † |
| EDI-2 Int-awareness | 0.798 | 18.22 | 5.67 | 15.46 | 5.36 | 8.00 | 5.71 | 0.016 * | 0.50 † | 0.001 * | 1.80 † | 0.001 * | 1.35 † |
| EDI-2 Bulimia | 0.726 | 8.54 | 5.78 | 11.52 | 3.91 | 7.33 | 4.89 | 0.002 * | 0.60 † | 0.239 | 0.23 | 0.001 * | 0.95 † |
| EDI-2 Interper-distrust | 0.813 | 9.08 | 5.24 | 6.97 | 4.65 | 3.49 | 3.60 | 0.022 * | 0.43 | 0.001 * | 1.24 † | 0.001 * | 0.84 † |
| EDI-2 Ineffectiveness. | 0.848 | 17.38 | 6.55 | 14.88 | 5.70 | 6.88 | 4.68 | 0.031 * | 0.41 | 0.001 * | 1.84 † | 0.001 * | 1.53 † |
| EDI-2 Maturity-fears | 0.752 | 12.27 | 5.03 | 9.17 | 5.32 | 6.51 | 5.17 | 0.004 * | 0.60 † | 0.001 * | 1.13 † | 0.006 * | 0.51 † |
| EDI-2 Perfectionism | 0.740 | 6.95 | 5.12 | 6.14 | 4.24 | 4.65 | 3.97 | 0.371 | 0.17 | 0.016 * | 0.50 † | 0.066 | 0.36 |
| EDI-2 Impulse-regulat. | 0.730 | 13.22 | 5.28 | 7.57 | 4.37 | 3.18 | 3.18 | 0.001 * | 1.17 † | 0.001 * | 2.30 † | 0.001 * | 1.15 † |
| EDI-2 Ascetic | 0.702 | 10.35 | 2.99 | 8.77 | 2.92 | 5.61 | 3.11 | 0.010 * | 0.54 † | 0.001 * | 1.56 † | 0.001 * | 1.05 † |
| EDI-2 Social Insecurity | 0.752 | 12.76 | 4.78 | 9.41 | 4.17 | 4.49 | 2.82 | 0.001 * | 0.75 † | 0.001 * | 2.11 † | 0.001 * | 1.38 † |
| EDI-2 Total score | 0.923 | 148.1 | 27.28 | 126.4 | 20.73 | 81.24 | 22.63 | 0.001 * | 0.89 † | 0.001 * | 2.67 † | 0.001 * | 2.08 † |
| SCL-90R GSI | 0.966 | 2.67 | 0.33 | 2.07 | 0.35 | 1.28 | 0.36 | 0.001 * | 1.80 † | 0.001 * | 4.03 † | 0.001 * | 2.22 † |
| SCL-90R PST | 0.966 | 81.81 | 6.10 | 72.46 | 7.78 | 55.98 | 11.90 | 0.001 * | 1.34 † | 0.001 * | 2.73 † | 0.001 * | 1.64 † |
| SCL-90R PSDI | 0.966 | 2.94 | 0.33 | 2.58 | 0.36 | 2.04 | 0.34 | 0.001 * | 1.05 † | 0.001 * | 2.70 † | 0.001 * | 1.54 † |
| TCI-R Novelty-seeking | 0.806 | 103.5 | 16.07 | 98.4 | 17.27 | 102.7 | 15.88 | 0.133 | 0.31 | 0.811 | 0.05 | 0.168 | 0.26 |
| TCI-R Harm-avoidance | 0.887 | 133.7 | 14.52 | 126.4 | 17.00 | 109.0 | 16.24 | 0.028 * | 0.46 | 0.001 * | 1.60 † | 0.001 * | 1.05 † |
| TCI-R Reward.depend. | 0.831 | 97.5 | 17.30 | 98.3 | 14.06 | 104.8 | 15.59 | 0.797 | 0.05 | 0.029 * | 0.44 | 0.023 * | 0.44 |
| TCI-R Persistence | 0.896 | 102.8 | 22.46 | 100.8 | 20.27 | 108.4 | 19.78 | 0.633 | 0.09 | 0.213 | 0.26 | 0.048 * | 0.38 |
| TCI-R Self-directed. | 0.840 | 96.9 | 14.94 | 102.9 | 13.17 | 125.3 | 16.89 | 0.053 | 0.42 | 0.001 * | 1.78 † | 0.001 * | 1.48 † |
| TCI-R Cooperativeness | 0.861 | 127.8 | 20.24 | 133.7 | 17.15 | 139.3 | 11.88 | 0.082 | 0.31 | 0.002 * | 0.69 † | 0.067 | 0.38 |
| TCI-R Self-transcend. | 0.862 | 77.1 | 12.09 | 62.1 | 14.38 | 63.2 | 16.37 | 0.001 * | 1.13 † | 0.001 * | 0.97 † | 0.672 | 0.07 |
| CBT outcomes | n | % | n | % | n | % | p | |h| | p | |h| | p | |h| | |
| Dropout | 17 | 45.9% | 33 | 47.8% | 17 | 33.3% | 0.010 * | 0.04 | 0.016 * | 0.26 | 0.286 | 0.30 | |
| Non-remission | 4 | 10.8% | 4 | 5.8% | 2 | 3.9% | 0.18 | 0.27 | 0.09 | ||||
| Partial remission | 13 | 35.1% | 10 | 14.5% | 13 | 25.5% | 0.51 † | 0.21 | 0.28 | ||||
| Full remission | 3 | 8.1% | 22 | 31.9% | 19 | 37.3% | 0.62 † | 0.74 † | 0.11 | ||||
Note. Cronbach’s-alpha in the study. Custer 1: dysfunctional cluster; Cluster 2: Moderate cluster; Cluster 3: Functional cluster. SD: standard deviation; BMI: Body Mass Index; FA: food addiction; EDI: Eating Disorders Inventory; SCL: Symptom Checklist; GSI: Global Gravity Index; TCI: Temperament and Character Inventory; CBT: cognitive–behavioural therapy. * Bold: significant comparison (0.05). † Bold: effect size into the ranges mild-moderate to the high-large.
3. Current Insights
The functional cluster (C3), do present better treatment response and lower dropout rates than the moderate (C2) and dysfunctional (C1) clusters.
First, as in the prior study [15][18], FA levels were higher in the moderate cluster, followed by the dysfunctional one, and lower in the functional. The composition of each cluster regarding the diagnosis of the patients was maintained for the dysfunctional and moderate clusters, however, the composition of the functional one changed.
Dysfunctional cluster (C1) had higher presence of BN and OSFED patients, higher severity of the disorder and worst psychopathological state, as well as low self-directedness and high harm avoidance. The functional cluster (C3) had more equilibrated proportion of diagnosis subtypes, with BN being more prevalent, and higher self-directedness and persistence, with lower levels of harm-avoidance. Finally, the moderate cluster (C2) had a heightened presence of BN (72.5%) followed by BED (24.6%), therefore, this cluster was particularly represented by binge ED subtypes; as well, this cluster had the highest levels of FA.
Thus, what differentiates the dysfunctional cluster (C1) from the other clusters is the severity of it clinical characteristics (except FA), while the moderate (C2) group differs from the functional (C3) and dysfunctional cluster (C1) by a higher severity of FA, and the functional cluster (C3) differ from the dysfunctional (C1) and moderate (C2) one by the low severity of its clinical profile.
Low levels of full remission and higher rates of dropouts in the dysfunctional cluster (C1) were found. This subgroup was highly represented for OSFED patients, which have been reported to present low harm avoidance and self-directedness, as well as higher severity of ED symptomatology, aspects identified as predictors of high drop-outs and low full remission rates [16][28]. Additionally, similar personality traits that imply difficulties in following goals and higher levels of anxiety levels have been found in BN patients (also present in this cluster) [17][33]. This has also been associated with low levels of full remission after cognitive behavioural treatment (CBT) [18][26]. Therefore, patients within this cluster may benefit from treatments that target the reduction of the ED symptomatology and general distress, as well as favour the improvement in the establishment and following of objectives. It is also important to mention that younger patients with an earlier onset of the disorder were particularly present in this cluster; therefore, these aspects could be added as indicators of a more dysfunctional profile. Of note, early onset of the disorder has already been mentioned as a predictor of a longer maintenance of the ED [19][34].
In the moderate cluster (C2), the highest dropout rates were found, as well medium rates of full remission in comparison with the dysfunctional (C1) and functional clusters (C3). This cluster was characterized by the presence of binge spectrum ED patients and by the higher levels of FA, both aspects that could be involved in the response to treatment of the participants in this cluster. It is possible that the higher presence of FA symptomology in binge spectrum ED (relative to non-binge ED) may reflect the more frequent binge eating episodes and food craving associated with FA [20][21][35,36].
Finally, the functional cluster (C3) presents the higher levels of full remission and the lowest of drop out, as well as had the lowest levels of severity of FA. Further, this cluster is clinically speaking the most functional, presenting low ED severity and general psychopathology. It also had the highest levels of self-directedness and persistence, which may be associated with good compliance with the treatment.