Your browser does not fully support modern features. Please upgrade for a smoother experience.
Please note this is a comparison between Version 1 by Hatem Taifour and Version 2 by Beatrix Zheng.
Jordan’s forested regions account for 0.71% of the total land area, with acacia woodland and forests combined totalling 2.3%. From the satellite image interpretation, two maps were created: an unsupervised land cover/land use map and a supervised map of present-day vegetation types, both consisting of 18 categories. These new maps should inform ecosystem management and conservation planning decisions in Jordan over the coming years.
- remote sensing
- Jordan
- land cover
- land use
- vegetation map
- vegetation type
- phytogeography
1. Introduction
If natural resources are to be managed sustainably, it is crucial to assess land cover/land use and the spatial distribution of vegetation types. This is also helpful for protecting habitats and for providing data for vegetation cover modelling. TheOur goal here in this research is s to derive accurate maps and cover estimates for vegetation in Jordan through the use of both field study and satellite imagery. Jordan is a region of high vegetation complexity and provides an ideal testing ground for methods in land cover and vegetation type mapping.
Since Alexander von Humboldt first began categorising vegetation zones in 1807, biogeographers have classified the planet into chorological units. Prior to his work, it was typical to focus on individual plants; Humboldt shifted this towards a more collective focus on species—their distribution, growth forms, and how they relate to their surroundings [1]. This new approach meant that communities and associations among plants were able to be identified [2]. August Grisebach utilised this new approach to develop what would become known as phytogeographic regions, including the Mediterranean and Irano–Turanian regions, according to the species composition and physiognomy of individual vegetation groups [2][3][2,3].
Jordan is situated at the meeting point of Europe, Asia, and Africa [4]. This is rare among countries, as four main plant geographical regions meet at this point. The first person to map these areas was Eig [5][6][5,6], who used his analysis of plant lists and assessment of the physiognomic characteristics of the region’s geography and topography to develop his maps. He denoted four main units for this region, all with discrete climate and flora: Irano–Turanian, Mediterranean, Saharo–Sindian, and minor Sudano–Decanian enclaves. Eig’s [5] findings revealed that around 30% of plant species were found in two or more phytogeographic regions. Attempts have been made by researchers such as Whyte to either amend the existing boundaries or to subdivide the regions further [4]; moreover, Zohary posited that as more reliable analytical tools are devised, more appropriate boundary changes may be possible [3].
The research of Zohary [3] into the origins and categorisation of Middle Eastern vegetation has been the standard by which phytogeography in the region has been interpreted for much of the last five decades. His work separated Arabia into two main floral areas, with the southern region belonging to the Sudano–Decanian, and the central and northern regions to the Saharo–Sindian [3]. This was not disputed until 1991, when White and Léonard [7] revised Zohary’s approach and extended the Somalia–Masai Regional Centre of Endemism and the Afro–Montane archipelago-like Regional Centre of Endemism into southwest Arabia and divided their Saharo–Sindian zone into the Nubo–Sindian subzone, which represents the old Sudano–Decanian tropical vegetation, of Zohary (with Vachellia tortilis), and the Saharo–Arabian subzone (extra-tropical vegetation), which represents (in Jordan) the Saharo–Sindian of Zohary (with Vachellia gerardii). White and Léonard suggested that the Saharo–Sindian and Irano–Turanian zones are the two main phytochoria that influence Jordan [7], with each further subdivided subsequently into smaller, Middle East region-specific phytochoria [8], as illustrated in Figure 1.
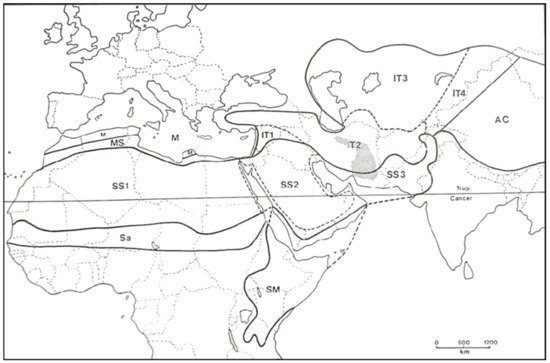
Figure 1. Main phytogeographical regions covering Asia and Africa (Reprinted/adapted from [7]). Regional zones are represented by: SS = Saharo–Sindian, SS1 = Sahara regional subzone, SS2 = Arabian regional subzone, SS3 = Nubo–Sindian local centre of endemism, M = Mediterranean; IT = Irano–Turanian, IT1 = Western Irano–Turanian regional subcentre, IT2 = Southern Irano–Turanian regional subcentre, IT3 = Northern Irano–Turanian regional subcentre, IT4 = Eastern Irano–Turanian regional subcentre, AC = Central Asiatic, Sa = Sahel, SM = Somalia–Masai.
Expanding on the work of Long [9], Al-Eisawi [10] determined that there are nine bioclimatic areas in Jordan, which are categorised into four overarching clusters: Saharan Mediterranean (cool, warm, very warm); arid Mediterranean (cool, warm, very warm); semi-arid Mediterranean (cool, warm); and sub-humid Mediterranean. Later, Al-Eisawi [11] also created a map based on the delineations made by Zohary [3] of the regions of vegetation in the Middle East.
The flora in the region under study is very species rich due to the area being situated at the meeting point of three phytogeographic regions [3][11][12][13][3,11,12,13]. The land changes from Mediterranean maquis and forests to grassland, steppes, and extremely arid desert biomes within a relatively short space. While edaphic influences do have an effect on vegetation, it is the climate that has a greater impact [13]. As well as vegetation being influenced by environmental pressures, human activities also affect the way plants are distributed. Some research has accounted for forestry, agriculture, and grazing potential along with human activity when classifying vegetation [9][14][15][16][9,14,15,16].
The vegetation types of the region have also been mapped. While earlier work (e.g., [3][5][6][3,5,6]) was conducted prior to modern development and experienced fewer restrictions on political boundaries, other modern works were either restricted by political boundaries or the study was conducted across limited borders based on extensive fieldwork [11][14][16][17][11,14,16,17]. The most recent and updated map of vegetation for Jordan was produced by Albert et al. [14]. The map included 19 vegetation types and was primarily based on topography and coarse-resolution satellite images to describe vegetation cover of the country at a scale of 1:1 M. However, no map to date has combined state-of-the-art earth observation approaches with extensive field data to ground-truth remote sensing data.
Remote sensing data have contributed to land cover and vegetation type mapping by applying advanced digital classification techniques to derive both land cover and vegetation types at different spatial resolutions [18]. For vegetation mapping, the outputs from digital classification of remotely sensed data are intensively used to map land cover dynamics [19], floristic diversity, phytogeography [20], and vegetation [21] over large geographic areas. In order to identify and map land cover and vegetation in a continuous manner, remote sensing is vital. Data from sensors such as Landsat, MODIS, Sentinel, SPOT, and ASTER can be obtained cheaply or free of charge, with some providing wide swath-width images (over 290 km).
Vegetation mapping of Jordan is now urgently required so that appropriate and effective planning can be made for managing agriculture, afforestation, and rangeland, and for the degradation of habitats to be reduced. Prior research has been less than ideal for a multitude of reasons; for instance, studies did not utilise satellite imaging, were not comprehensive enough, or did not include field observations to support mapping and definition of the areas under investigation. Further, much of the existing research fails to include data from maps based on land use, geological or meteorological information, vegetation sampling, or GIS methodologies, and often does not utilise herbarium specimens or pictures to identify the species found in each region.
Taking all of the abovementioned points into consideration, it is clear that no study currently exist that describes Jordan’s vegetation in a spatial context for use in mapping or restoring particular kinds of vegetation. This would be extremely useful in the management and conservation of the country’s biodiversity [22].
2. Detailed Analysis
2.1. Land Cover/Land Use Map
The land cover map is the result of the integration of remotely sensed data with thematic features from land cover models. According to this interpretation of satellite images, the map shows 18 classes of land cover (Figure 25, Table 1).
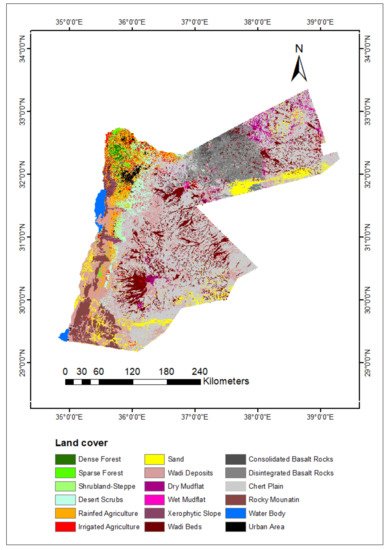
Figure 25.
Land cover/land use map of Jordan produced from the unsupervised classification.
Table 1.
Land cover statistics in Jordan.
| Land Cover Class | Total Km | 2 | Percentage | Total Percentage | |
|---|---|---|---|---|---|
| Forests | Dense Forest | 398.2 | 0.45 | ||
| 14.1 | |||||
Site classification based on Agglomerative Hierarchical Clustering analysis.
Table 2.
Vegetation groups sorted according to the composition of the perennial plants.
| Vegetation Group | Vegetation Type |
|---|---|
| 0.89 | |
| Mesic group | Deciduous Oak Forest |
| Sparse Forest | 394.3 |
| Granite and Sandstone Shrubland |
.
Table 4.
Vegetation types and the bio-geographic region they represent.
| Bio-Geographic Region | Vegetation Type | ||||||||
|---|---|---|---|---|---|---|---|---|---|
| Mediterranean | |||||||||
| 0.44 | |||||||||
| Vegetation map produced by Kasapligil (1956) | Highly productive rangelands | ||||||||
| 47 | Evergreen Oak Forest | Shrubland/Steppe | 1484.0 | 1.66 | Desert Scrubs | 3023.8 | 3.38 | ||
| Pine Forest | 4079.7 | 4.57 | |||||||
| Deciduous Oak Forest | Wadi Beds | ||||||||
| Garrigue and Batha | 8098.0 | 9.06 | |||||||
| Xeric group | Juniper Forest | Acacia Woodland | 1453.7 | 1.63 | Arable lands | Rainfed Agriculture | 3532.4 | 3.95 | 5.39 |
| Acacia Woodland | Irrigated Agriculture | 1289.8 | 1.44 | ||||||
| Steppe Vegetation | Dry lands | Sand | 5114.6 | 5.72 | |||||
| Sand Dune Vegetation | 77.9 | ||||||||
| Evergreen Oak Forest | Wadi Deposits | 15981.4 | 17.89 | ||||||
| Sandy Gravel Hammada Vegetation with | Hammada scoparia | Dry Mudflat | 1667.4 | ||||||
| Sandy Gravel Hammada Vegetation with | 1.87 | ||||||||
| Vachellia gerrardii | and | Artemisia judaica | Wet Mudflat | 342.6 | 0.38 | ||||
| Xerophytic Slope | 1009.4 | 1.13 | |||||||
| Granite and Sandstone Shrubland | Consolidated Basalt Rocks | 691.0 | 0.77 | ||||||
| Mudflat Vegetation | |||||||||
| Runoff Hammada Vegetation | Disintegrated Basalt Rocks | 7261.7 | 8.13 | ||||||
| Chert Plain | 33744.4 | 37.77 | |||||||
| Rocky Mountain | 3788.6 | 4.24 | |||||||
| Others | Water Body | 540.7 | 0.62 | 1.72 | |||||
| Urban Area | 980.0 | 1.1 |
2.2. Vegetation Map
Sixteen groups, or vegetation type classifications, were produced from hierarchical cluster analysis (Figure 36). Sampling sites were grouped together based on the composition of the perennial vegetation present in each site. Two overarching vegetation groups emerged from the cluster analysis (Table 2).
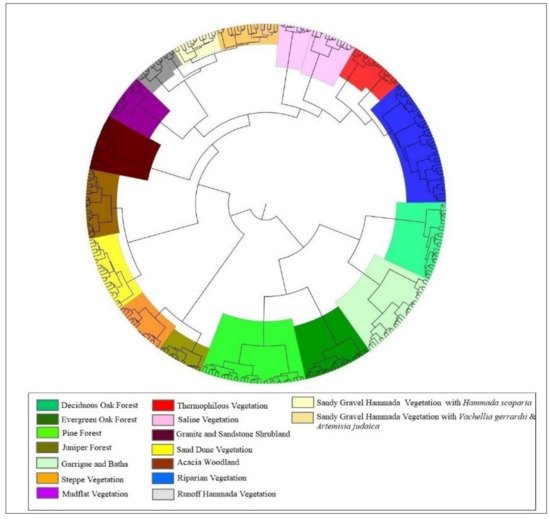
Figure 36.
| Riparian Vegetation |
| Saline Vegetation |
| Thermophilous Vegetation |
From the species composition analysis, 54 indicator species were identified that could then be used to classify species of vegetation. Annual plant species were not included in the cluster analyses, but one vegetation type, specifically Gravel Hammada vegetation, lacks perennials. For this type, annual indicator species were added based on researcher experience and field records.
2.3. Using Remote Sensing to Classify Vegetation Types
Based on the land cover/land use map and as a result of using the supervised classification method in interpreting the satellite images, a current vegetation map was produced at a scale of 1:50,000 that contains 18 vegetation types (Figure 47, Table 3).
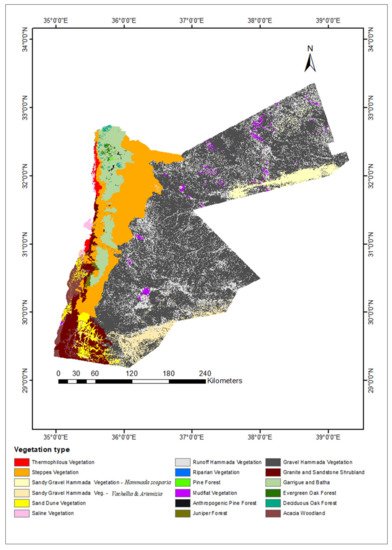
Figure 47.
Vegetation map based on the interpretation of satellite images.
Table 3.
Vegetation map statistics in Jordan.
| Vegetation Type | Total Km | 2 | Percentage (%) | ||||
|---|---|---|---|---|---|---|---|
| Gravel Hammada Vegetation | 45871.9 | 51.34 | |||||
| Sand Dune Vegetation | 1760.7 | 1.97 | |||||
| Steppe Vegetation | |||||||
| 11293.4 | Pine Forest | 12.24 | |||||
| Sandy Gravel Hammada Vegetation with | |||||||
| Hammada scoparia | 2408.5 | 2.70 | |||||
| Low | Sandy Gravel Hammada Vegetation with | Vachellia gerrardii | |||||
| 0.38 | Garrigue and Batha | and | |||||
| Juniper Forest | Artemisia judaica | ||||||
| Riparian Vegetation | 2909.8 | ||||||
| Irano–Turanian | 3.26 | ||||||
| Garrigue and Batha | 4815.2 | 5.39 | |||||
| Weak | |||||||
| Vegetation map produced by Al-Eisawi (1996) | 50 | Moderate | 0.43 | Weak | Runoff Hammada Vegetation | 11677.4 | 13.07 |
| Steppe Vegetation | |||||||
| Vegetation map produced by Danin (1999a) | 59 | Moderate | 0.47 | Weak | |||
| Vegetation map produced by Albert et al. (2003) | 61 | Moderate | Riparian Vegetation | ||||
| 0.55 | Weak | ||||||
| Land cover/land use map | 91 | High | 0.90 | Saharo–Sindian–Arabian regional subzone | Mudflat Vegetation | Mudflat Vegetation | 893.1 |
| Very good | |||||||
| Current vegetation map | 95 | High | 0.94 | Gravel Hammada Vegetation2.00 | |||
| Very good | Saline Vegetation | 392.7 | 0.44 | ||||
| Runoff Hammada Vegetation | Juniper Forest | 191.7 | 0.21 | ||||
| Sandy Gravel Hammada Vegetation with | Hammada scoparia | Deciduous Oak Forest | 156.3 | 0.17 | |||
| Anthropogenic Pine Forest | |||||||
| Saharo–Sindian–Nubo-Sindian subzone | Mudflat Vegetation116.3 | 0.13 | |||||
| Riparian Vegetation | 71.9 | 0.08 | |||||
| Thermophilous Vegetation | 534.3 | 0.60 | |||||
| Pine Forest | 18.3 | 0.02 | |||||
| Evergreen Oak Forest | 156.7 | 0.18 |
Two vegetation types—anthropogenic pine forest and gravel hammada vegetation—were added to the map, although they were not included in the cluster analysis. The reason for this is that there were no perennial indicator species for the gravel hammada vegetation, and there were no unique indicator species that distinguished both the natural and anthropogenic pine forest. According to the interpretations of the satellite images, there are 68 areas in which riparian habitats occur, mostly along tributaries of the Jordan River and Yarmouk River or wadis flowing towards the Dead Sea.
2.4. Phytogeographical Regions
The four main phytochoria are described below, each subdivided into specific Middle Eastern phytochoria that have influence in Jordan: the Mediterranean, Irano–Turanian, Saharo–Sindian–Nubo–Sindian subzone, and the Saharo–Sindian–Arabian regional subzone (Figure 58).
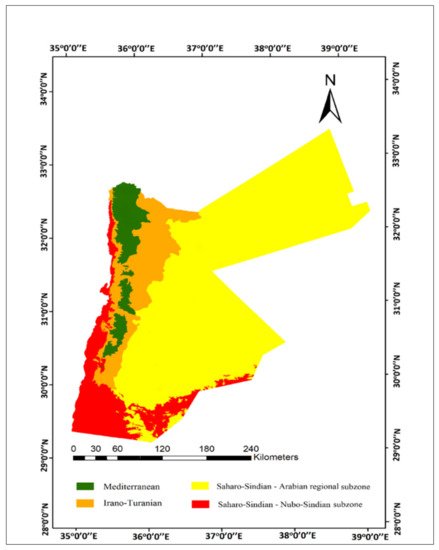
Figure 58.
Phytogeographical regions of Jordan based on the updated vegetation map.
The Mediterranean region is restricted to the Highlands extending from Irbid in the north to Ras An-Naqab in the south, in addition to some isolated representation in the southern mountains. The Irano–Turanian zone separates the Mediterranean from the Saharo–Sindian–Arabian regional subzone on one side, and the Mediterranean from the Saharo–Sindian–Nubo–Sindian subzone on the other side [7]. The Saharo–Sindian–Arabian regional subzone is located at the eastern desert and accounts for the greatest proportion of land cover in Jordan—about 72%. The Saharo–Sindian–Nubo–Sindian subzone penetrates into Jordan, following Red Sea coastal areas, from tropical regions of the Arabian Peninsula and northeast Africa. A summary of each bio-geographic region and their associated vegetation types is presented in Table 4
| Granite and Sandstone Shrubland | ||
| Riparian Vegetation | ||
| Thermophilous Vegetation | ||
| Saline Vegetation | ||
| Sand Dune Vegetation | ||
| Acacia Woodland | ||
| Sandy Gravel Hammada Vegetation with | ||
| Vachellia gerrardii | and | Artemisia judaica |
2.5. Accuracy Assessment of Vegetation Maps
In this researchtudy, four accuracy measures of each typology of the maps were calculated: the user’s accuracy, the producer’s accuracy, the overall accuracy, and the Kappa coefficient. The oese measurements were extracted using the specific confusion matrices listed in Appendix A. The overall accuracy and Kappa coefficient statistics were used to examine the quality of land cover and vegetation maps as a whole. The Kappa coefficient was used to determine the agreement between the map and reality, where 0 = complete disagreement and 1 = complete agreement.
All vegetation maps previously produced by experts and reviewed in this researchtudy were of poor to moderate accuracy, where the confusion matrices showed a diagonal line that illustrates a weak to medium agreement between the layers (land cover layer and ground-truth points). The classification accuracy of these maps indicated by the Kappa index also showed a low classification accuracy. On the other hand, the results of the analysis showed high overall accuracy for both the unsupervised land cover/land use map and the supervised vegetation map. The Kappa index also showed a high agreement for these two produced maps, as the result was more than 80%, indicating very good classification accuracy. Table 5 below summarises the accuracy and Kappa coefficient for all maps.
Table 5.
Accuracy and Kappa coefficient for the vegetation maps.
| Map | Accuracy Assessment (%) | Overall Accuracy | Kappa Coefficient | Classification Accuracy |
|---|---|---|---|---|