Your browser does not fully support modern features. Please upgrade for a smoother experience.
Please note this is a comparison between Version 2 by Dean Liu and Version 1 by Jaime Soler.
The MTG (Methanol to Gasoline) process allows us to transform methanol into hydrocarbons within the range of gasoline boiling points.
- MTG
- HZSM-5
- binder
- fluidized bed reactor
- aromatics
1. Catalyst Characterization
Textural properties of the catalyst and their constituents were examined by N2 adsorption–desorption analysis. In order to find the modifications suffered by the catalysts after the experiments, both the fresh catalysts (before use in reaction), as well as those used, were characterized. It was observed that the BET surface area of the fresh catalysts (210.8–287.9 m2·g−1) decreased with respect to HZSM-5 zeolite (319.9 m2·g−1) because the agglomeration process is carried out with species of smaller specific area than the zeolite. It is worth noting that the BET surface area of the catalysts is higher when referring to the theoretical values calculated considering the proportional contribution of its constituents. This could be explained considering that during the mechanical mixing of the components, colloidal alumina particles (or small zeolite crystals) might exert a broadening effect of the binder layered sheets, thus increasing the surface area of the catalyst. This will be checked later by SEM imaging. On the other hand, the large area offered by alpha-alumina (α-Al2O3) draws special attention. According to Vieira et al.[1], this alumina phase should not have values greater than 20 m2·g−1. Subsequently, an XRD analysis was performed, and it was found that the crystalline pattern was more similar to that of the gamma-alumina phase (γ-Al2O3).
Since the good behavior of HZSM-5 zeolite in the MTG reaction is attributed to the phenomenon of shape selectivity, it is interesting to analyze the microporous properties. The micropore size of the three catalysts and HZSM-5 zeolite remained constant (~2.1 nm). This indicates that the microporous contribution comes uniquely from the zeolite. In addition, the micropore volume of the prepared catalysts, varied proportionally with the HZSM-5 zeolite quantity used in the preparation process. The volume of micropores is also preserved after the catalyst preparation process.
The SiO2/Al2O3 molar ratio obtained for the HZSM-5 zeolite was 29.8 (corresponding to the nominal value). The Al2O3 percentage of the prepared catalysts increased because of the presence of aluminum in the composition of the inert filler, boehmite and bentonite (montmorillonite type clay). Finally, the sodium content (in the form of Na2O) in the third catalyst disappeared, which is the signal that the ion exchange treatment took place.
The XRD technique confirmed the presence of the crystalline phases characteristic of the species that constitute the catalysts, as well as their high crystallinity (good definition of diffractographic peaks).
The morphology and chemical composition of the catalyst constituents were studied using the SEM-EDX technique. Figure 1 shows the appearance of the zeolite HZSM-5 and bentonite.
According to EDX analysis, the SiO2/Al2O3 molar ratio for the HZSM-5 zeolite was 34.9. This value is analogous to that obtained by XRF for the solid as a bulk. This showed that there was no segregation of substances between the bulk and the surface of the particles. Figure 1c shows the laminar structure of the binder. This confirmed the hypothesis stated in the N2 adsorption–desorption analysis section, where a possible phenomenon of delamination of the binder was established.

Figure 1. SEM-EDX analysis of different samples: (a) the HZSM-5 zeolite, (b) the sodium bentonite and (c) zoom of the micrograph (b) where the laminar shape of the clay is show.
2. Fluidized Bed Reactor Tests
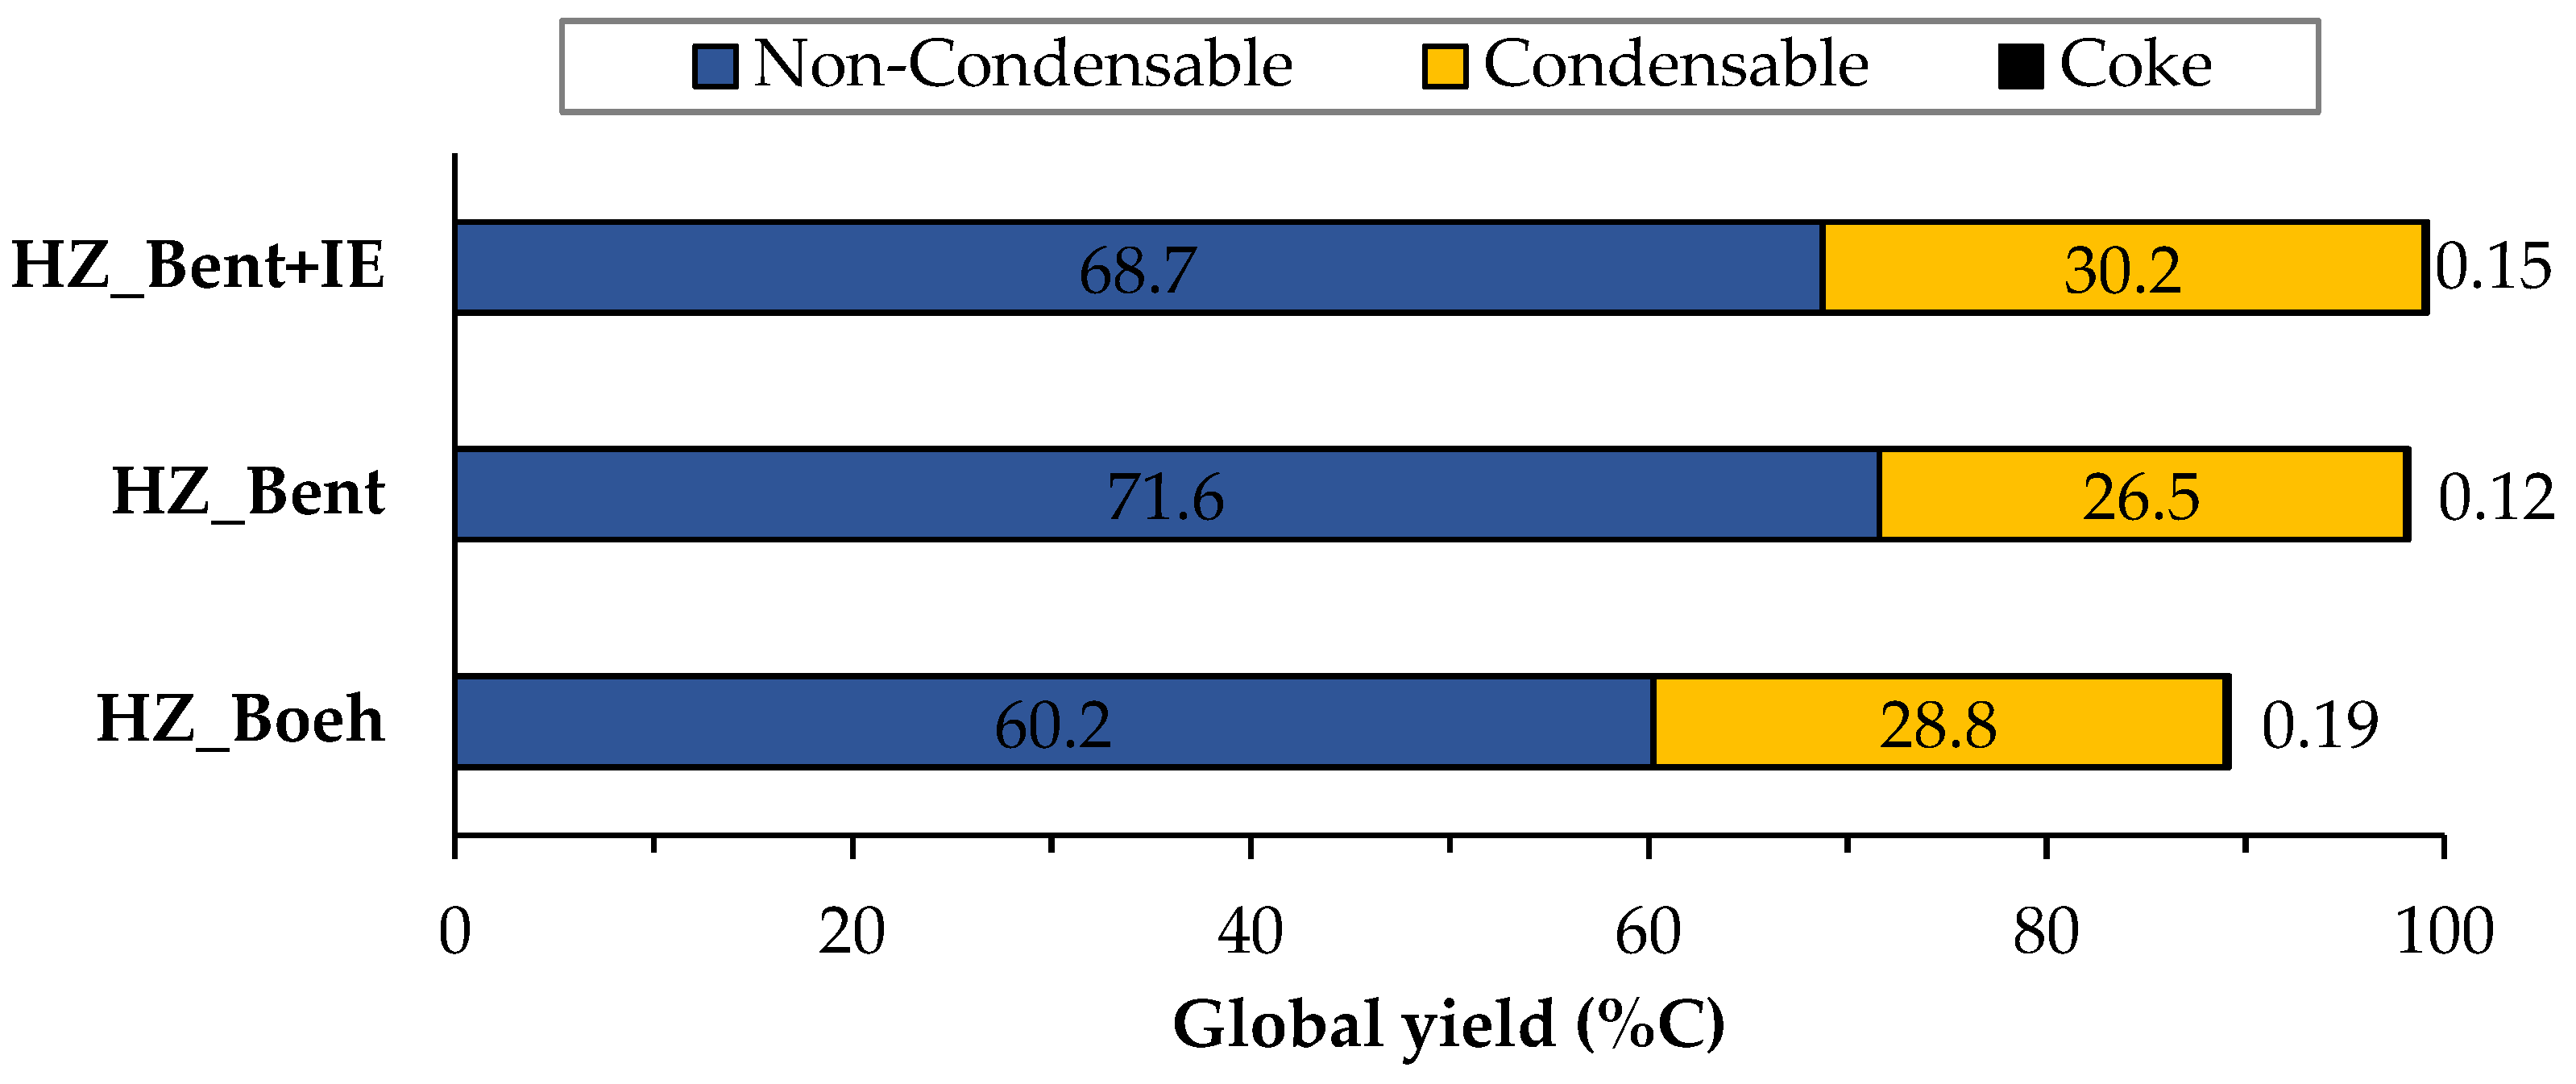
Figure 2 shows the distribution of products of the three catalysts broken down into gas, liquid and solid (coke) phases, calculated as an average of the complete time on stream (TOS) of each experiment (205 min. for the HZ_Boeh and HZ_Bent+IE catalysts and 220 min. for the HZ_Bent). These phases are obtained, respectively, as: non-condensable fraction (light hydrocarbons), condensable fraction (gasoline) and carbon fraction. Coke deposited in the catalyst during the experiment was calculated from the COx gases obtained in its regeneration.

Figure 2. Global distribution of products for the three catalysts. Values calculated as an average of the complete TOS of each experiment. Operating conditions: W/FA0 = 11.3 gcat.·h·molMeOH−1; T = 450 °C.
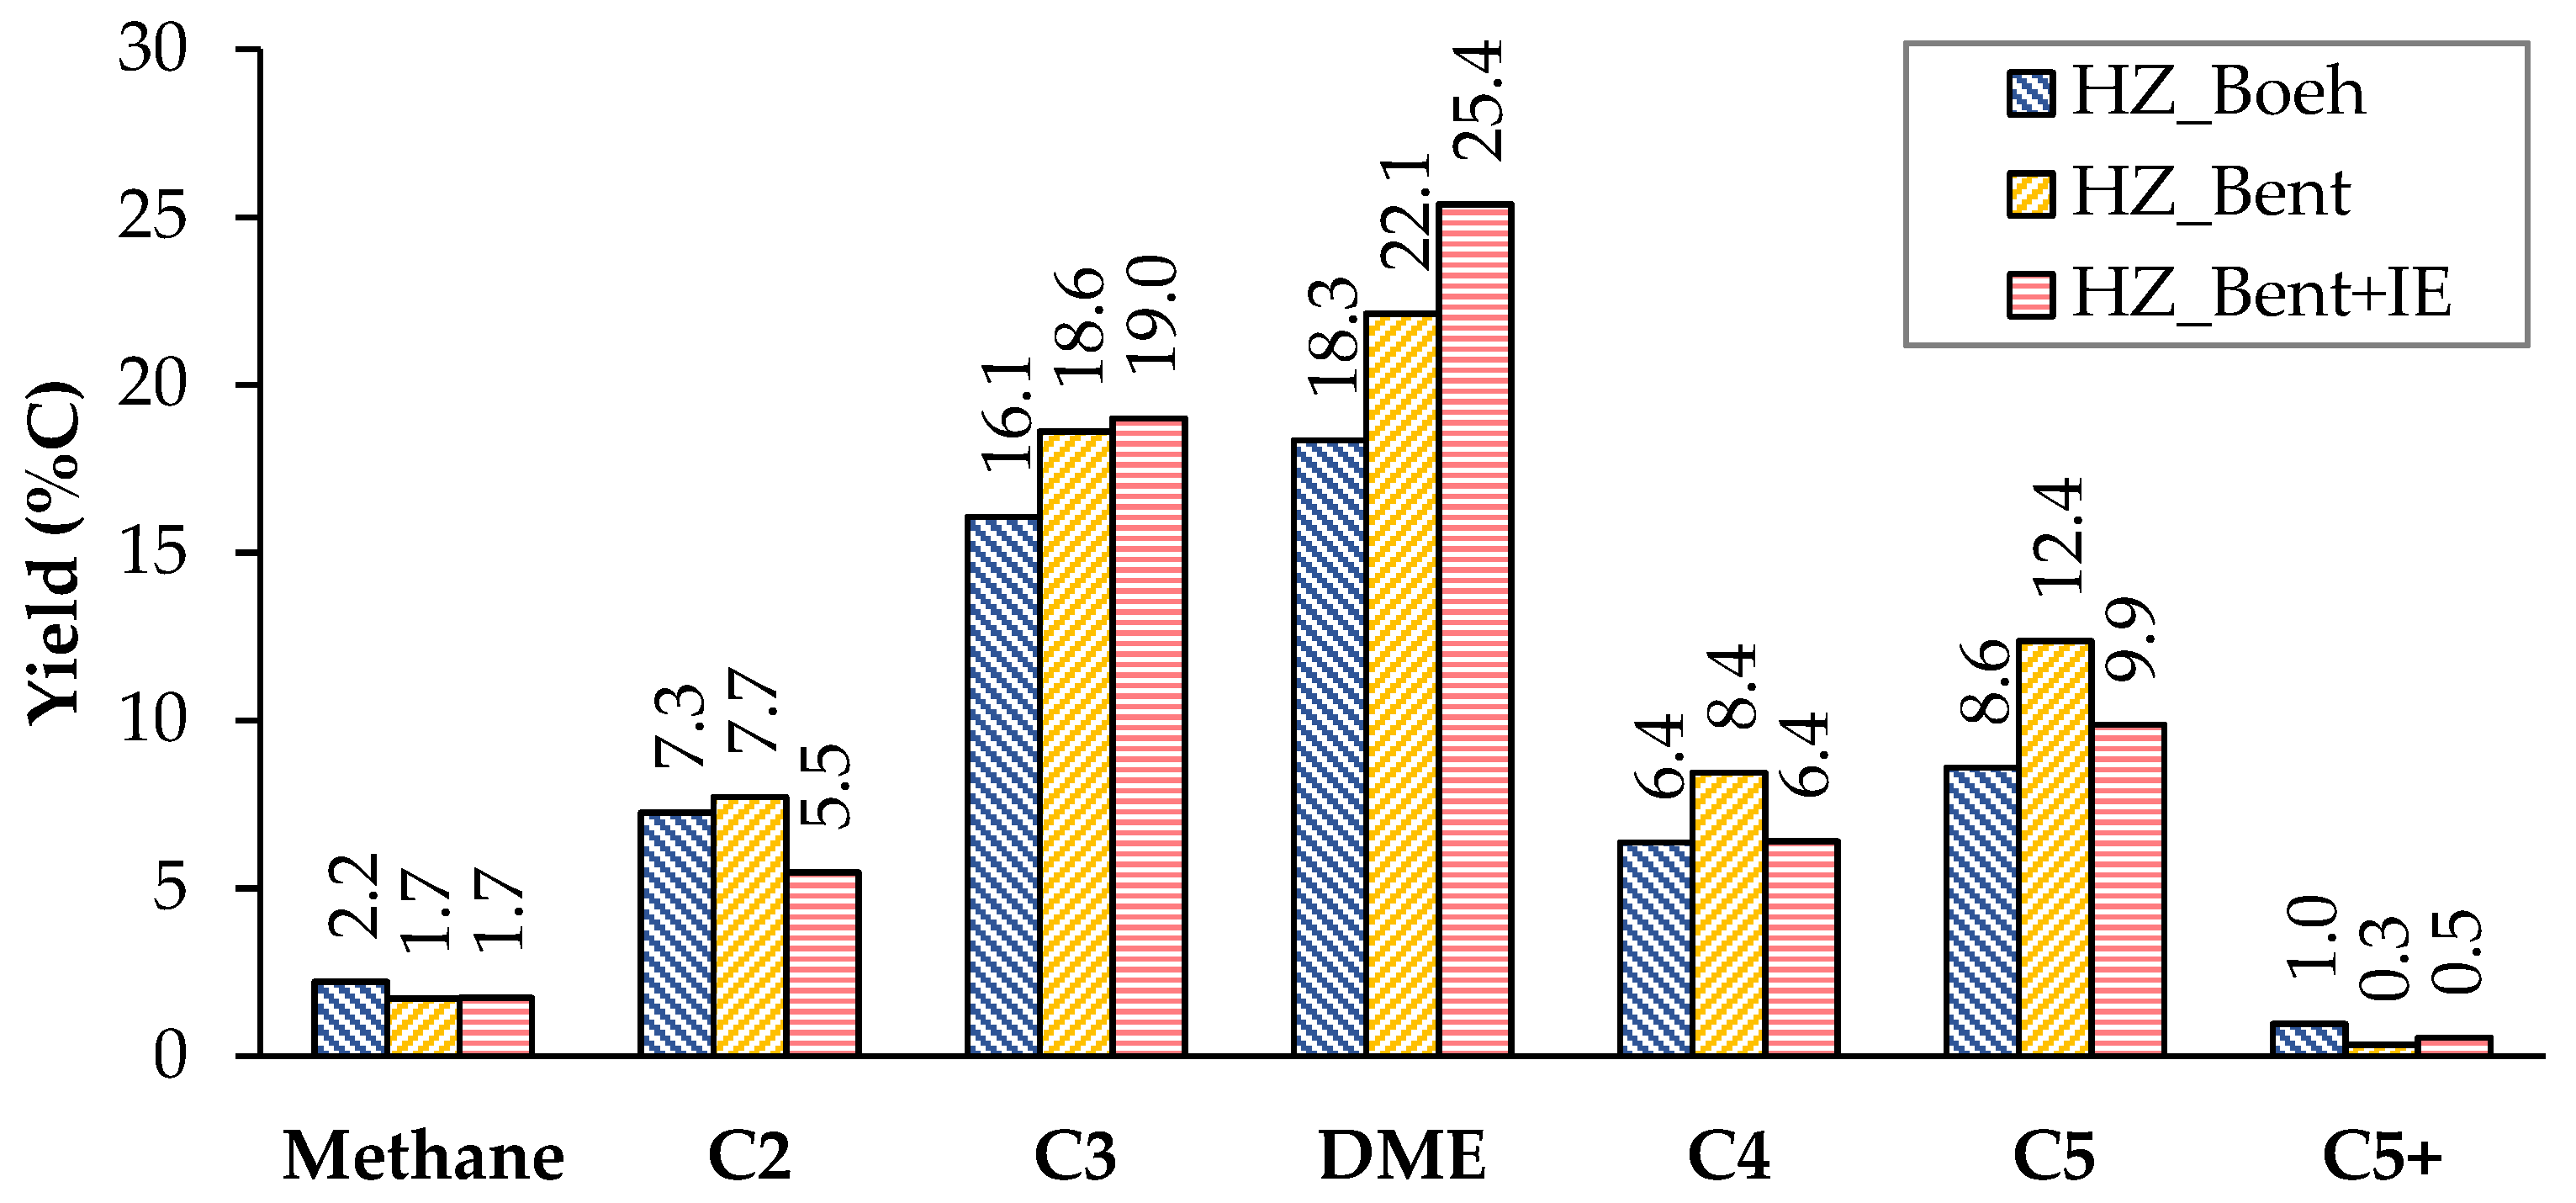
Figure 3 and Figure 4 show the carbon-based yield of the different groups of compounds in the gas and liquid phase, respectively. There is great similarity in the global distribution of products for the three catalysts. All of them have in common that: (i) the yield to light hydrocarbons is higher than that of gasoline, with a maximum production of these being found with the HZ_Bent+IE catalyst and (ii) the yield to coke is very low. Schulz et al.[2] report the formation of an unstable coke with a low molecular weight and a highly hydrogenated nature. This justifies its possible continuous elimination throughout the reaction by stripping. The HZ_Boeh catalyst has the highest coke formation rate, probably due to its higher zeolitic load (50 wt.%, nominal).
Considering the distribution of gaseous products, we give a special mention to dimethyl ether (DME). DME acts as an intermediate product in the process of transforming methanol to light olefins. In the case of bentonite-based catalysts as binders, the yield to DME increases considerably. An explanation is in a bad fluidization of these solids. The cohesive nature of this binder (bentonite) generated an unwanted fluidization state in which the flow rate went from being continuous to a pulse flow rate. It should be noted that this phenomenon was not observed in previous fluid dynamics tests with nitrogen. This resulted in a shorter residence time for methanol and, more importantly, for intermediates produced in the dehydration of methanol such as DME (due to the fact that for all experiments the W/FA0 parameter is high enough to achieve total methanol conversion, even with the possible gas shortcut). Consequently, the yield to DME was higher.

Figure 3. Distribution of products in the gas phase (non-condensable). Values calculated as an average of the complete TOS of each experiment. Operating conditions: W/FA0 = 11.3 gcat.·h·molMeOH−1; T = 450 °C.
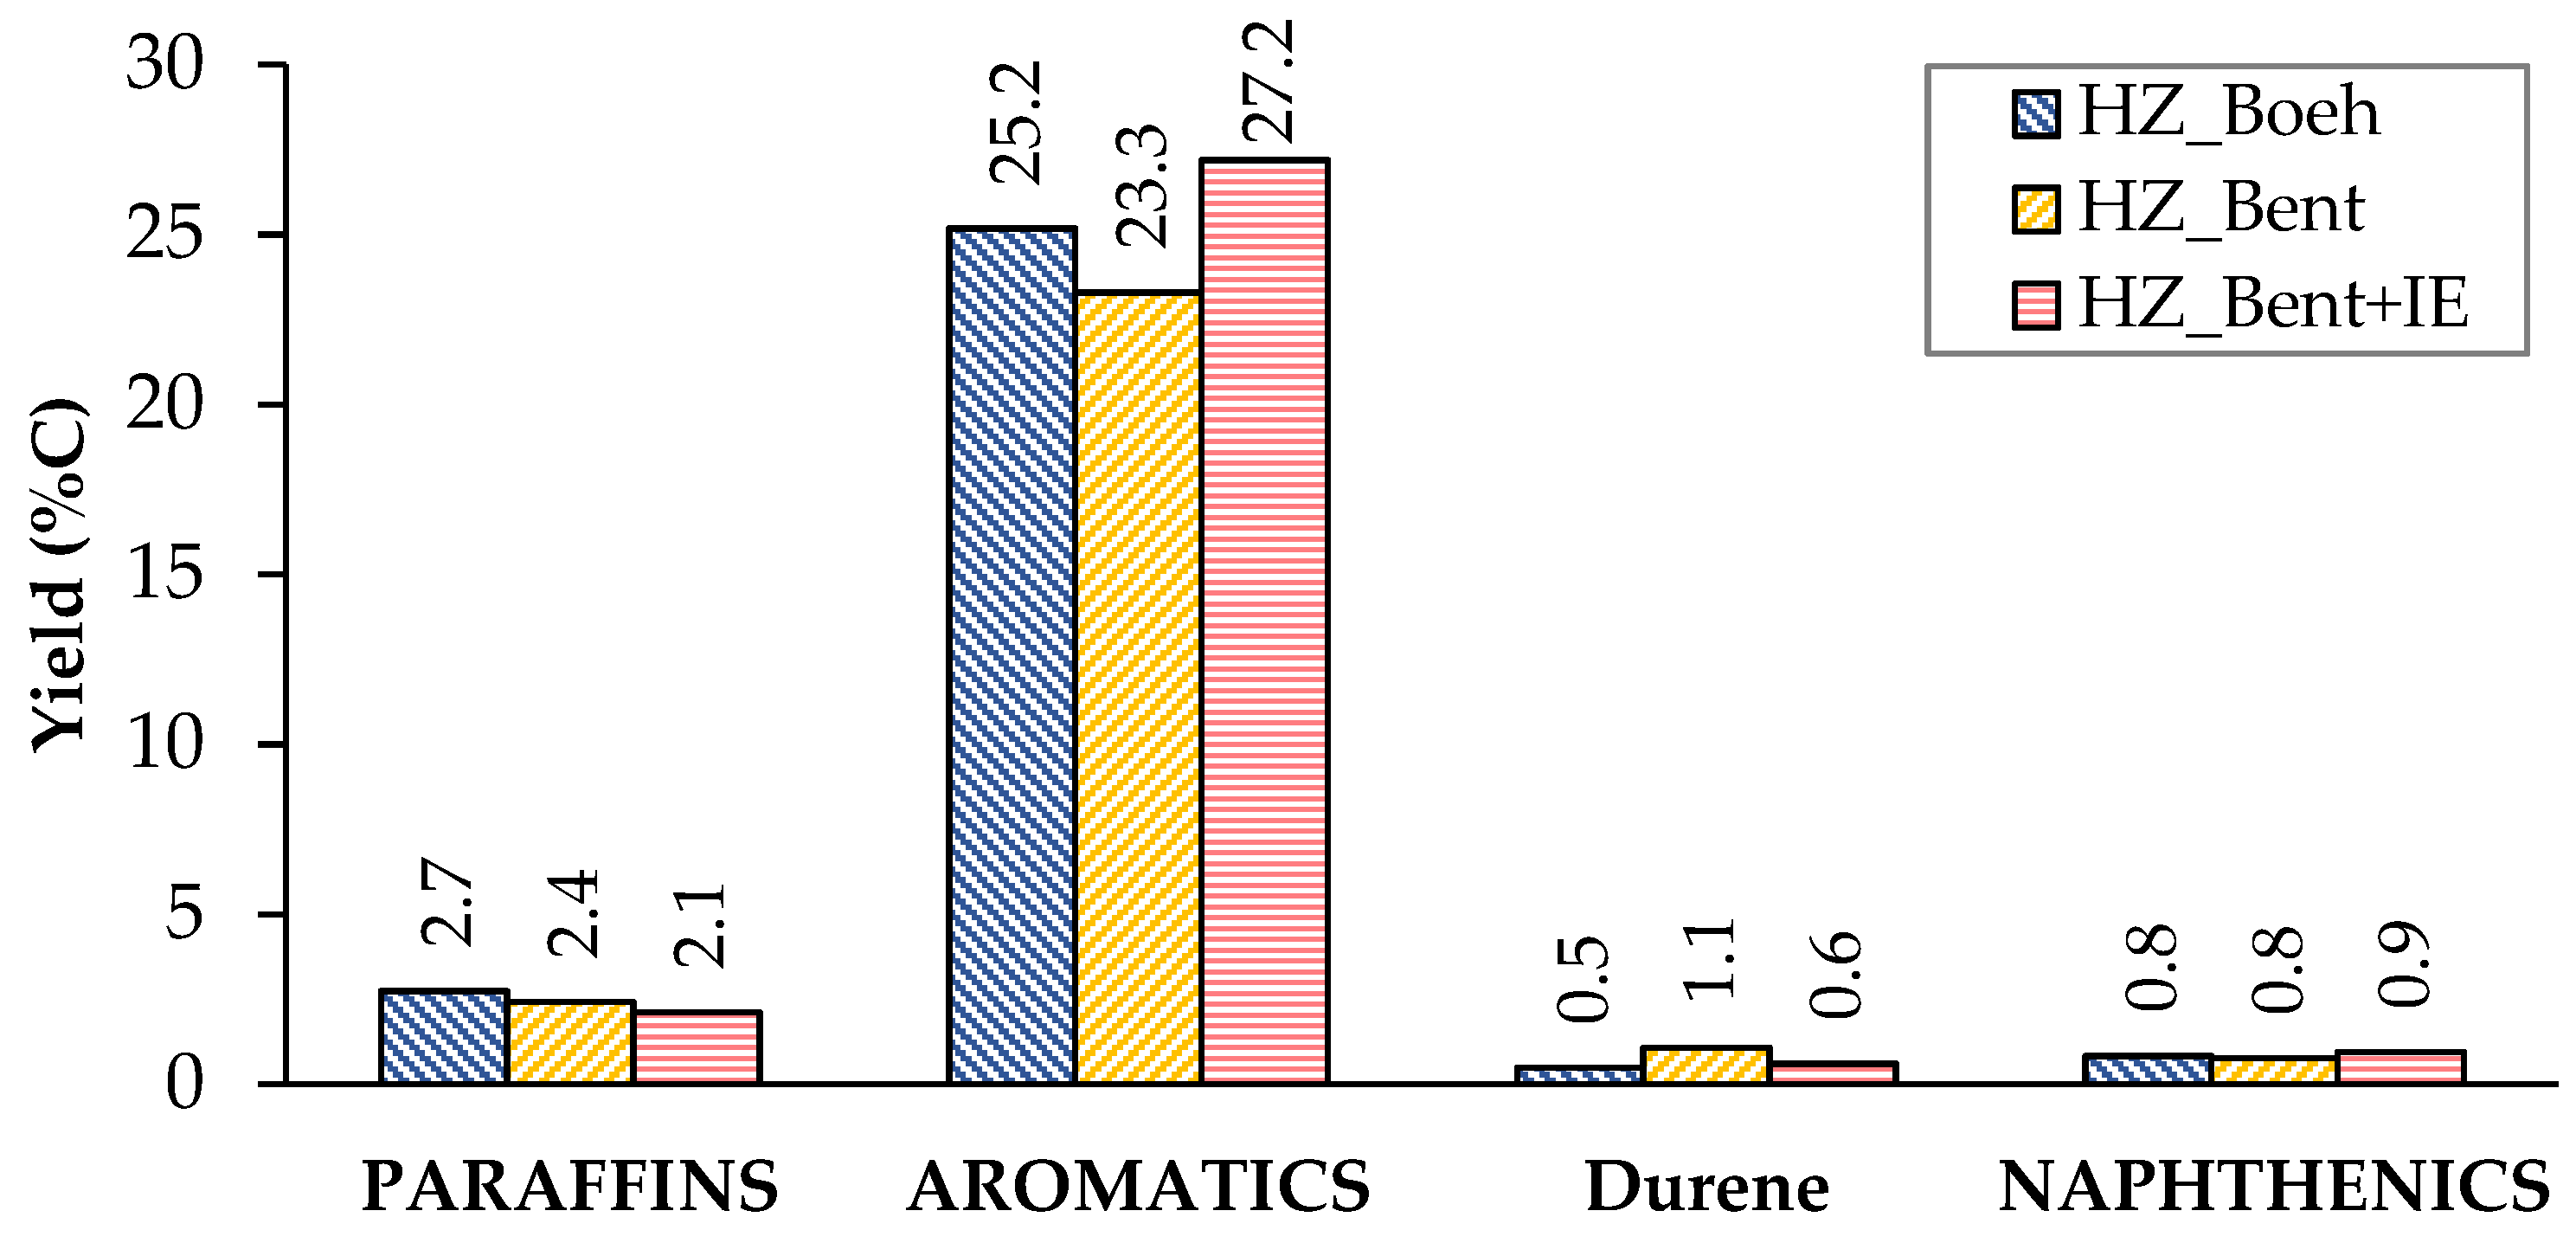
The distribution of liquid products shows a similar yield to the different groups of compounds (paraffins, aromatics and naphthenics) for the three catalysts (Figure 4). Aromatics represent the major contribution, with p-xylene as the most abundant. This high proportion of aromatics is consistent with the characteristics of the gasoline obtained by MTG using zeolitic catalysts. A priori, this should not be a problem, since they are usually species that have a good octane index. On the contrary, durene(1,2,4,5-tetramethylbenzene) is an aromatic hydrocarbon that, due to its high melting point (80 °C), can cause problems of fluidity in gasoline when present in a high concentration. The company Exxon Mobil determined a limit value of 2% durene in the gasoline for use in vehicles[3]. Among the three catalysts, the lowest yield to durene was obtained with HZ_Boeh.

Figure 4. Distribution of products in the liquid phase (condensable). Values calculated as an average of the complete TOS of each experiment. Operating conditions: W/FA0 = 11.3 gcat.·h·molMeOH−1; T = 450 °C.
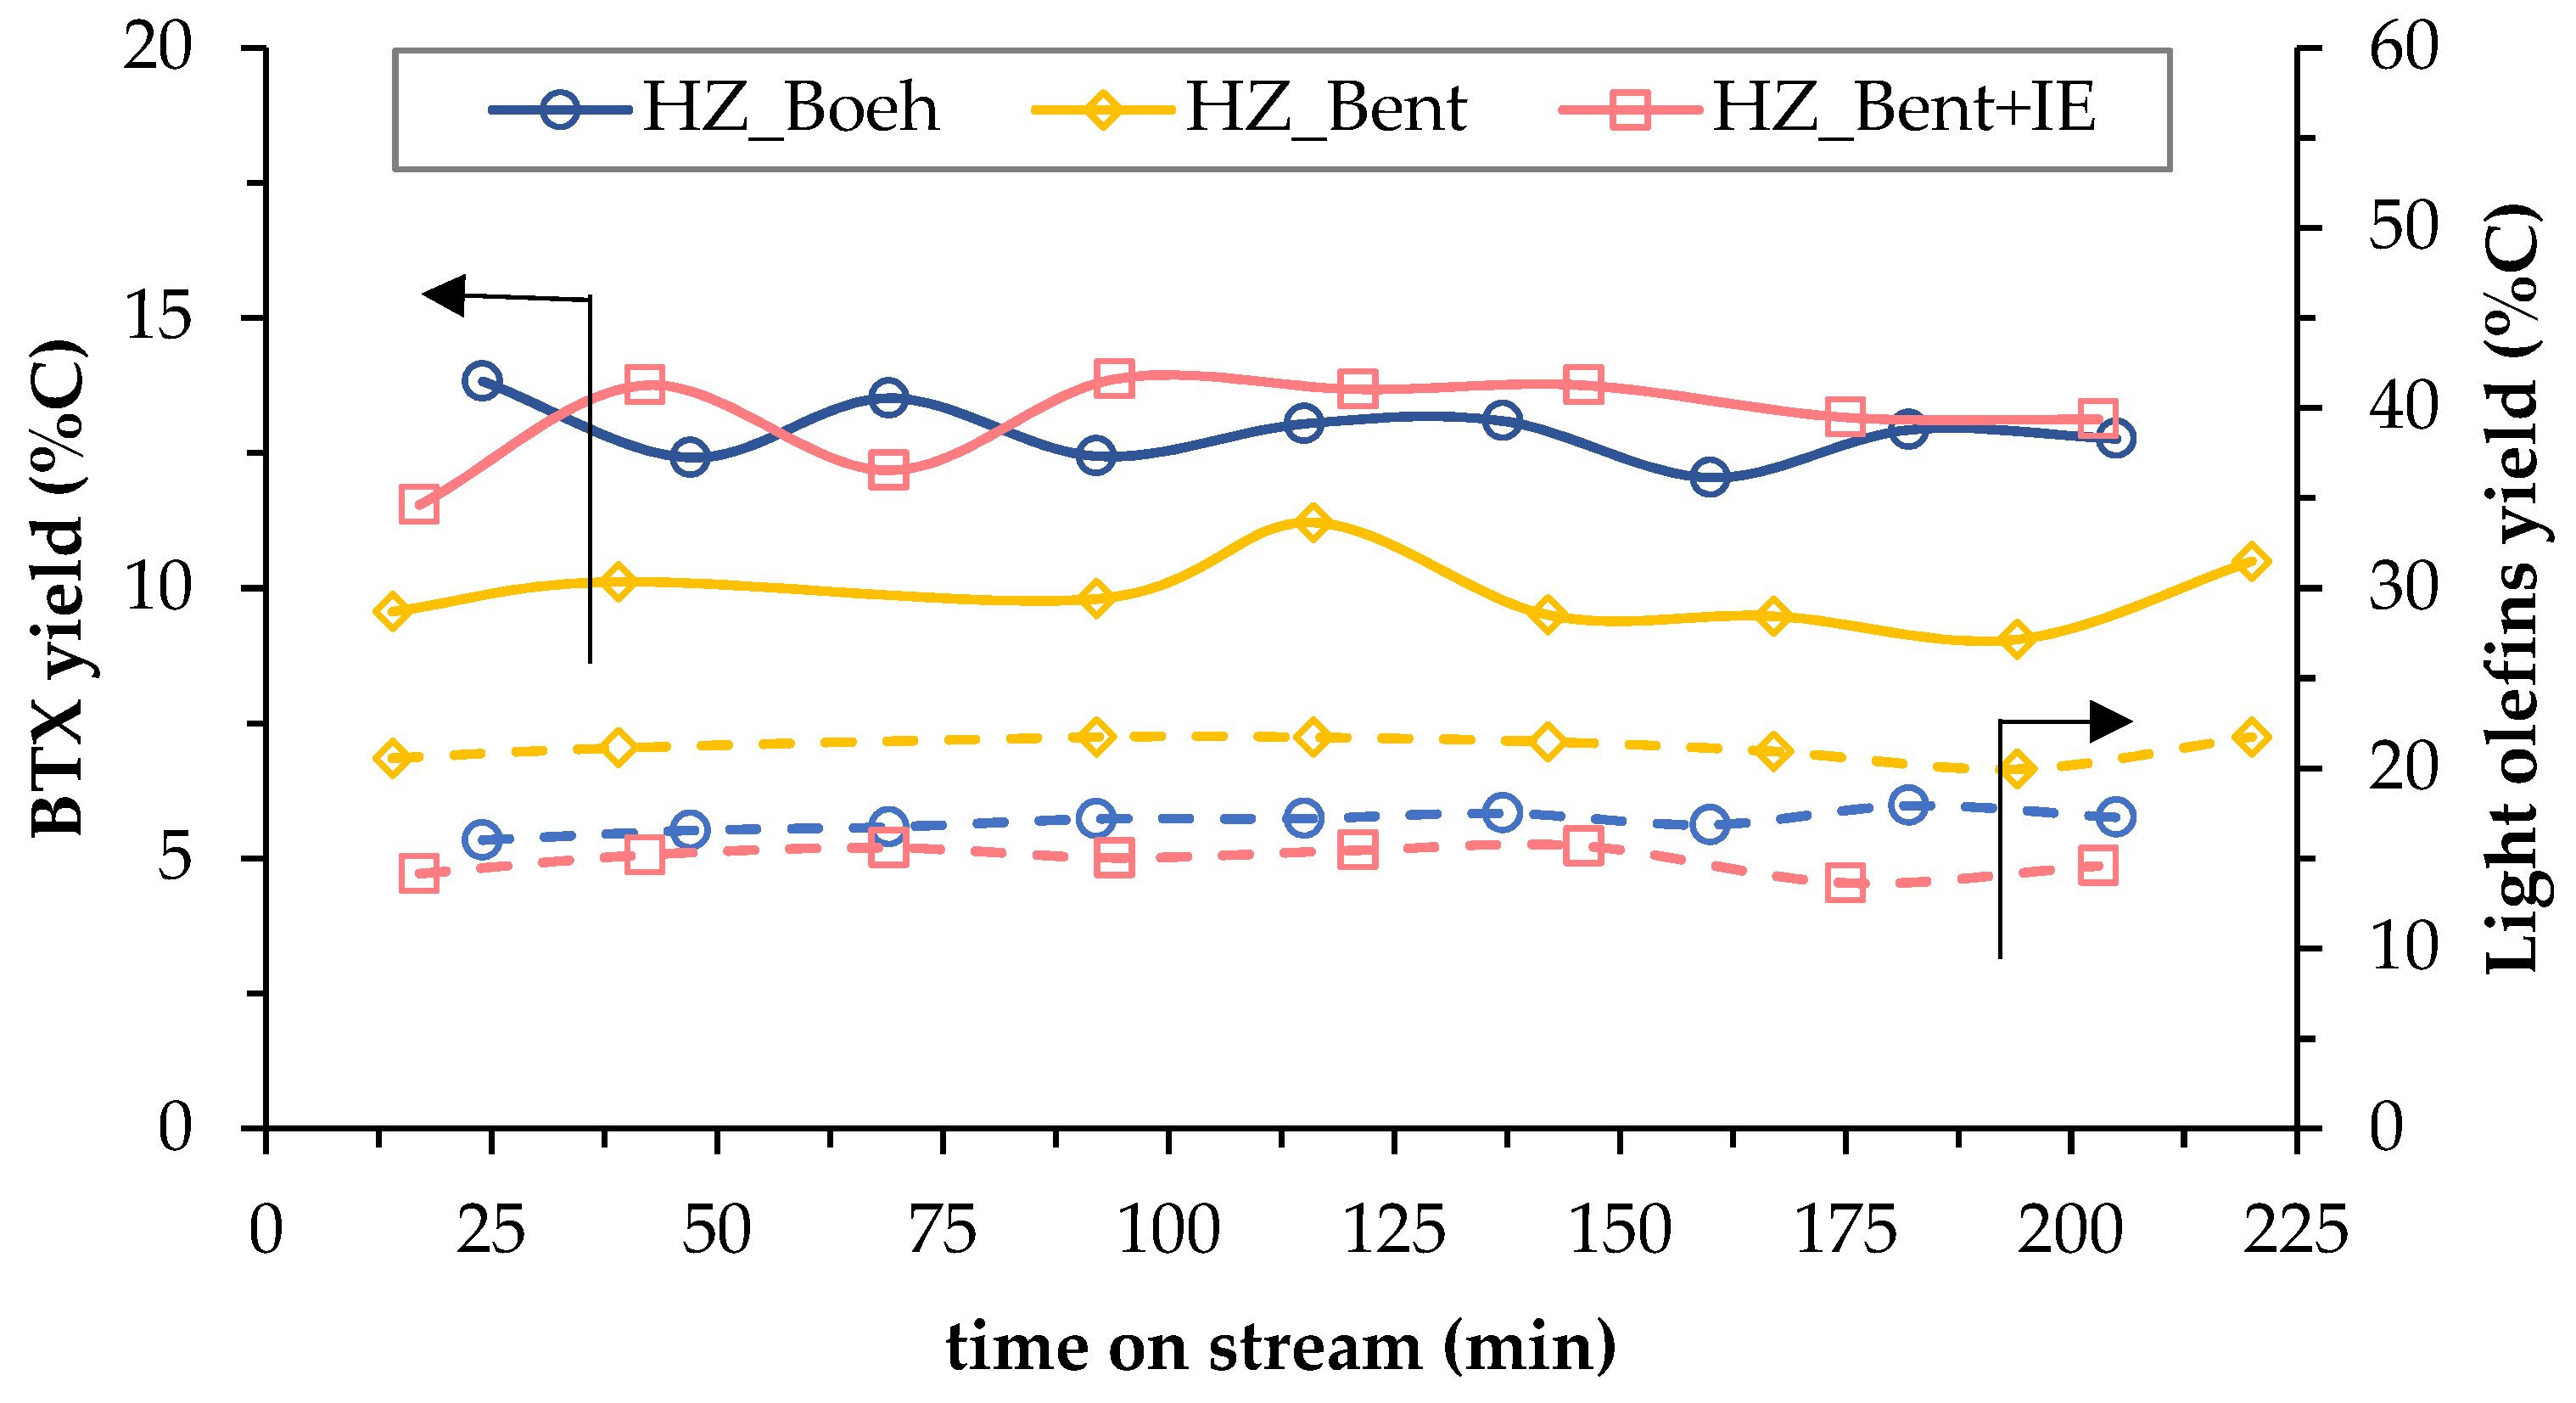
The stability of the process is analyzed in Figure 5. It shows the effect of TOS on the yield to BTX (which refers to a mixture of benzene, toluene and p-Xylene) and light olefins (ethylene and propylene), both as hydrocarbons more representative of liquid and gaseous products, respectively. There is no clear phenomenon of catalyst deactivation in any of the three cases, since both yields (BTX and light olefins) do not decrease with the TOS (220 min). This effect, together with the low rate of coke formation, concludes that the deactivation of the catalysts, although it may occur, is not appreciable in these experiments due to the large catalyst mass in the bed (15.1 ± 0.5 g). It should be noted that only the formation of coke has been considered as a cause of deactivation[4].

Figure 5. Temporal evolution of carbon-based yield to BTX (solid lines) and light olefins (dashed lines) for the three catalysts.
The criteria for selecting the most appropriate catalyst were based on the one with the best fluidization, the lowest yield to durene (limited hydrocarbon in commercial gasolines) and the highest ratio of ‘liquid yield versus light hydrocarbons yield’. Thus, the HZ_Boeh catalyst was selected for subsequent experiments using a TZFBR configuration. Although this catalyst showed the highest yield to coke, this is not a problem since in this reactor (TZFBR), the deactivation of the catalyst can be counteracted.
References
- Vieira Coelho, A.C.; Rocha, G.A.; Souza Santos, P.; Souza Santos, H.; Kiyohara, P.K.; . Specific surface area and structures of aluminas from fibrillary pseudoboehmite. Matéria 2008, 13, 329, 10.1590/S1517-70762008000200011.
- Schulz, H.; Lau, K.; Claeys, M.; Kinetic regimes of zeolite deactivation and reanimation. Appl. Catal. A Gen. 1995, 132, 29, 10.1016/0926-860X(95)00128-X.
- Fitch, F.; Lee, W.; Methanol-to-Gasoline, An Alternative Route to High Quality Gasoline. SAE Trans. 1981, 90, 4193, 10.4271/811403.
- Benito, P.L.; Aguayo, T.; Gayubo, A.G.; Bilbao, J.; Catalyst Equilibration for Transformation of Methanol into Hydrocarbons by Reaction−Regeneration Cycles. Ind. Eng. Chem. Res. 2016, 35, 2177, 10.1021/ie950493u.
More
