Your browser does not fully support modern features. Please upgrade for a smoother experience.
Please note this is a comparison between Version 1 by Pradeep R. Varadwaj and Version 2 by Vivi Li.
The phosphorus bond in chemical systems, which is an inter- or intramolecular noncovalent interaction, occurs when there is evidence of a net attractive interaction between an electrophilic region associated with a covalently or coordinately bonded phosphorus atom in a molecular entity and a nucleophile in another, or the same, molecular entity. It is the second member of the family of pnictogen bonds, formed by the second member of the pnictogen family of the periodic table.
- pnictogen bonding
- phosphorus as a pnictogen bond donor
- σ- and π-hole interactions
- bonding modes
- sum of the van der Waals radii concept
- geometry analysis
- MESP analysis
- IGM-δg analysis
1. Introduction
Noncovalent interactions are one of the chemical interactions (or chemical synthons) that have been explored for some time [1][2][1,2] and continue to be elucidated [3][4][3,4]. They are yet to be fully understood because their behavior is variable from system to system [5]. The variety of these interactions is a consequence of the variability of the nature of the electron density donor and acceptor participating in the molecular assembly and therefore depends on factors such as the local geometry (bond distance and intermolecular approach angle) and the electron density profile of the interacting atomic basins. Since acid–base interactions are central to chemical reactions [6], recognition processes [7][8][7,8], bond functionalization [9], catalysis [10][11][12][10,11,12], and self-assembly [13][14][15][13,14,15], a fundamental understanding and exploration of these interactions has been one of the key issues in the rapid development of research areas such as computational chemistry [16][17][18][19][16,17,18,19], crystallography [5][20][5,20], and crystal engineering [21][22][21,22].
Noncovalent interactions show up in different flavors, including, for example, hydrogen bonding [23], halogen bonding [24], tetrel bonding [25][26][27][25,26,27], chalcogen bonding [28], pnictogen bonding [29][30][31][32][29,30,31,32], aerogen bonding [33], van der Waals interactions [34], and several others [35]. They are the result of attractive engagements between sites of unequal charge density and are often identified to be of Coulombic origin (a positive site attracting a negative one). Anti-electrostatic noncovalent interactions have been characterized recently [36][37][36,37]. Depending on the nature of the interacting units responsible for a molecular complex system, the extent of energy contributions due to repulsion (Pauli and electrostatic, resulting from like charges) acts against orbital interactions, polarization, and dispersion as attractive forces [36]. However, the overall stability of a system is a delicate balance between all of them, in which the overall attractive contribution to the binding energy dominates.
This overview is focused on exploring the nature of the geometric modes of pnictogen bonding, manifest in some crystals and known since the latter half of the last century but explored in greater detail more recently [38][39][40][41][42][43][38,39,40,41,42,43], addressing only phosphorus-centered pnictogen bonding (or simply, phosphorus bonding). Phosphorus, P, the second element of the pnictogen family, Group 15 of the periodic table, has an electronegativity of 2.19 on the Pauling scale, which is appreciably smaller than that of N (3.04). The most commonly observed (formal) oxidation state of phosphorus in molecules and crystals is +3 and +5, although a variety of oxidation states, from −3 to 4, are known [44]. It forms compounds with coordination numbers from 1 (as in P2) to 9 (as in Ti3P) [44]. Consequently, a large number of chemical systems with various oxidation states and stereochemistry are known, and the rich chemistry of P has found a wide range of uses and applications for its compounds. Here reswearchers demonstrate and summarize the evidence that phosphorus in molecular entities, utilizing its electrophilic character, has the ability to make attractive engagements with negative sites to form crystalline materials.
The phosphorus bond in chemical systems, which is an inter- or intramolecular noncovalent interaction, can be identified when there is evidence of a net attractive interaction between an electrophilic region associated with a covalently or coordinately bonded phosphorus atom in a molecular entity and a nucleophile in another, or the same, molecular entity. It is the second member of the family of pnictogen bonds, formed by the second member of the pnictogen family of the periodic table.
2. Illustrative Crystalline Systems
2.1. Polymorphs of Phosphorus
The group 15 elements have already started to play a role in the development of 2D semiconductor materials, including phosphorene, arsenene, antimonene, and nitrogene [45][81]. The terminology used for these monolayered materials is by analogy with graphene. Probably the most popular phosphorus-containing semiconducting systems (single-layered and bulk phosphorus allotropes) are single-layered Hittorf’s phosphorus, Hittorfene; black phosphorus, black phosphorene; and A7 phosphorene [46][82]. The monolayer of novel γ-phosphorus nitride (γ-PN) was shown to be a candidate for a visible-light-driven, water-splitting photocatalyst, with an indirect bandgap transition energy of 2.85 eV, based on DFT calculations [47][83]. Similarly, 2D black phosphorus (a puckered material) is among the family of 2D and layered materials that have distinctive crystalline symmetries and exhibit various properties, such as high carrier mobility, strong infrared responsivity, widely tunable bandgap, in-plane anisotropy, and spontaneous electric polarization [48][84].
The chemical bonding holding the monolayers together in these 2D materials is often assumed to be a consequence of van der Waals forces, which are dispersive by nature. One such instance of the layered (A7) rhombohedral structure of phosphorus (space group R-3m), in which each P site in a given monolayer is bonded to three P sites in a neighboring nearest monolayer, is illustrated in Figure 1a.
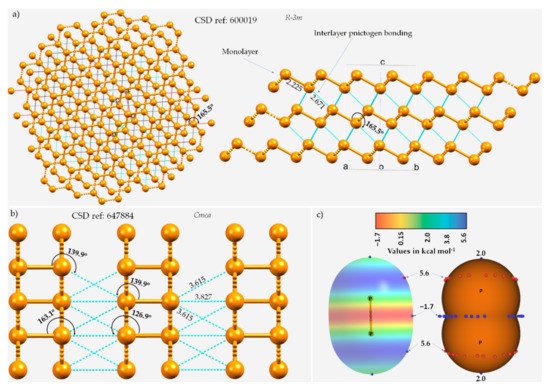

Figure 1. The ball-and-stick mode of the structure of (a) A7 rhombohedral 0.19(P31)n crystal of phosphorus and (b) orthorhombic black phosphorus, showing interlayer P···P type pnictogen bonded interactions. ICSD references and space groups for each are shown. Selected bond lengths and bond angles are in Å and degrees, respectively. (c) The MP2(full)/aug-cc-pVTZ level 0.001 a.u. isodensity envelope mapped electrostatic potential surface of an isolated P2 molecule. The tiny red and blue circles in (c) represent the local maxima and local minima of electrostatic potential (VS,max and VS,min, respectively). Dotted lines in cyan represent an interaction between a pair of P atoms, and those in red, as in (a), represent hanging contacts. The quantum theory of atoms in molecules (QTAIM)-based molecular graphs are superimposed in (c), and the bond paths are in atom color, accompanied by bond critical points (tiny sphere in green). The phosphorus atoms in (a,b) are colored orange.
The three P···P intermolecular distances responsible for the interfacial region in the crystal are all equivalent, with r(P···P) = 2.671 Å and P–P···P = 165.5°, and appear slightly off the extension of the P–P covalent bonds (r(P–P) = 2.225 Å). In the case of black phosphorus, the P···P intermolecular distances between P sites of neighboring monolayers are 3.827 and 3.615 Å and are associated with ∠P–P···P contact angles of 163.1 and 139.9°, respectively (Figure 1b), indicative of the occurrence of Type-III and Type-I topologies of phosphorus-centered pnictogen bonding, respectively, in the crystal.
The quasilinear directional bonding features in both the crystals above may be explained using the MESP model of an isolated P2 molecule shown in Figure 1c. As can be seen, the surface of the P atom in P2 has district regions of different potential; the first is around and the second is along the P≡P bond extensions. The first region is beltlike and features several local maxima of potential (VS,max ≈ 5.6 kcal mol−1) that are more positive than the localized region along the P≡P bond extension (VS,max = 2.0 kcal mol−1). The central bonding region is equipped with a belt of negative potential, with VS,min ≈ –1.7 kcal mol−1. Clearly, there is no σ-hole observed on P along the P≡P bond extension (and this is also expected in the case of N2). There are two local minima (but not local maxima) on the outer surfaces of the two P atoms along the P≡P bond extension that are probably the result of a buildup of relatively large charge density compared to the lateral sides of the same atoms. As such, the quasilinear nature of the P···P interlayer contacts shown in Figure 1a emerges because of the attraction between a pair of P sites that feature, although both positive, dissimilar charge density. In other words, these are the result of attraction between the regions on interacting P atoms described by the local minimum and maximum of potentials, which could be regarded as lump–hole interactions [49][85].
The crystal structure of violet phosphorus (Hittorfene) has been reported recently [50][86]. This layered, 2D semiconducting phosphorus allotrope (monoclinic space group) has an optical band gap of 1.7 eV. It undergoes thermal deposition at 52 °C, which is higher than the decomposition temperature of black phosphorus. The nature of P···P bonding in Hittorfene is very different from that observed in black phosphorus. One of the crucial features of Hittorfene is that each layer is bonded to the nearest layer by a number of P···P contacts with a variety of bond distances between them (Figure 2a). The contacts are strongly directional (∠P–P···P between 176 and 179°). There are also intralayer P···P contacts; they are markedly shorter than the interlayer contacts and are directional. They are all less than twice the vdW radius of P, 3.80 Å, and hence can be regarded as phosphorus bonds.
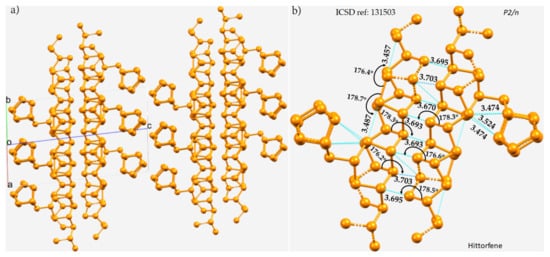

Figure 2. (a) The 2 × 2 × 2 supercell structure of Hittorfene (violet phosphorus). (b) The nature of P···P bonding interactions between the layers, and within the same layer, of the crystal. Selected bond distances and bond angles are in Å and degrees, respectively. Dotted lines in cyan represent an interaction between a pair of P atoms. P atoms in the ball-and-stick models are colored orange.
There are also a large number of phosphorus-containing crystal structures deposited in the CSD and ICSD databases. Many have been known for some considerable time, including, for example, (P2)n, ICSD ref. 647884 [51][87]; PCl4, ICSD ref. 26594 [52][88]; PCl5, ICSD ref. 26661 [53][89] and ICSD ref. 29124 [54][90]; PBr5, ICSD ref. 15559 [55][91]; P4S3, ICSD ref. 16711 [56][92]; P4S5, ICSD ref. 16681 [57][93]; P4S7, ICSD ref. 23842, and P4S10, ICSD ref. 174008 [58][94]; I2P4S3, ICSD ref. 26485 [59][95]; and P(CN)3, ICSD ref. 16587 [60][96]. In these systems, the covalently bonded phosphorus in a given molecular entity interacts attractively with the Lewis base in partner molecule(s), thus forming phosphorus-centered pnictogen bonding and contributing to the structure of the crystals.
What follows is a description of a number of crystal systems wherein chemical bonding involving phosphorus bonds plays a structure-determining role. For many of them, rwesearchers examined their MESP to provide insight into their Lewis acid behavior necessary for the formation of an acid–base interaction. Isolated chemical systems could serve as examples of phosphorus bonding. Chandra and coworkers [61][97], and others [62][98], have reported such chemical systems expounded from studies of isolated entities. They showed that phosphorus can serve as an acceptor of electron density from the π electron cloud in partner molecules. In particular, they have shown that the P···π phosphorus bonding interactions are responsible for the stability of the PCl3–C2H2 and PCl3–C2H4 heterodimers and similar trimers and tetramers generated during low-temperature measurements. The dominance of phosphorus bonding in the PCl3–C2H2 and PCl3–C2H4 heterodimers over other interactions (such as H···π, H···Cl, H···P, Cl···π, and lone pair–π interactions) was also discussed.
2.2. Phosphorus Trihalides
Phosphorus trihalides, PX3 (X = F, Cl, Br, I), are probably the simplest tetra-atomic molecular systems that can be used to arrive at an understanding of phosphorus-centered pnictogen bonding in crystals. The ωB97XD/Jorge-ATZP computed MESP plots for PX3 (X = F, Cl, Br, I) are compared in Figure 3. Except for F in PF3 (Figure 3a), the halogen derivative X has a charge density depletion region on the outer extensions of the P–X covalent bond that increases as the electronegativity decreases in the series from Cl through Br to I. Associated with these depleted charge density regions are σ-holes on the halogen derivatives, whose strength increases in the opposite order: P–Cl (10.0 kcal mol−1) < P–Br (16.1 kcal mol−1) < P–I (17.0 kcal mol−1), concordant with an increase in the polarizability of X. The apparent absence of a σ-hole on F in PF3 is not unexpected and has been observed in other chloro- and fluorinated compounds [63][64][65][66][60,61,62,99].
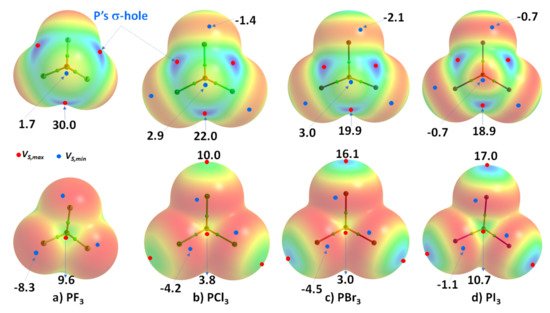

Figure 3. Comparison of ωB97XD/Jorge-ATZP calculated 0.001 a.u. isodensity envelope mapped potential on the electrostatic surfaces of PX3 (X = (a) F, (b) Cl, (c) Br, (d) I) molecules. Selected tiny circles in red and blue describing VS,max and VS,min values in kcal mol−1 are shown, which are the local maxima and minima of potential, respectively. Two views of each MESP graph are displayed for each molecule. Top: coordinated P faces the reader. Bottom: the three X atoms forming a triangular architecture face the reader. The QTAIM-based molecular graphs are superimposed on each case, and the bond paths are in atom color, accompanied by bond critical points (tiny sphere in green).
On the other hand, the strength of the σ-hole on P decreases as X proceeds from F down to I and so is most stable along the outermost X–P bond extensions when X = F. This is expected given that F is the most electronegative and least polarizable of the halogens. It therefore has a very high ability to pull electron density on P towards the bonding region in the P–F bonds, thus leaving a strongly positive potential on the surface of covalently bonded P.
RWesearchers observe that the σ-hole regions on covalently bonded X are more positive than the lateral portions in PX3. The latter is described by a belt of negative potential. Except for PF3, the belt is not equipotential as can be inferred from the color of the belt. For example, the potential around the lateral site shown in the top view of Figure 3b–d is colored orange (VS,min roughly −1.4 kcal mol−1 for PCl3), and that shown in the bottom view is colored red (VS,min ~ −8.3 kcal mol−1 for PCl3). The P site in PX3 (X = F, Cl, Br, with I being the exception) is entirely positive (i.e., both VS,max > 0 and VS,min > 0). These results suggest that the lateral and axial sides, respectively, of halogen derivatives in a given PX3 molecule might be capable of making an attractive engagement with the axial and lateral sites, respectively, of another molecule of the same type to form X3P···PX3 complexes, as rwesearchers point out below.
While the (arbitrary) use of the 0.001 a.u. isodensity envelope is often recommended for computing electrostatic potential [67][68][100,101], it may not always be appropriate [63][64][65][60,61,62]. Its use in the present case, for instance, suggested that VS,max is neutral on the extensions of the three P–F bonds in PF3. Moreover, it is expected that the region dominated by the lone pairs on F, located around the lateral sites of the P–F bond, should be accompanied by at least three critical points of potential, VS,min. However, ouresearchers' calculation gave a single local minimum of potential on each F, with VS,min of –8.3 kcal mol−1, and a positive minimum of VS,min of +1.8 kcal mol−1 on P. ReseaOurchers' calculation also gave three, nearly equivalent VS,max on P of 30.0 kcal mol−1 on P along F–P bond extensions, and one on the central region formed by the triangular face formed by three F atoms, with VS,max of +9.3 kcal mol−1. Although most of the positive and negative regions on the surface of the PF3 originated from a mapping of the 0.001 a.u. isoelectron density envelope, it failed to provide any insight as to whether a covalently bonded F atom in the molecule has a σ-hole on the P–F bond extensions.
RWesearchers explored the MESP of PF3 generated with different isodensity envelopes. These led to the emergence of the expected potential profile on the axial portion of P–F bond extensions. Specifically, two (three) local maxima of potential appeared only when reswearchers used a 0.0037 a.u. (0.0038 a.u.) isoelectron density envelope (VS,max = −5.5 kcal mol−1), showing that F in PF3 does indeed have a negative σ-hole. The values of VS,max and VS,min calculated using three different isoelectron density envelopes are shown in Figure 4. The actual nature of the potential on the molecular electrostatic surface of the PF3 was obtained only when the 0.0038 a.u. isodensity envelope was used. Because VS,max and VS,min on F along and around the P–F bond extensions are both negative regardless of the isodensity envelops used, it is clear that F can act as a versatile pnictogen bond acceptor.
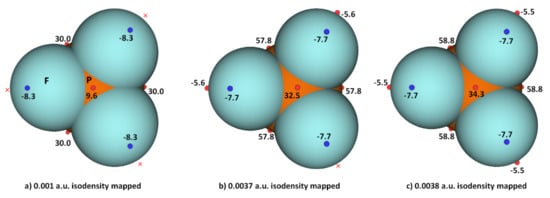

Figure 4. Comparison of ωB97XD/Jorge-ATZP level computed local maxima and minima of electrostatic potential of PF3 mapped on three different isoelectron density surfaces ((a) 0.001 a.u.; (b) 0.0037 a.u.; (c) 0.0038 a.u.), showing the dependence of VS,max and VS,min on the value of isodensity envelope used. The red crosses indicate the missing maxima on covalently bonded F. The tiny circles in red and blue represent the VS,max and VS,min, respectively. Values in kcal mol−1.
Because of the inconsistencies above, reswearchers recalculated the electrostatic potential using the def2-TZVPD basis set, in conjunction with MP2(full). All the monomers were optimized at this level of theory, and the wavefunctions were then evaluated at the same level. The results are summarized in Figure 5 and Table 1. The data show that the 0.001 a.u. isodensity envelope is not a suitable choice on which to compute the potential since it is not ideal to elucidate the van der Waals surface of the PF3 molecule. When at least a 0.0028 a.u. isodensity envelope was used for computing the potential, all the expected critical points of the potential showed up on the surfaces of the three F atoms of the PF3 molecule along the P–F bond extensions, as observed on surfaces of X of the other three PX3 molecules (Figure 5). All three σ-holes on the three F atoms in PF3 are found to be entirely negative (VS,max = –5.3 kcal mol−1), surrounded by a belt of negative sites around their lateral portions.
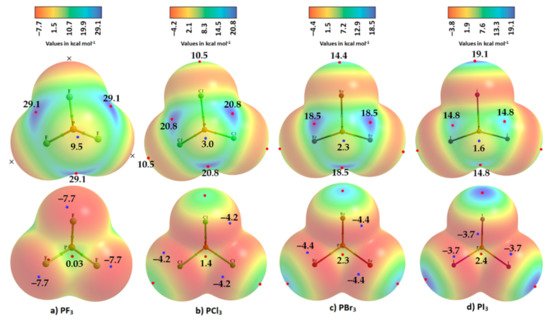

Figure 5. Comparison of MP2(full)/def2-TZVPD calculated 0.001 a.u. isodensity envelope mapped potential on the electrostatic surfaces of PX3 (X = (a) F, (b) Cl, (c) Br, (d) I) molecules. Selected VS,max and VS,min values in kcal mol−1 are shown, which are the local maxima and minima of potential, respectively. Two views of each MESP graph for each molecule are displayed: (Top) Covalently bonded P faces the reader. (Bottom) The three X atoms forming a triangular architecture face the reader. The QTAIM-based molecular graphs are superimposed on each case, and the bond paths are in atom color, accompanied by bond critical points (tiny sphere in green).
Table 1. The 0.001 a.u. isodensity envelope mapped potential on the electrostatic surface of PX3 (X = F, Cl, Br, I) molecules, obtained using MP2(full)/def2-TZVPD a.
| Local Extrema on the Surface of Specific Atom/Bond | PF3 | PF3 | PCl3 | PBr3 | PI3 |
|---|---|---|---|---|---|
| 0.001 a.u. | 0.0028 a.u. | 0.001 a.u. | 0.001 a.u. | 0.001 a.u. | |
| Vs,min On X (lateral portions) | −7.7 | −7.5 | −4.2 | −4.4 | −3.7 |
| Vs,min On X (lateral portions) | −7.7 | −7.5 | −4.2 | −4.4 | −3.7 |
| Vs,min On X (lateral portions) | −7.7 | −7.5 | −4.2 | −4.4 | −3.7 |
| Vs,min on P (opposite to the triangular face formed by three X atoms) | 0.03 | 0.1 | 1.4 | 2.3 | 1.6 |
| VS,max (on P−X bond extensions) | - | −5.3 | 10.5 | 14.4 | 19.1 |
| VS,max (on P−X bond extensions) | - | −5.3 | 10.5 | 14.3 | 19.1 |
| VS,max (on P−X bond extensions) | 29.1 | −5.3 | 10.5 | 14.4 | 19.1 |
| VS,max (on X−P bond extensions) | 29.1 | 48.9 | 20.7 | 18.5 | 14.9 |
| VS,max (on X−P bond extensions) | 29.1 | 48.9 | 20.8 | 18.5 | 14.8 |
| VS,max (on X−P bond extensions) | 9.5 | 48.9 | 20.8 | 18.4 | 14.8 |
| VS,max (on the centroid of the triangular face formed by three X atoms) | - | 26.0 | 3.0 | 2.3 | 2.4 |
a The 0.0028 a.u. isodensity envelope mapped potential on the electrostatic surface of PF3 molecule is included to show that the σ-hole on F in this molecule is not neutral.
The σ-holes on X in PX3 (X = Cl, Br, I) are found to be positive, increasing in magnitude with the polarizability of X: Cl (10.5 kcal mol−1) < Br (14.4 kcal mol−1) < I (19.1 kcal mol−1). This is opposite to the trend found for the π-hole on the P atom in these molecules, as well as of the σ-hole on the P atom along the X–P bond extensions—a trend which is very similar to that of the VS,min around the halogen atoms in the series (PF3 > PCl3 > PBr3 > PI3). Totals of 10 and 14 local minima, respectively, were found on the surfaces of PCl3 and PBr3; these minima were significantly larger than those on PF3 and PI3 (not shown). These results show that the choice of an appropriate basis set and an isodensity envelope is important in determining the correct nature of local surface extrema and hence in being able to deduce the reactivity of a specific atomic domain in a molecular entity.
A crystalline structure of PF3 is unavailable; its molecular structure has been reported by gas-phase electron diffraction [69][102]. Crystalline PCl3 has been reported (at −110 °C, ICSD ref. 32027 [70][103], and at −150 °C, ICSD ref. 27798 [71][104]; Z = 4; space group Pnma), as has PBr3 (ICSD ref. 8052, Z = 2, space group Pnma [72][105]) and PI3 (ICSD ref. 311, Z = 4, space group P63 [73][106]).
In a simple Lewis structure of each of these molecules, trivalent P is σ-bonded with three halogens in a triangular pyramidal structure, with a lone pair on the phosphorus atom and with three lone pairs on each halogen. The crystal structures of PX3 (X = Cl, Br, I) are shown in Figure 6. In each case, the P···X and X···X intermolecular bonding modes are illustrated. The average P···X bond distance is longer than the average X···X bond distance in PCl3 and PBr3. Each P site in these two structures is involved in five P···X contacts with the surrounding molecules, showing a similar pattern of intermolecular pnictogen bonding environment in both the crystals. Two of these contacts are quasilinear and the other three are nonlinear. For instance, a pair of two quasilinear Type-II interactions in PCl3 have ∠P–Cl···Cl = 175.3°, and the nonlinear Type-II interactions have ∠P–Cl···Cl = 143.2°. The corresponding values in PBr3 are 171.4 and 122.9°, respectively.
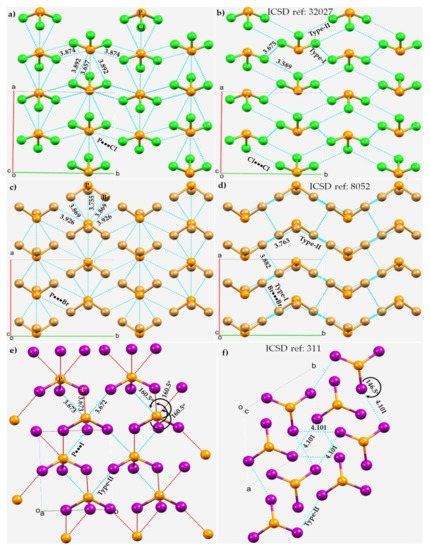

Figure 6. P···X and X···X bonding modes in the 2 × 2 × 2 supercell crystal structure of PX3 (X = Cl, Br, I). Selected bond lengths and bond angles are in Å and degrees, respectively. Atom type is shown in each case. (a) P···Cl and (b) Cl···Cl in PCl3. (c) P···Br and (d) Br···Br in in PBr3. (e) P···I and (f) I···I in PI3.
The short Cl···P contact in PCl3 at 3.657 Å and P–Cl···P of 171.4° (Figure 6a) may not be a pnictogen bond since the positive potential on P (VS,min = 3.0 kcal mol−1) in one molecule is weaker than that of the interacting Cl atom in the partner molecule along the P–Cl bond extension (VS,max = 10.5 kcal mol−1). This interaction is more likely a Type-III halogen bond [74][51], which occurs between interacting sites that feature a very similar directional behavior to a Type-II interaction, but are formed between sites with potentials of identical sign. The short P···Br contact in PBr3 at 3.755 Å with ∠P–Br···P = 126.8° between positive P and negative Br (Figure 6c) is nonlinear and is probably a π-centered pnictogen bonding interaction. ResearchWers note further that each PBr3 molecular unit in the crystal is also bonded to another PBr3 (back-to-back in Figure 6c, but not visible) via a Br···P contact, with a bond distance and ∠P–Br···P of 4.329 Å and 158.7°, respectively (not shown). Its characteristic is similar to those of the corresponding Cl···P interactions observed in the PCl3 crystal, and hence rwesearchers attribute this to a Type-II halogen bond.
Although the Type-II Br···Br noncovalent links force the PBr3 molecules to produce a zig-zag pattern along the crystallographic b-direction, they are weak and possibly dispersion-driven since the intermolecular distances associated with these interactions (r(Br···Br) = 3.763 Å) are slightly larger than twice the vdW radius of Br, 3.72 Å. This does not necessarily mean that the contribution due to electrostatics is negligible; the overall stability of these weak interactions may be understood as a delicate balance between attractive and repulsive forces. In any case, each covalently bonded Br is involved in forming at least four Br···Br contacts. Three of them are Type-I, with r(Br···Br) 3.766 or 3.882 Å. These are also expected to be weaker than, or of comparable strength to, the Type-II Br···Br contacts in PBr3. A similar conclusion may be drawn in the case of the PCl3 system when the P···Cl and Cl···Cl contacts are compared.
The nature of the noncovalent bonding deduced for PCl3 and PBr3 is different in crystalline PI3, as can be inferred by comparing the Type-II P···I and I···I bond distances shown in Figure 6e,f, respectively. For the latter system, the P···I contacts appear to be more Coulombic in nature and the I···I contacts are dispersion-driven and weak, since r(P···I = 3.673 Å) is significantly shorter than the sum of the vdW radii of P and I, 3.94 Å. Similarly, the I···I intermolecular distances, r(I···I) = 4.101 Å, are slightly larger than twice the vdW radius of I, 4.08 Å, and are nonlinear (∠P–I···I =146.5°).
It is evident that the Type-II P···X and X···X pnictogen bonding and halogen bonding modes interplay to stabilize the crystals; they can be explained by means of the MESP models of isolated PX3 molecules (see above). However, this model fails to explain the Type-I X···X interactions regardless of the chemical system investigated since these interactions generally occur between negative lateral sites on a covalently bonded halogen derivative that attract each other when interacting molecular entities are in close proximity.
