Your browser does not fully support modern features. Please upgrade for a smoother experience.
Please note this is a comparison between Version 1 by Tomasz Kolerski and Version 2 by Amina Yu.
The Vistula River in Poland is considered an international waterway. The power production potential of the river has been taken into account over the years. However, further configurations are needed to obtain a more in-depth ecological knowledge-base and economic plans, which are socially approved.
- hydropower
- inland waterways
- Vistula River
- water dams
- economic analysis
1. Introduction
Based on new European Union policies, there are set regulations, for the member states, in regard to substituting energy originating from fossil fuels with energy from more sustainable origins. Resources should be renewable, safe, and non-harmful towards the environment, as well as affordable and resilient to climatic changes [1]. Electric power is the key energy sector is since it boosts the other sectors. A number of countries have already begun progress, e.g., shutting down thermal and nuclear power plants and generating perpetual sources of energy [2]. Wind energy and energy produced by photovoltaics are examples of these kinds of energy sources, yet they are not reliable, nor synchronized with energy demands. Hydropower energy production goes beyond these types of power generation due to flexibility in creating and storing energy. Public demand for this type of energy production is rising, not only in Europe, but also in other continents. Regarding the aforementioned advantages of this energy source, it seems to be a potential key source of power production [3]. Only 19% of the hydropower technical potential of Polish rivers is currently used. The value of this technical potential is estimated to be 12,000 GWh [4], and a normalized value reported by Eurostat was 2310 GWh in 2020 [5], which means Poland still has a long journey in order to achieve higher efficiency in exploiting this renewable source of energy. According to the EU directive, the normalized renewable electricity contribution, generated by all hydropower plants in a specific year, is calculated as the installed capacity of the latest year for hydropower plants, multiplied by the sum of electricity generated divided by the installed capacity for the last 15 years for hydro energy. The generated electricity and net capacity exclude the portions related to the pumped storage plant units using water that has previously been pumped uphill [6].
The State Water Holding Polish Waters currently has 19 hydropower plants with a total capacity of 30.99 MW. In 2020, 60,132 MWh of energy were produced, and in the period from January to August 2021, it was 60,291 MWh. According to the strategy of State Water Holding, 13 hydropower plants are to be modernized.
ItThis waspaper investigated that ths the Vistula River for its connection with the Martwa Wisła to Dęblin, for examplei.e., the section taken into account after the river’s adaptation to the E-40 International Waterway [7]. Both national and international classes of waterways are to be defined based on the European Agreement on the Main Inland Waterways of International Importance (AGN) and UNECE resolution 30 [8][9][8,9], and determined by the horizontal dimensions of vessels or pushed units [10]. The Vistula River from Warsaw to Dęblin, 120.0 km long in its entirety, has been classified as class I. The 161.8-km long section from the Włocławek Dam to Warsaw is classified as class Va (about 40 km) within the impact range of the Włocławek Dam (Włocławek–Płock), and class I (about 120 km) upstream of Płock. The 264.2-km long section downstream of the Włocławek Dam currently has variable parameters of the bed and fairway features, allowing the Vistula to be classified into three different classes of waterway: III, II, and I.
The hydropower potential of the Lower Vistula is about 50% of the hydropower potential of rivers throughout Poland [11]. Hydroelectric power plants located on dams, due to their pro-ecological nature (renewable energy sources—RES), will be important elements of the new national energy system in the future. The low variability of flow in the analyzed area is beneficial for the development of inland water transport. The Vistula has an average annual maximum of water levels in March and a minimum in September [12]. This is due to the winter retention of water in the form of snow and ice, and its runoff in early spring. In wet years, the average annual flow for the water gauge in Toruń is about 1300–1450 m3/s, while in dry periods, the average annual flow decreases to 570–640 m3/s.
The first concept of regulating the Vistula was prepared by the Polish hydro-technician Tadeusz Tillinger in 1919, who developed a project for navigating the Vistula while working as the head of the Department of Artificial Waterways at the Ministry of Public Works of the Republic of Poland [13]. Due to numerous problems faced by Poland in the interwar period, the concept could not be implemented. The idea of building barrages along the Vistula was also analyzed during World War II as part of the work of the team of Professor Antoni Hansen from the Gdańsk University of Technology [14]. This concept, due to the fall of Nazi Germany, was not implemented to any extent.
After World War II, Tillinger presented a project for the comprehensive development of the Vistula River, in which he proposed the development of the river with 42 barrages with a total capacity of 1.18 GW, which would produce 5.2 TWh of electric energy in an average hydrological year [15]. The concept of this cascade solution was based on the following assumptions: (1) the minimalization of inundation; (2) the highest possible heads for hydropower; and (3) the adaptation of the project to the terrain and infrastructure as far as possible. The location of the axes of the dams and the pool levels resulted from utilizing the barrage structure for road and rail crossings, as well as ensuring, over the entire length of the cascade, navigable depths of no less than 2 m. In addition, the project envisaged the minimal impact of the proposed facilities and water devices on cities or settlements, and the gravitational drainage of river valleys [16].
In the following years, the project was subject to further modifications related mainly to the change of location of individual dams and variations in the pool levels [17]. These studies were the basis for the Water Management Committee of the Polish Academy of Sciences in 1956 to create the assumptions of a perspective water management plan for the country [18]. In 1970, the Włocławek Dam on the Lower Vistula was put into operation, which was to constitute the first element of the Lower Vistula cascade [19]. There were plans to build further steps, for i.example., directly above the Wyszogród barrage and below the Ciechocinek barrage. In the case of the Ciechocinek barrage, the works were advanced to such an extent that the land was purchased and the construction site was prepared. These plans were interrupted as a result of the economic crisis in the 1980s and growing environmental awareness in society aimed at preserving rivers in a close-to-natural state. In the following years, the issue of hydro energy development on the Vistula River was also not in line with the declaration of Natura 2000 protected areas covering practically the entire Vistula valley.
After the construction of the Włocławek Dam was finalized, work on the cascade was suspended, but the possibility of building new dams on the Vistula was still being analyzed. The reason for the resumption of works was that grounds were created for making a decision on the future development of the Vistula, and at the same time, seeking a solution to growing problems related to the maintenance of the Włocławek Dam. The project of developing the Lower Vistula with barrages was commissioned by the District Water Management Authority in Warsaw. A study was prepared by the "Hydroprojekt" company in Warsaw in 1999.
All previous concepts focused mainly on the analysis of the construction of dams in the context of using the energy potential of the Vistula River, as well as on its transport functions. However, due to significant bed erosion of the river below the Włocławek Dam, other solutions were considered. In order to avoid a catastrophe related to the potential rupture of the dam in Włocławek, in 2005, the Hydroprojekt company presented a program and spatial concept for a planned investment in the area of Nieszawa–Ciechocinek [20]. This dam was treated as the second element of the cascade.
In 2009, the main electricity producer in the northern part of Poland (ENERGA) submitted a declaration to the Ministry of the Treasury and the Ministry of the Environment to build another water barrage on the Vistula River, which initiated further research [21]. In 2014, a research team from Gdańsk University of Technology made a hydrodynamic model of the Lower Vistula cascade. The model included 10 barrages from Warsaw to the mouth of the Vistula [11]. At the present stage, the development of the Lower Vistula is planned for implementation according to the concept presented by the DHV Hydroprojekt consortium together with the Institute of Meteorology and Water Management [22].
The hydropower production capacity of the existing dam in Włocławek is 160 MW, and the annual energy production is to reach 700 GWh per year. It can be assumed that with eight dams planned on the Lower Vistula section, the energy production potential will be approximately 3000 GWh per year. The estimated energy potential of the five planned dams corresponding to the section of the Middle Vistula will be 650 GWh per year.
2. Economic Analysis of the Project
Based on the feasibility study [13], an economic analysis was developed [23][45], which indicated alternative number 2 as the recommended investment (Figure 1). Alternative number 2 was compared with the “no project implementation” (Table 12), which led to a comparison with the case of no improvement in the Vistula River conditions. As part of the performed cost–benefit analysis, it was shown that all of the analyzed investment alternatives are economically effective, which leads to the conclusion that the implementation of the project is economically profitable and, therefore, it is equally socially justified.
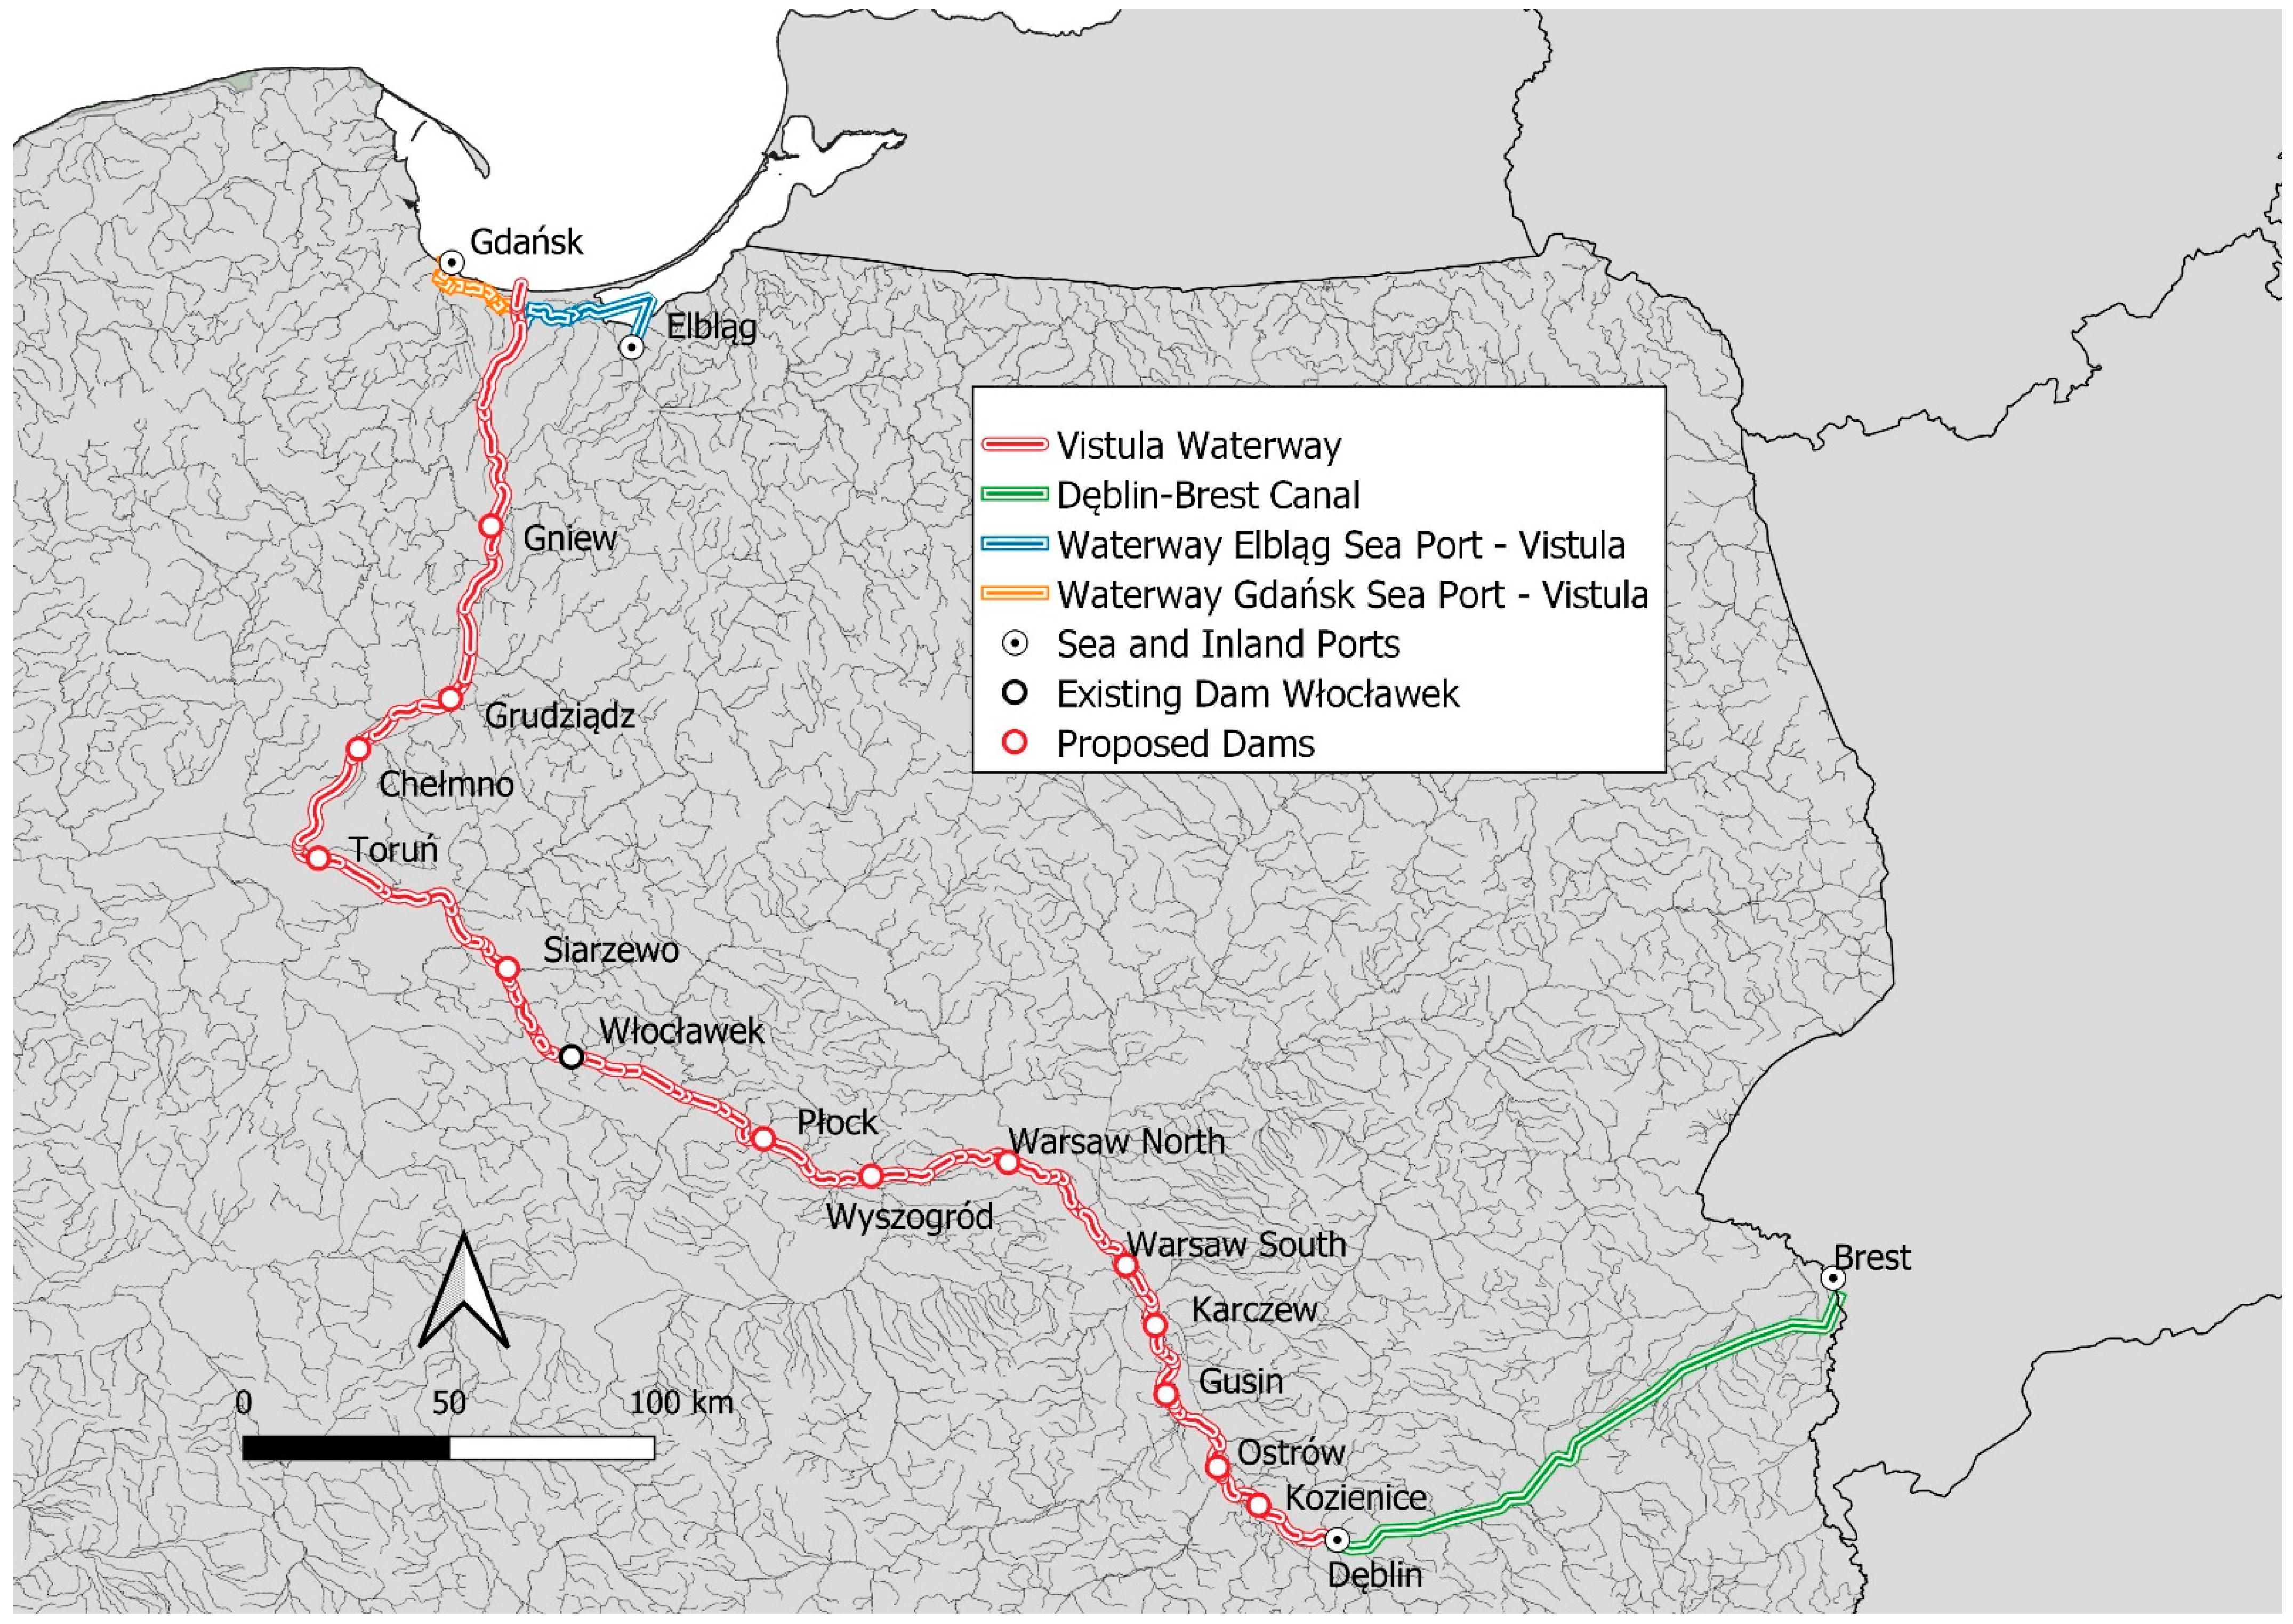
Figure 1. The waterway route according to alternative number 2 with the location of the existing (Włocławek) and proposed dams on the Vistula River [24].
Table 2. Differential revenues from electricity sales for no project implementation and for alternative 2 of the project [23].
Differential revenues from electricity sales for no project implementation and for alternative 2 of the project [45].
| 2029 | 2030 | 2040 | 2050 | 2060 | |
|---|---|---|---|---|---|
| (Million PLN) | |||||
| Savings in climate change costs | |||||
| 2.01 | 1.85% | ||||
| Noise cost savings | 1.41 | 1.29% | |||
| Savings in congestion costs | |||||
| No project implementation | 0.13 | 0.14 | 0.18 | 0.23 | 0.28 |
| Alternative 2 | 95.95 | 95.95 | 431.15 | 619.57 | 763.43 |
In the feasibility study [23][45], the possibility of estimating project revenues from various sources was analyzed. Project operating income was limited to two subcategories:
-
Revenues from the use of inland waterways and their sections—passenger transport and freight transport;
| Benefits | Total value (PLN billion) discounted | % of total benefits |
| Savings in transport costs for cargo owners |
- Revenues from the sale of electricity.
The limitation in the scope of calculating the project’s revenues is due to the fact that the calculation of other revenue categories (such as, for example, rental fees and use of land covered with water) is very difficult, as it is impossible to define the basic assumptions for calculations at the present stage of the project. In the paper, the discussion will be limited to revenues from the sale of electricity.
The implementation of the investment in question provides for the construction of hydroelectric power plants. Revenues from the sale of electricity were estimated as the outcome of the annual production of electricity, expressed in MWh, and the unit price of 1 MWh of electricity. The calculation was divided into the calculation of revenues from the sale of electricity from hydroelectric power plants (HPPs) with installed capacity below and above 20 MW. This is because HPPs below 20 MW may apply for financial support in an auction system (guaranteed income from the sale of electricity), while HPPs with an installed capacity above 20 MW cannot apply for financial support and, therefore, there is a need to differentiate the sale prices of electric energy. As part of the planned investments, only the Ostrów II power plant (19.8 MW) will be able to apply for support; therefore, the selling price of electricity was estimated based on auctions for the purchase of electricity.
The calculation for the Ostrów power plant (below 20 MW) was based on the average price of the announced auction result of the guaranteed price for the purchase of electricity for 2018, considering inflation. The selling price of electricity for HPPs above 20 MW is the average selling price of electricity in the competitive market for 2019 and has been indexed by inflation to the base year (2022). The amount of electricity produced was calculated based on technical analyses and the capacity of individual power plants, taking into account a correction for efficiency and actual power use. Due to the distribution of investment projects over time, individual power plants are to be commissioned in stages, and thus the value of revenues will increase along with the commissioning of hydropower plants until 2059.
The economic net present value (NPV) is positive, which means that the economic flows of the project, expressed in present value, over the entire period of the analysis reached a cumulative positive value, and therefore the economic benefits are higher than the costs related to the implementation of the project. Table 3 presents the discounted costs and benefits resulting from the implementation of the investment in question. The largest share in total benefits is shown by savings in transport costs for cargo owners, while in the case of costs, these are investment outlays.
Table 3. Summary of the cost–benefit analysis [
| 24.81 | 22.80% | |||
| Savings in accident costs | 6.79 | 6.24% | ||
| Cost saving for atmospheric pollution | 0.56 | 0.51% | ||
| 9.19 | ||||
| 8.44% | ||||
| Savings in the cost of flood losses | 21.25 | 19.54% | ||
| Savings in forest fire costs | 5.48 | 5.04% | ||
| Savings in drought costs in agriculture | 0.10 | 0.10% | ||
| Revenue from the sale of electricity | 7.16 | 6.58% | ||
| Savings in CO | 2 | emissions in electricity production | 3.43 | 3.15% |
| Benefits due to increased expenses in tourism | 9.51 | 8.74% | ||
| Economic residual value | 17.10 | 15.72% | ||
| Overall | 108.79 | 100% | ||
| Costs | Total value (PLN billion) discounted | % of total costs | ||
| Investment outlays | 24.49 | 63.23% | ||
| Maintenance and operation costs | 14.24 | 36.77% | ||
| Overall | 38.73 | 100% | ||
| Economic net present value (NPV) | 70.06 |
The benefit–cost (B/C) ratio shows the ratio of economic benefits resulting from carrying out the project to the costs incurred. If the B/C ratio for the project is greater than one—the project benefits the community. In all investment variants, this condition is met. The value of the indicator greater than one indicates an achievement in the effectiveness of the project in generating socioeconomic benefits, expressed in money. This value should be interpreted as a return on investment in social terms higher than the funds involved, for exampli.e., each PLN of expenditure allocated to the project generates PLN 2.81 in alternative number 2.
The internal rate of return (IRR) is higher (4.50%) than the social discount rate (SDR) used for the analysis. This means that the investment has the ability to generate benefits—it will bring higher-than-expected benefits in terms of society. IRR in alternative 2 is 12.31%.