Your browser does not fully support modern features. Please upgrade for a smoother experience.
Please note this is a comparison between Version 3 by Catherine Yang and Version 2 by Catherine Yang.
The physical properties of food materials have defined those properties that can only be measured by physical means rather than chemical means. Food materials are basically naturally occurring biological-originated raw materials that have their own exclusive physical identity that makes them unique in nature. Due to the uniqueness of their physical properties, to properly measure the different physical characteristics of any food materials to get control and understand about the changes in their native physical characteristics with the influence of time-temperature-processing-treatment-exposure, proper measurement techniques for various physical properties of food materials are required with numerous desired outputs.
- food industry
- food physics
1. Importance of Physical Analysis Methods in the Food Industry
Physical testing in the food industry refers to the methods used to evaluate a food product’s varied physical qualities. Color, viscosity, weight, thickness, granulation size, and texture are all common food product attributes examined. Physical testing in the food industry is usually employed as a quality indication, but it can also be used to ensure product consistency. Manufacturers can utilise this to evaluate product value, connect a product to consumer perception, and, in some situations, ensure food safety when a product must be cooked. Unusual physical outcomes could indicate a problem with the shelf life, production, and supply chain. Physical testing has a distinct advantage for businesses in terms of monitoring their suppliers’ items and catching problems before customers complain. Furthermore, when physical qualities are assessed in conjunction with consumer research, the physical test specification ranges can be linked to desirable product information. This can help determine preferences in terms of appearance, such as a certain hue, or texture, such as viscosity, firmness, and consistency. Because a product’s physical properties impact customer perspective and acceptability, determining optimal physicochemical characteristics can aid product development teams and retailers with knowledge on the part for drawing conclusions. Technologies that help in the physical analysis of food material is a subject of growing interest because of their non-destructive nature (Figure 1). Since the last half of the 20th century there has been an increase in the search for new physical analysis methods for the food industry. In Scopus and the Web of Science, a moderate number of papers are being published on this topic, and most of the published articles are research articles. The published works available in the field basically describe the working procedures, results, and validation of some particular methods on specific food products. Keyword searching reveals that the techniques to analyze the physical property of food materials are gaining the interest of researchers from academia, as well as from industry (>25 in 2022 to date, >75 in 2021 and >50 in 2020). Bibliometric analysis has revealed that there are several research papers available on the techniques for analysis of various physical properties of food materials, but there is a need for a concise review of the principles, specific field of applications, merits, and demerits of the techniques to provide an overall view of the rigorously practiced methods.
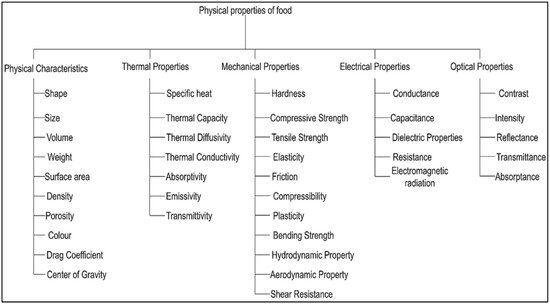
Figure 1. Classification of physical properties of food materials.
2. Techniques for Non-Destructive Physical Methods
During recent years, researchers have applied several novel techniques in the field of physical property assessment of different food commodities. Depending on the physical states of the food material, the methods of physical techniques that have been employed are described in Figure 2.
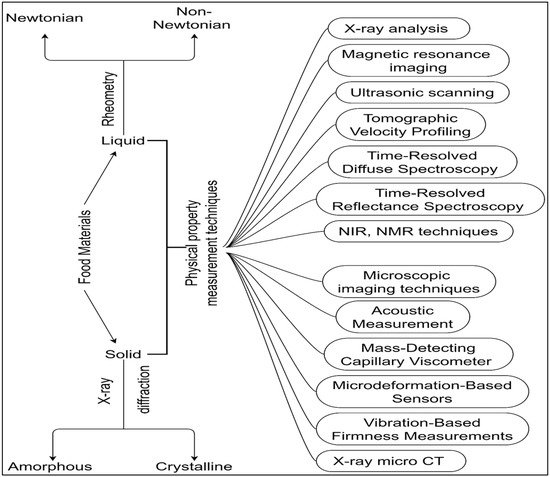
Figure 2. Novel techniques for assessment of physical properties of food materials.
2.1. Ultrasonic Wave-Based Analysis
The ultrasonic frequency is beyond audible to human hearing. These acoustical or mechanical waves have a frequency of ≥20 kHz. An ultrasonic scanning system can be used for food diagnostic purposes (physicochemical properties like flow rate, structure, composition, and physical state), especially for soybean, honey, cereals, meat, and aerated foods (Table 1) [1]. Volume estimation, firmness, maturity of fruits [2][3][4], rheological properties of cereal products [5], determination of fat percentage in meat [6], and defect detection in cheese [7] have been measured or conducted with ultrasound. Ultrasound velocity, attenuation coefficient, signal and wave amplitude, acoustic impedance, and relative delay are the parameters considered for analysis of food materials [8][9]. The techniques provide the following advantages: portable, simple, low power consumption, lower operational cost, adaptability for both liquid and solid foods, and environmentally friendly [8]. The limitations of the techniques are shock wave generation, followed by degradation of products, and radical formation followed by off-flavor formation in the products subject to analysis. Surface characteristics and homogeneity of products may affect test efficiency and the development of mass transfer resistance [1].
2.2. Young’s Modulus and Poisson’s Ratio
The Sitkey technique was applied by researchers to determine the Poisson’s ratio as a function of moisture content and Young’s modulus as a function of loading rate. A material testing machine was used to perform the test. It found that there is a negative correlation between the Poisson’s ratio of the grains and moisture content. On the other hand, the reverse was found for the loading rate. For the grains, Young’s modulus is inversely proportional to moisture content and loading rate [10].
2.3. Compressibility Analysis through High-Pressure Processing (HPP)
Processing food by applying high pressure is now an impactful technique to preserve different foods. High pressures exhibit bulk compression loading on the food. At high pressure (400–1000 MPa) and adiabatic conditions with a pressure change of 100 MPa, there is a change in water temperature of 3 °C. Pressurization of food material leads to changes in rheological properties, thermodynamic properties, and compression heating [11]. It is a non-destructive green technique, but the food composition and solute concentration are the limiting factors for the efficacy of the technique. Moreover, it is not suitable for solid food products [11].
3. MRI Technique
MRI is the formation of a very weak magnetization field produced by atomic nuclei of body tissue in the presence of another magnetic field. The density of the nuclei is correlated to the magnetization, and hence it shows the nature of the distribution of atoms. In an MRI, mainly hydrogen atoms are observed. Therefore, softer tissue with large water molecules can be studied well in an MRI [12]. Fat content (40 ± 23 mg/g) determined by an MRI demonstrated an association with GC (39 ± 16 mg/g) in starving fish. For well-fed fish, however, there was no agreement. This could be attributable to non-triglyceride lipid synthesis in well-fed fish and MRI and GC sensitivity differences. From this study, iIt is obvious that the MRI may more precisely depict fat content [13]. The non-invasive and non-destructive features of this technique make it attractive for food analysis [14], but for the cost-intensive nature and difficulty in analysis of food materials in the metastable physical state (e.g., subcool materials) [15].
The physical properties, their significance in the food industry, their techniques for measurement, interpretation of the measured results, brief working principle, and the objective of the analysis have been listed in Table 1.
Table 1. Physical properties of different food commodities.
| Physical Property | Significance in Food Industry | Unit | Interpretation of Measured Data | Measurement Technique | Principle | Measured Property | Objective of Analysis | Reference |
|---|---|---|---|---|---|---|---|---|
| Water Activity (WA) | Assessment of internal structure of the food, effect on food texture and shelf-life assessment. | - | WA > 0.90 growth of bacteria; WA < 0.70 growth of molds inhibit; WA < 0.60 growth of most of the microorganisms inhibit | Water activity meter. | Ratio of the vapour pressure (VP) of the water in food and the VP of the pure water. | Equillibrium relative humidity | Quality characteristic measurement for Sugar and sugar replacers, Starch powders, Agar gels. | [16][17] |
| Hygroscopicity | Assessment of a food’s ability to absorb moisture. | - | Powdered food with high hygroscopicity likely to be clump formation with simultaneous increase in texture hardening | Hygrometers | Works on the concept of evaporative cooling. | Amount of moisture uptake by a specific fod material | Moisture sorption isotherm modeling for starch and wheat gluten, Corn starch, pepper | [18] |
| Mass | Measure for inertia and heaviness of a body. | kg/g/mg | - | Weighing balance. | A counteracting force is created to be compared to the unknown mass. | Quantity of matter | To meet product formulation standards and manufacturing specifications | [16] |
| Density | Mass per unit volume. | kg/m3 | >1 kg/m3 (at STP) food material will sink in water | Hydrometer | Displacement of its own weight within a fluid. | Mass and volume | Alcohol concentration of drinks; Solids in sugar syrups; Density, specific gravity and absorption of fine aggregate; Specific gravity of pigments. |
|
| Specific Gravity | Ratio of the absolute density of a food material to the density of a reference material | - | Determines whether the solid food materials will sink or float in liquid medium | Specific gravity bottle | Liquid densities are measured by measuring the weight difference between an empty and filled bottle and dividing by an equal volume of water. | Density of food materials and water | ||
| Bulk Density | Density of powders like food materials which contain hollow spaces or voids filled with gas, normally air. | g/mL | High bulk density is desirable in terms of food transportation and packaging | - | By measuring the volume of a known mass of powder sample that may have been passed through a sieve into a graduated cylinder. | Determination of powdered food characteristics especially for grinding and spray drying process | ||
| Particle Size | Particles with a regular shape are characterized by their linear dimensions (lengths) along their principal axes. | m/cm/mm | Affect the flowability, solubility and reactivity, and the shelf life, processing condition, organoleptic properties and texture of the final product (e.g., sieving considered for >63 micron particles; sedimentation hindered when size <10 nm) | Particle Size Analyzer | The angle of incidence light scattering is inversely proportional to particle size. | Diameter | Texture and organoleptic characterisation of chocolate, fibres of grain, powdered food, and sizing of protein nano-fibres. | [19][20][21] |
| Specific Surface Area (S.A) | Quantification of internal surface area or size of individual particles within a disperse system | m2/kg or m2/g | Materials with 500–3000 m2/g S.A suitable for solute and gas absorption; 200 m2/g S.A suitable for catalyst | Brunauer-Emmett-Teller (BET) surface area analysis | Surface area | Mass and heat transfer calculation, gas and moisture permiability through packaging materials | ||
| Sphericity | Compactness compared with a perfect sphere of same dimension. | - | Sphericity value ≈ 1 (sphere), ≈0.00271 (cube), ≈0.00155 (cylinder) | Ratio of the surface area of an equal-volume sphere to the actual surface area of the particle. | Surface area and volume | Analysis and design of food process equipment | ||
| Sauter Diameter (SD) | Diameter of a hypothetical sphere with the same specific surface as the irregular shaped particle. | m/cm/mm/μm | Coarse particle (SD > 10 mm); fine particle ≈ 1 mm, ultrafine particle < 0.1 mm | Diameter gauge | Ratio of surface area and volume of particle | Surface area and volume | Grinding characteristics measurement for wheat grain and size reduction characterisation | |
| Uniaxial Stress | It is caused by a force pushing or pulling the body in a direction perpendicular to the surface of the solid body upon which the force is acting. | Pa | - | Strain gauge hole-drilling method | Deformation around the hole | Deformed area | Alginate gel: stress strain behavior and viscoelasticity. Fruit and vegetable puree products: rheological properties. Ketchup: hydrocolloids and flow behaviour. Powders: flow properties, nonflow problems. Wheat flour: rheological properties using farinograph, extensograph, valorigraph, alveograph device. |
[22][23][24][25][26][27] |
| Young’s Modulus | It is the slope of the linear part of the stress-strain curve for a material under tension or compression. | - | Addition fat reduces the young’s modulus i.e., the decrease in rigidity. The harder is the food material the higher is the young’s modulus | Oscillating rod | Estimated with the help of stress-strain curve. | Alteration in length, and uniaxial stress | ||
| Bulk Modulus | The relative change in the volume of a body produced by a unit compressive or tensile stress acting uniformly over its surface. | Pa | - | The measure of the ability of a substance to withstand changes in volume when under compression on all sides. It is equal to the quotient of the applied pressure divided by the relative deformation. | Pressure and volume | |||
| Shear Modulus | It is the resulting stress When a force is acting parallel to a surface. | Pa | The higher the shear modulus the higher is the rigidity of the food material | - | - | Pressure and strain | ||
| Newtonian Flow | linear relationship between shear stress (SS) and resulting shear rate (SR). | - | Reynolds no (NR) <2000; visosity not change with applied force | Ball viscometer | Elapsed time for the ball to fall under gravity | Flow behaviour of liquid food materials for process design, quality measure and flexible container design | ||
| Non-Newtonian Flow | non-linear relationship between SS and SR. | - | NR >2000; visosity change with applied force | Brookfield viscometer | Torque | |||
| Interfacial Surface Tension (IST) | It is the force of attraction between the molecules at the interface of two fluids. | N/m | Emulsion stability increases with the IST | Force tensiometer | Du Noüy ring method; Wilhelmy plate method | Force and length | Foam stability of ice-cream; Physical properties of chocolate | [28] |
| Permeability | Quantification of the relative ease with which a transporting substance can pass through the material. | m2/s-Pa | Lower the permeability of the packaging material lower will be the shelf life of the food product | Helium Permeability Meter | Pressure, mass | Undertanding the moisture transfer phenomenon during drying of fruits; mass tranfer phenomenon in lactose crystallization, Whey-protein-coated plastic films; design of pulse electric and ohmic heat process. |
[29][30][31][32] | |
| Conductivity | It can be defined as a measure of electrical conduction. | Siemens per meter (S/m) | Efficiency of pulsed electric and ohmic heat proces is depend on conductivity of food materials | conductivity meter | It is the ability of a material to conduct electric current. | Resistivity | ||
| Resistance | It is a measure of the opposition to current flow in an electrical circuit. | Ohm (Ω) | Juiciness and tenderness of meat products are correlated with the resistance | Ohmmeter | Deflection of pointer to left or right side in ohmmeter due to current passing through it indicate low/high resistance. | |||
| Heat capacity (HC) | Thermal property that indicates the ability of the material to hold and store heat. | Joule per Kelvin(J/K) | Food materials with high HC have more energy and take higher cooking time | Differential scanning calorimeter | The difference in the amount of heat required to increase the temperature of a sample and reference are measured as a function of temperature. | change in temperature, heat flow/unit time | Characterization and understanding of thermo physical properties for meat; modelling thermal properties for cheddar cheese; prediction of thermal properties during freezing and thawing for meat and dough; thermal conductivity and heat capacity for shrimp; investigation for thermal properties of ice-cream and heat conductivity of food materials |
[33][34][35] |
| Thermal conductivity | Heat transfer ability of food | Watts per meter-Kelvin (W/(m⋅K) | It dictates how quickly heat may be evenly distributed throughout the food mass, affecting the quality of the end product. | Thermal conductivity meter (The two types of thermal conductivity meter are steady-state and non-steady-state, also called transient, conductivity meters) | Steady state (when the temperature of the substance being measured remains constant over time), frequency (sensor and hot-wire based method), and time domain (During the heating up phase, transient approaches take measurements) techniques. | Amount of heat transfer, change in temperature, surface area of food material | ||
| Thermal diffusivity (TD) | It is the thermal conductivity divided by density and specific heat capacity at constant pressure. | Square metres per second (m2 s−1) | Most of the food materials lies within the range of 1.05 × 10⁷ m2 s−1 (apple juice) to 1.82 × 10⁷ m2 s−1 (peas). Higher the TD the lower time will require to cool or heat the product | Discovery Flash Diffusivity instruments | - | Density, specific heat capacity, thermal conductivity | ||
| Calorific value (CV) | Heat generated due to complete combustion of specified quantity at constant pressure under normal conditions. | kJ/kg | 4 kcal/g for carbohydrate and protein and 9 kcal/g for fat, higher the CV higher is the energy content of the food | Bomb Calorimeter | Energy released by burning a representative sample in a high- pressure oxygen atmosphere within a metal pressure vessel or “bomb” absorbed within the calorimeter and the resulting temperature change within the absorbing medium is noted. | Increase in temperature | ||
| Capacitance | capacity of a component to collect and store energy in the form of an electrical charge. | Farad (F) | capacitance meter | The capacitance meter works based on the directly proportional relationship between capacitance and a time constant. | Voltage | Fish quality measurement using electrical properties and Monitoring microbial growth |
[36][37][38] | |
| Inductance | Ability of an inductor to store energy. | Henry (H) | LCR meter | - | Cross sectional area, length and current | |||
| Paramagnetism | Weakly attachment towards magnetic fields. | - | If the total number of electrons in a molecule is 10 and 16, or odd, the molecule is paramagnetic. | - | - | Electron configuration | On-line water content during cooking for rice; NMR imaging during drying process of noodles; meat muscle characterization, water binding, freezing by NMR for meat | [39] |
| Diamagnetism | Magnetic property assesment | - | If the total number of electrons in a molecule is even except 10 and 16 the molecule is paramagnetic. | - | Change in the motion of electrons upon application of magnetic field | Electron configuration | ||
| Ferromagnetism | Strong attachment towards magnetic fields. | - | - | - | Electron configuration | |||
| Electric polarization | Separation of centre of positive charge and the centre of negative charge in a material with help of high-electric field. | Coulomb per square metre (C·m−2) | It influence the dielectric heating of food materials | Polarimeter | - | Dipole moment | Sequential treatment of drinking water with UV and ozone; combined treatment of pulsed light and to inactivate microorganism;pulsed UV treatment of milk; gelling temperature investigation of gelling gels, rheologic and dielectric properties; analytical fingerprinting with spectroscopic techniques for butter and margarine; identifying coffee arabica, robusta and blends by NIRS. |
[40][41][42][43][44] |
| Refractive index | Ratio of the velocity of light in a vacuum to the velocity of light in a material. | - | Higher refractive index refers to higher total soluble solid content | Refractometer | The concentration of a particular substance within a given solution is measured. It operates based on the principle of refraction. When rays of light pass from one medium into another, they are bent either toward or away from a normal line between the two media. | Angle of refraction | Measure for concentration and purity of food materials | |
| Colour | Sensory attribute | TCU (True Color Unit) |
L = 0 (black), = 100 (white); a = +ve (red) = −ve (green); b = +ve (yellow), = −ve (blue) | Colorimeter | It is based on Beer-Lambert’s law, according to which the absorption of light transmitted through the medium is directly proportional to the medium concentration. | Concentration or intensity of colour | standardising and checking of ingredient colour allows them to maintain control over the colour of their final goods and analyse colour changes during manufacturing, transit, and preservation. |
References
- Majid, I.; Nayik, G.A.; Nanda, V. Ultrasonication and food technology: A review. Cogent Food Agric. 2015, 1, 1071022.
- Yildiz, F.; Özdemir, A.T.; Uluışık, S. Evaluation Performance of Ultrasonic Testing on Fruit Quality Determination. J. Food Qual. 2019, 2019, 6810865.
- Mizrach, A. Assessing plum fruit quality attributes with an ultrasonic method. Food Res. Int. 2004, 37, 627–631.
- Mizrach, A. Ultrasonic technology for quality evaluation of fresh fruit and vegetables in pre- and postharvest processes. Postharvest Biol. Technol. 2008, 48, 315–330.
- Ross, K.A.; Pyrak-Nolte, L.J.; Campanella, O.H. The use of ultrasound and shear oscillatory tests to characterize the effect of mixing time on the rheological properties of dough. Food Res. Int. 2004, 37, 567–577.
- Li, C.; Zheng, Y.; Kwabena, A. Prediction of IMF Percentage of Live Cattle by Using Ultrasound Technologies with High Accuracies. In Proceedings of the 2009 WASE International Conference on Information Engineering, Taiyuan, China, 10–11 July 2009; Volume 2, pp. 474–478.
- Hæggström, E.; Luukkala, M. Ultrasound detection and identification of foreign bodies in food products. Food Control 2001, 12, 37–45.
- Awad, T.S.; Moharram, H.A.; Shaltout, O.E.; Asker, D.; Youssef, M.M. Applications of ultrasound in analysis, processing and quality control of food: A review. Food Res. Int. 2012, 48, 410–427.
- Gallo, M.; Ferrara, L.; Naviglio, D. Application of Ultrasound in Food Science and Technology: A Perspective. Foods 2018, 7, 164.
- Ogawa, Y.; Matsuura, M.; Yamamoto, N. Young’s Modulus and Poisson’s Ratio Changes in Japanese Radish and Carrot Root Tissues during Boiling. Int. J. Food Prop. 2015, 18, 1006–1013.
- Fauzi, N.A.; Farid, M.M.; Silva, F. An insight on the relationship between food compressibility and microbial inactivation during high pressure processing. J. Food Sci. Technol. 2017, 54, 802–809.
- Antequera, T.; Caballero, D.; Grassi, S.; Uttaro, B.; Perez-Palacios, T. Evaluation of fresh meat quality by Hyperspectral Imaging (HSI), Nuclear Magnetic Resonance (NMR) and Magnetic Resonance Imaging (MRI): A review. Meat Sci. 2021, 172, 108340.
- Brix, O.; Apablaza, P.; Baker, A.; Taxt, T.; Grüner, R. Chemical shift based MR imaging and gas chromatography for quantification and localization of fat in Atlantic mackerel. J. Exp. Mar. Bio. Ecol. 2009, 376, 68–75.
- Ebrahimnejad, H.; Ebrahimnejad, H.; Salajegheh, A.; Barghi, H. Use of Magnetic Resonance Imaging in Food Quality Control: A Review. J. Biomed. Phys. Eng. 2018, 8, 127–132.
- McCarthy, M.J.; McCarthy, K.L. Applications of magnetic resonance imaging to food research. Magn. Reson. Imaging 1996, 14, 799–802.
- Figura, L.O.; Teixeira, A.A. Food Physics: Physical Properties—Measurement and Applications; Springer: Berlin, Germany, 2010; p. 550.
- Al-Muhtaseb, A.H.; McMinn, W.A.M.; Magee, T.R.A. Water sorption isotherms of starch powders: Part 1: Mathematical description of experimental data. J. Food Eng. 2004, 61, 297–307.
- Peng, G.; Chen, X.; Wu, W.; Jiang, X. Modeling of water sorption isotherm for corn starch. J. Food Eng. 2007, 80, 562–567.
- Ziegler, G.R.; Mongia, G.; Hollender, R. The role of particle size distribution of suspended solids in defining the sensory properties of milk chocolate. Int. J. Food Prop. 2007, 4, 353–370.
- Attaie, H.; Breitschuh, B.; Braun, P.; Windhab, E.J. The functionality of milk powder and its relationship to chocolate mass processing, in particular the effect of milk powder manufacturing and composition on the physical properties of chocolate masses. Int. J. Food Sci. Technol. 2003, 38, 325–335.
- Lyu, F.; Thomas, M.; Hendriks, W.H.; van der Poel, A.F.B. Size reduction in feed technology and methods for determining, expressing and predicting particle size: A review. Anim. Feed Sci. Technol. 2020, 261, 114347.
- Cuq, B.; Gonçalves, F.; Mas, J.F.; Vareille, L.; Abecassis, J. Effects of moisture content and temperature of spaghetti on their mechanical properties. J. Food Eng. 2003, 59, 51–60.
- Juszczak, L.; Witczak, M.; Fortuna, T.; Banyś, A. Rheological properties of commercial mustards. J. Food Eng. 2004, 63, 209–217.
- Resch, J.J.; Daubert, C.R. Rheological and physicochemical properties of derivatized whey protein concentrate powders. Int. J. Food Prop. 2007, 5, 419–434.
- Gujral, H.S.; Sharma, A.; Singh, N. Effect of hydrocolloids, storage temperature, and duration on the consistency of tomato ketchup. Int. J. Food Prop. 2007, 5, 179–191.
- Haley, T.A.; Smith, R.S. Evaluation of in-line absorption photometry to predict consistency of concentrated tomato products. LWT Food Sci. Technol. 2003, 36, 159–164.
- Ahmed, J.; Ramaswamy, H.S. Dynamic rheology and thermal transitions in meat-based strained baby foods. J. Food Eng. 2007, 78, 1274–1284.
- Chang, Y.; Hartel, R.W. Stability of air cells in ice cream during hardening and storage. J. Food Eng. 2002, 55, 59–70.
- Funebo, T.; Ahrné, L.; Prothon, F.; Kidman, S.; Langton, M.; Skjöldebrand, C. Microwave and convective dehydration of ethanol treated and frozen apple—Physical properties and drying kinetics. Int. J. Food Sci. Technol. 2002, 37, 603–614.
- Ferrando, M.; Spiess, W.E.L. Mass transfer in strawberry tissue during osmotic treatment I: Microstructural changes. J. Food Sci. 2003, 68, 1347–1355.
- Hong, S.I.; Krochta, J.M. Oxygen barrier performance of whey-protein-coated plastic films as affected by temperature, relative humidity, base film and protein type. J. Food Eng. 2006, 77, 739–745.
- Alvi, S.A.A. Quality evaluation of goat meat by an electrical method. J. Agric. Eng. 1989, 26, 59–65.
- Cogné, C.; Andrieu, J.; Laurent, P.; Besson, A.; Nocquet, J. Experimental data and modelling of thermal properties of ice creams. J. Food Eng. 2003, 58, 331–341.
- Maroulis, Z.B.; Saravacos, G.D.; Krokida, M.K.; Panagiotou, N.M. Thermal conductivity prediction for foodstuffs: Effect of moisture content and temperature. Int. J. Food Prop. 2007, 5, 231–245.
- Marschoun, L.T.; Muthukumarappan, K.; Gunasekaran, S. Thermal properties of cheddar cheese: Experimental and modeling. Int. J. Food Prop. 2006, 4, 383–403.
- Olafsdottir, G.; Nesvadba, P.; Di Natale, C.; Careche, M.; Oehlenschläger, J.; Tryggvadóttir, S.V.; Schubring, R.; Kroeger, M.; Heia, K.; Esaiassen, M.; et al. Multisensor for fish quality determination. Trends Food Sci. Technol. 2004, 15, 86–93.
- Ryder, J.; Ababouch, L. Food and Agriculture Organization of the United Nations. In Proceedings of the Fifth World Fish Inspection and Quality Control Congress, The Hague, The Netherlands, 20–22 October 2003; p. 162.
- Bhosale, A.A.; Sundaram, K.K. Firmness Prediction of the Apple Using Capacitance Measurement. Procedia Technol. 2014, 12, 163–167.
- Evans, S.D.; Nott, K.P.; Kshirsagar, A.A.; Hall, L.D. The effect of freezing and thawing on the magnetic resonance imaging parameters of water in beef, lamb and pork meat. Int. J. Food Sci. Technol. 1998, 33, 317–328.
- Huang, Y.; Cavinato, A.G.; Tang, J.; Swanson, B.G.; Lin, M.; Rasco, B.A. Characterization of sol–gel transitions of food hydrocolloids with near infra-red spectroscopy. LWT Food Sci. Technol. 2007, 40, 1018–1026.
- Jaillais, B.; Morrin, V.; Downey, G. Image processing of outer-product matrices—A new way to classify samples: Examples using visible/NIR/MIR spectral data. Chemom. Intell. Lab. Syst. 2007, 86, 179–188.
- Esteban-Díez, I.; González-Sáiz, J.; Sáenz-González, C.; Pizarro, C. Coffee varietal differentiation based on near infrared spectroscopy. Talanta 2007, 71, 221–229.
- Chen, B.; Fu, X.G.; Lu, D.L. Improvement of predicting precision of oil content in instant noodles by using wavelet transforms to treat near-infrared spectroscopy. J. Food Eng. 2002, 53, 373–376.
- Singh, S. Refractive Index Measurement and its Applications. Phys. Scr. 2002, 65, 167–180.
More