BangladThesh has substantially increased aquaculture production over the last few decades, and the exotic species share a significant portion of the total fish production. Although exotic species are contributing to African catfish Clarias gariepinus has been introduced for aquaculture production, a few of them are causing biodiversity loss and genetic erosionin Bangladesh due to the scarcity of indigenous C. batrachus of native specieingerlings. The African catfish Clarias gariepinus is a highly carnivorous species and predates small indigenous freshwater fishes when escaping into natural water bodies. However, the government of Bangladesh has banned the farming of C. gariepinus due to the carnivorous nature of this species. The introduction of C. gariepinus caused native biodiversity loss due to its predatory nature.
- catfish
- Claris batrachus
- C. gariepinus
- aquaculture
- Bangladesh
1. Introduction
2. Sequence Analysis of COI and Cytb Genes
2. Sequence Analysis of COI and Cytb Genes
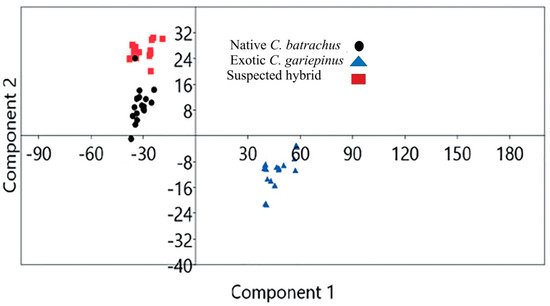
Validation of morphological identification by geometric morphometry: Based on geometric morphometry, the scattered plot of the landmark points showed that native C. batrachus, suspected hybrid and exotic C. gariepinus were morphologically distinguishable (Figure 1). The principal component 1 (PCA 1)_and PCA 2 of landmark points showed that native C. batrachus, suspected hybrid exotic C. gariepinus formed a separate cluster.
3. Sequence Analysis of COI and Cytb Genes
| No | Species Name | 1 | 2 | 3 | 4 | 5 | 6 | 7 |
|---|---|---|---|---|---|---|---|---|
| 1 | ||||||||
| 1.235 | ||||||||
4. Transition/Transversion Bias
| A | T | C | G | |
|---|---|---|---|---|
| A | - |
3. The p-values were larger than 0.05 between sequence pairs of reference C. batrachus from the Philippines and Indonesia; the reference C. batrachus from India and Bangladesh relative to the reference from the Philippines and Indonesia; the Bangladeshi sequence of native C. batrachus and C. gariepinus; the C. gariepinus from Nigeria, Indonesia and C. batrachus from India, Indonesia, and the Philippines; the sequence of suspected hybrid and native C. batrachusand exotic C. gariepinus. The sequences of the COI gene in native C. batrachus evolved with the same pattern of substitution like the species originating from other counties (
Table 4).3).
| Sl.No | Species Name | 1 | 2 | 3 | 4 | 5 | 6 | 7 | 8 |
|---|---|---|---|---|---|---|---|---|---|
| C. batrachus | 1 (MG988399) | 6.9605% | |||||||
| 6.2622% | 8.7613% | 2 | C. batrachus (Philiphine) | 0.189 | |||||
| T | |||||||||
| 5.9107% | - | 15.3969% | 4.5926% | 3 | C. batrachus (Indonesia) | 0.691 | |||
| C | 5.9107% | 17.1140% | - | 4.5926% | |||||
| G | 11.2759% | 6.9605% | 6.2622% | - |
5. Homogeneity of Substitution Patterns of COI Sequences
The estimated p values smaller than 0.05 (considered significant and marked with an asterisk) are presented above the diagonal in
Table 4. The estimated disparity index per site is presented for each sequence pair above the diagonal in3. The estimated disparity index per site is presented for each sequence pair above the diagonal in
Table 4. The p-values were larger than 0.05 between sequence pairs of reference C. batrachus from the Philippines and Indonesia; the reference C. batrachus from India and Bangladesh relative to the reference from the Philippines and Indonesia; the Bangladeshi sequence of native C. batrachus and| 1 | C. batrachus 1 (MG988399) | 0.189 | 0.691 | 0.000 * | 0.000 * | 0.318 | 0.146 | 0.000 * | |
| 2 |
4). The pairwise genetic distances based on nucleotide sequence divergences are presented in
Table 5.4.
| No | Species Name | 1 | 2 | 3 | 4 | 5 | 6 | 7 | 8 | ||||||||||||||||
|---|---|---|---|---|---|---|---|---|---|---|---|---|---|---|---|---|---|---|---|---|---|---|---|---|---|
| 1 | C. batrachus 1 (MG988399) | ||||||||||||||||||||||||
| C. batrachus | (Philiphine) | 0.194 | 0.000 * | 0.000 * | 1.328 | 0.000 * | 0.000 * | 1.258 | |||||||||||||||||
| 2 | C. batrachus (Philiphine) | 4.931 | 0.000 | ||||||||||||||||||||||
| 3 | C. batrachus (Indonesia) | 0.108 | 1.000 | 4 | C. batrachus (India) | 0.000 | 0.000 | 0.000 | |||||||||||||||||
| 0.000 * | 1.961 | 0.000 * | |||||||||||||||||||||||
| 3 | C. batrachus | 0.000 * | (Indonesia) | 3.283 | 1.909 | ||||||||||||||||||||
| 3.110 | 4 | C. batrachus (India) | 1.000 | 1.000 | 1.000 | 0.900 | 0.000 * | 0.000 * | 0.923 | ||||||||||||||||
| 4 | C. batrachus (India) | 4.122 | 2.137 | 2.302 | 5 | C. gariepinus (MG988400) | 0.000 | 1.328 | 1.961 | 0.900 | 5 | C. gariepinus (MG988400) | 1.000 | 0.044 | 0.012 | 0.100 | 1.370 | 1.068 | 0.000 * | ||||||
| 5 | |||||||||||||||||||||||||
| C. gariepinus | ((MG988400) | 0.339 | 5.005 | 4.400 | 4.635 | 6 | C. gariepinus (Indonesia) | 6 | C. gariepinus | 0.318 | (Indonesia) | 0.2340.000 | 0.000 | 0.000 | 1.000 | 1.0001.370 | |||||||||
| 1.000 | 0.032 | 0.000 * | |||||||||||||||||||||||
| 6 | 1.440 | C. gariepinus (Indonesia) | 2.837 | 4.987 | 4.638 | 6.238 | 2.594 | 7 | C. gariepinus (Nigeria) | 0.146 | 0.000 | 0.000 | 0.000 | ||||||||||||
| 7 | C. gariepinus (Nigeria) | 0.332 | 1.068 | 0.000 | |||||||||||||||||||||
| 1.000 | 1.000 | 1.000 | 0.050 | 1.000 | 1.235 | 8 | Suspected hybrid (MG988401) | 0.000 | 1.258 | ||||||||||||||||
| 8 | Suspected hybrid (MG988401) | 1.000 | 0.024 | 1.909 | 0.923 | 0.000 | 0.022 | 0.082 | 1.0001.440 | 0.026 | 0.046 |
6. Genetic Distance
The lowest genetic distance was found between suspected hybrid and C. gariepinus (0.295). The highest genetic distance (6.238) was found between C. gariepinus from Indonesia and Bangladeshi C. batrachus . Low levels of genetic divergence (0.295 -0.339) were found among sequenced native Clarias batrachus, suspected hybrid and exotic C. gariepinus ( in Bangladesh, whereas interspecies genetic divergence was found between C. batrachus and C. gariepinus from other countries (
| 7 | ||||||||
| C. gariepinus | ||||||||
| (Nigeria) | ||||||||
| 4.055 | 4.636 | 5.095 | 3.147 | 4.025 | 2.315 | |||
| 8 | Suspectred hybrid (MG988401)) | 0.311 | 4.706 | 4.297 | 4.763 | 0.295 | 2.631 | 4.629 |
7. Phylogenetic Tree Using COI Nucleotide Sequences by Maximum Likelihood Methods
8. Phylogenetic Tree Using Cytb Nucleotide Sequences by Maximum Likelihood Method
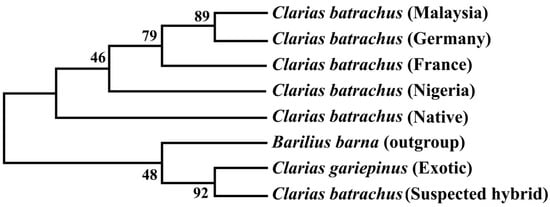
The phylogenetic tree based on the Cytb nucleotide sequences was used to validate the phylogenetic tree inferred from the COI nucleotide sequence (
Figure 5). The results showed that sequenced suspected hybrid formed sister taxa with the sequenced C. gariepinus. The native C. batrachus formed a clade with C. batrachus of originated from different countries (Nigeria, France, Germany, and Malaysia) except suspected hybrid and C. gariepinus. The formation of sister clade of suspected hybrid with native C. batrachus and C. gariepinus confirmed the occurrence of hybridization of C. batrachus and C. gariepinus in Bangladesh, which validated the results based on COI gene.3). The results showed that sequenced suspected hybrid formed sister taxa with the sequenced C. gariepinus. The native C. batrachus formed a clade with C. batrachus of originated from different countries (Nigeria, France, Germany, and Malaysia) except suspected hybrid and C. gariepinus. The formation of sister clade of suspected hybrid with native C. batrachus and C. gariepinus confirmed the occurrence of hybridization of C. batrachus and C. gariepinus in Bangladesh, which validated the results based on COI gene.
References
- Linnaeus, C. Systema Naturae: Per Regna Tria Naturae, Secundum Classes, Ordines, Genera, Species, Cum Characteribus, Differentiis, Synonymis, Locis; Editio decima, reformata ; Laurentius Salvius: Stockholm, Sweden, 1758; Volume 1, p. 824.
- Lakra, W.S.; Goswami, M.; Gopalakrishnan, A. Molecular identification and phylogenetic relationships of seven Indian Sciaenids (Pisces: Perciformes, Sciaenidae) based on 16S rRNA and cytochrome c oxidase subunit I mitochondrial genes. Mol. Biol. Rep. 2008, 36, 831–839.
- Pouyaud, L.; Paradis, E. The phylogenetic structure of habitat shift and morphological convergence in Asian Clarias (Teleostei, Siluriformes: Clariidae). J. Zool. Syst. Evol. Res. 2009, 47, 344–356.
- Rahman, A.K.A. Freshwater Fishes of Bangladesh, 2nd ed.; University of Dhaka: Dhaka, Bangladesh, 2005.
- Pradit, S.; Noppradit, P.; Goh, B.P.; Sornplang, K.; Ong, M.C.; Towatana, P. Occurrence of microplastics and trace metals in fish and shrimp from Songkhla Lake, Thailand during the COVID-19 pandemic. Appl. Ecol. Environ. Res. 2021, 19, 1085–1106.
- Sahoo, S.K.; Giri, S.S.; Sahu, A.K.; Ayyappan, S. Experimental Hybridization between Catfish Clarias batrachus (Linn.) x Clarias gariepinus (Bur.) and Performance of the Offspring in Rearing Operations. Asian Fish. Sci. 2003, 16, 157–166.
- Huang, C.F.; Lin, Y.H.; Chen, J.D. The use of RAPD markers to assess catfish hybridization. Biodivers. Conserv. 2005, 14, 3003–3014.
- Szyper, J.P.; Tamaru, C.S.; Howerton, R.D.; Hopkins, K.D.; Fast, A.W.; Weidenbach, R.P. Maturation, Hatchery and Nursery Tech-Niques for Chinese Catfish, Clarias fuscus, in Hawaii. Aquaculture Extension Bulletin Summer 2001, UNIHJ-SEAGRANT-AB-01-01. Available online: http://citeseerx.ist.psu.edu/viewdoc/download?doi=10.1.1.548.9712&rep=rep1&type=pdf (accessed on 11 October 2021).
- Na-Nakorn, U.; Kamonrat, W.; Ngamsiri, T. Genetic diversity of walking catfish, Clarias macrocephalus, in Thailand and evidence of genetic introgression from introduced farmed C. gariepinus. Aquaculture 2004, 240, 145–163.
- Froese, R.; Pauly, D. (Eds.) Clarias batrachus. Available online: https://www.fishbase.org/summary/Clarias-batrachus.html (accessed on 11 October 2021).
- Adan, R.I.Y. Catfish culture in Southeast Asia. SEAFDEC Asian Aquac. 2000, 22, 16–17.
- Thakur, N.K. A biological profile of African catfish Clarias gariepinus and impact of its introduction in Asia. In Fish Genetics and Biodiversity Conservation; Ponniah, A.G., Das, P., Verma, S.R., Eds.; Natcon Publications: Muzzafarnagar, India, 1998; pp. 275–292.
- Rahman, M.A.; Bhadra, A.; Begum, N.; Islam, M.S.; Hussain, M.G. Production of hybrid vigour through crossbreeding between Clarias batrachus Lin. and Clarias gariepinus Bur. Aquaculture 1995, 138, 125–130.
- Welcomme, R.L.; Vidthayanon, C. The Impacts of Introduction and Stocking of Exotic Species in the Mekong Basin and Policies for Their Control; MRC Technical Paper; Mekong River Commission: Phnom Penh, Cambodia, 2003; p. 65.
- DOF (Department of Fisheries). Matshya Pakkhya Saranika; Department of Fisheries, Ministry of Fisheries and Livestock: Dhaka, Bangladesh, 2014; p. 208.
- Khedkar, G.D.; Anita, D.; Rushidkumar, N.; Shinde, D.; Haymer, D. High rates of substitution of the native catfish Clarias batrachus by Clarias gariepinus in India. Mitochondrial DNA Part A 2016, 27, 569–574.
- Hebert, P.D.; Ratnasingham, S.; de Waard, J.R. Barcoding animal life: Cytochrome c oxidase subunit 1 divergences among closely related species. Proc. Biol. Sci. 2003, 270, S96–S99.
- Parvez, I.; Mahajebin, T.; Clarke, M.; Chhanda, M.S.; Sultana, S. Genetic variation of native and introduced climbing perch, Anabas testudineus (Bloch, 1792) derived from mitochondrial DNA analyse. Ecol. Genet. Genom. 2020, 17, 100067.
- Abbas, E.M.; Soliman, T.; El-Magd, M.A.; Farrag, M.M.S.; Ismail, R.F.; Kato, M. Phylogeny and DNA Barcoding of the Family Sparidae Inferred from Mitochondrial DNA of the Egyptian Waters. J. Fish. Aquat. Sci. 2017, 12, 73–81.
- Basheer, V.S.; Vineesh, N.; Bineesh, K.K.; Kumar, R.G.; Mohitha, C.; Venu, S.; Kathirvelpandian, A.; Gopalakrishnan, A.; Jena, J.K. Mitochondrial signatures for identification of grouper species from Indian waters. Mitochondrial DNA Part A 2017, 28, 451–457.
- Chandra, S.; Barat, A.; Singh, M.; Singh, B.K.; Matura, R. DNA barcoding of Indian coldwater fishes of genus Schizothorax (Family: Cyprinidae) from western Himalaya. J. Fish. Mar. Sci. 2012, 4, 430–435.
- Malakar, A.K.; Lakra, W.S.; Goswami, M.S.; Minhra, R.M. Molecular identification of three Ompok species using mitochondrial COI gene. Mitochondrial DNA 2012, 23, 20–24.
- Wong, L.L.; Peatman, E.; Lu, J.; Kucuktas, H.; He, S.; Zhou, C.; Na-nakorn, U.; Liu, Z. DNA barcoding of catfish: Species authentication and phylogenetic assessment. PLoS ONE 2011, 6, e17812.
- Kochzius, M.; Seidel, C.; Antoniou, A.; Botla, S.K.; Campo, D.; Cariani, A.; Vazquez, E.G.; Hauschild, J.; Hervet, C.; Hjorleifsdottir, S.; et al. Identifying fishes through DNA barcodes and microarrays. PLoS ONE 2010, 5, e12620.
- Zhang, J.; Hanner, R. Molecular approach to the identification of fish in the South China Sea. PLoS ONE 2012, 7, e30621.
- An, H.S.; Kim, M.J.; Lee, J.W.; Lee, W.O. Molecular identification of Korean catfish (Siluriformes) based on two genetic markers. Genes Genet. 2012, 34, 695–702.
- Pallavi; Goswami, M.; Nautiyal, P.; Malakar, A.K.; Nagpure, N.S. Genetic divergence and molecular phylogenetics of Puntius spp. based on the mitochondrial cytochrome b gene. Mitochondrial DNA 2012, 23, 477–483.
- Tamura, K.; Stecher, G.; Peterson, D.; Filipski, A.; Kumar, S. Molecular Evolutionary Genetics Analysis version 6.0. Molecular Biology and Evolution. Mol. Biol. Evol. 2012, 30, 2725–2729.