Your browser does not fully support modern features. Please upgrade for a smoother experience.
Please note this is a comparison between Version 1 by Asrat Asfaw and Version 2 by Rita Xu.
Anthracnose disease caused by a fungus Colletotrichum gloeosporioides is the primary cause of yield loss in water yam (Dioscorea alata), the widely cultivated species of yam. Resistance to yam anthracnose disease (YAD) is a prime target in breeding initiatives to develop durable-resistant cultivars for sustainable management of the disease in water yam cultivation.
- Dioscorea spp.
- greater yam
- genetic map
- marker–trait association
1. Introduction
Yam (Dioscorea spp.) is a multi-species monocotyledonous crop widely grown in the tropics and subtropics [1]. It is the most valuable crop in West Africa, where its cultivation began 11,000 years ago [2]. Of the over 600 yam species, water yam (D. alata) is an extensively cultivated species worldwide [3]. In Africa, white Guinea yam (D. rotundata) is the most cultivated yam species, followed by water yam [3]. Yam production in West Africa is mainly by smallholder farmers, making it a significant source of farm employment and income for this group. In addition, yam plays a vital role in traditional medicine and the socio-cultural life of the people as it is involved in many key life ceremonies [4].
Water yam possesses several valuable attributes for cultivation and consumption. These include high multiplication ratio, early vigor for weed smothering, the higher genetic potential for yield (especially under low to average soil fertility), low post-harvest losses, good processing quality, and high nutritional value, including its possession of low glycemic index [5][6][5,6]. However, anthracnose disease caused by the Colletotrichum gloeosporioides (Penz) is the most limiting factor affecting the productivity of water yam by devastating all parts of the yam plant at every developmental stage, including leaves, stems, tubers, and seeds in many regions of the world [7][8][7,8]. Anthracnose causes mild to acute leaf necrosis, premature leaf abscission, and shoot die-back [9]. Severe infections result in defoliation, leaving naked, black, and drying vines [10]. Yield losses from the disease of up to 90% have been reported under severe conditions on different cultivars of water yam in Africa [10][11][12][10,11,12]. High genetic and pathogenic variances have been reported among isolates of C. gloeosporioides from different geographical locations [7][13][14][7,13,14], suggesting a high probability of the geographic variation in strains, some of which could be overcome existing resistance [15].
Cultural control approaches such as the use of disease-free planting materials, adjustment of plant spacing and planting dates, burying infected plant residues in the soil immediately after harvesting, intercropping, crop rotation with non-host crops, and fallowing have been used in other plant pathosystems to reduce pathogen inoculum in the field, delay disease onset, or slow disease progress [16][17][16,17]. Nonetheless, these disease management practices have not been effective for controlling anthracnose disease in water yam or result in a substantial increase in tuber yield [8], especially in disease-endemic areas. Additionally, biological control to impede or out-compete the multiplication and spread of virulent C. gloeosporioides strain in yam fields has been limited [18]. Chemical control can be an effective disease management approach. Still, most yam producers are smallholder growers and may not have the prerequisite technical support and finance to afford the use of fungicides [19].
Furthermore, inappropriate use of fungicides could potentially result in the development of resistant C. gloeosporioides strains to systemic fungicides [20] as well as detrimental environmental effects. Therefore, the best control option is developing and deploying cultivars with durable resistance to anthracnose. Substantial progress has been made to develop anthracnose resistant water yam varieties at the International Institute of Tropical Agriculture (IITA), Nigeria, and national agricultural research systems in West Africa and elsewhere through conventional breeding using phenotypic observations [3][21][3,21]. Anthracnose-resistant cultivars of yam such as TDa1425 and TDr2040 were identified at IITA [22]. In India, laboratory and field investigations also found highly resistant D. alata lines [23]. However, this effort is arduous and considerably slow due to the crop’s heterozygous and vegetatively propagated nature [24]. Genomics-informed breeding techniques such as molecular marker-assisted breeding and genomic selection would accelerate efforts in introgressing anthracnose resistance into preferred genetic backgrounds [3].
Earlier investigations on anthracnose disease in water yam showed that resistance is likely dominant and quantitatively inherited [25]. Efforts have also been made to identify QTL controlling yam anthracnose disease (YAD) using low-throughput molecular markers and less dense or unsaturated genetic maps such as Amplified fragment length polymorphism (AFLP) markers [5][26][5,26] and Expressed Sequence Tag—Simple Sequence Repeats (EST-SSRs) [27][28][29][27,28,29]. Prospects for locating additional QTLs and applying molecular breeding methods in water yam improvement programs are up-and-coming, mainly due to advances in next-generation sequencing and the recent development of the reference genome sequence of D. rotundata and D. alata.
2. Phenotypic Variability
Significant differences (p < 0.05) were observed for the reaction of the progenies to YAD in both years (Table 1). The mean squares for the year and genotype-by-year interaction effects were highly significant (p < 0.01). The disease pressure was higher in 2018 compared to 2017. The area under disease progression curve (AUDPC) estimates ranged from 210.0 to 397.5 with an average of 245.5 in 2017, while the range was from 233.4 to 482.1 with an average of 299.8 in 2018. None of the recombinant clones demonstrated immune or highly resistant (mean severity score of 1, equivalent to AUDPC value <105) or highly susceptible (mean severity score of 5, the equivalent of AUDPC > 525) reaction to natural field infestation by anthracnose disease. However, most of the genotypes (67–92%) expressed moderate resistance to anthracnose. Broad sense heritability was high (70.64%).
Table 1. Mean squares and heritability estimate for yam anthracnose disease severity in the mapping population.
| Average SNP Distance | Maximum Gap | |||
|---|---|---|---|---|
| Chr1 | 80 | 80.93 | 1.95 | 5.00 |
| 4.51 | −2.56 | 10.596 | 19.217 |
The QTL region linked to YAD resistance on chromosome 7 has known genes in plant biotic stress such as DRNTG_08663.1 (GDSL-like Lipase/Acylhydrolase), DRNTG_08664.1 (Protein kinase domain), and DRNTG_23336.1. Additionally, the regions within the Qyad-15 locus were related to the N-terminal α/β domain gene DRNTG_14305.1. The vicinity of Qyad-18 showed genes that code for ANTH domain Putative clathrin assembly protein (DRNTG_18245.1) and WD domain–WD40 repeat-containing protein (DRNTG_29617.1).
Interaction among the four QTLs related to YAD resistance revealed significant (p < 0.05) QTL by QTL interaction for Qyad-7-1 and Qyad-15, Qyad7-2 and Qyad-18. In contrast, no significant variation was observed among all other QTL combinations (Table 4). Of the four QTLs related to YAD resistance, three were stable over the years and showed non-significant QTL by environment interaction (Table 5).
Table 4. Interactions among the detected QTL.
| Marker Interactions | df | MS | p-Value | Adjusted R-Squared | |||||||||
|---|---|---|---|---|---|---|---|---|---|---|---|---|---|
| 33.7 | DRNTG_08663.1 | ||||||||||||
| Chr2 | 84 | 109.17 | |||||||||||
| Qyad-7-1: QTL-7-2 | 1 | 55.9 | 0.835 | 0.04147 | |||||||||
| 1.28 | 6.01 | ||||||||||||
| QTL-7-2 | 7 | 19.21 | 5.28 | −5.98 | 10.596 | 19.218 | 29.54 | DRNTG_08664.1, DRNTG_23336.1 | |||||
| Qyad-7-1: Qyad-15 | 1 | 5303.5 | 0.0456 * | 0.02544 | Chr3 | 115 | 64.63 | 0.56 | 4.48 | ||||
| Qyad-15 | 15 | 28.80 | 4.43 | −10.12 | 10.171 | 28.817 | 30.90 | DRNTG_14305.1 | |||||
| Qyad7-1: Qyad-18 | 1 | 155.2 | 0.734 | −0.0002131 | Chr4 | 520 | 92.32 | 0.16 | 8.26 | ||||
| Qyad-18 | 18 | 61.4 | 4.65 | −3.48 | 61.345 | 61.432 | 39.40 | DRNTG_18245.1, DRNTG_29617.1 | Chr5 | 199 | 109.19 | 0.50 | 7.71 |
| Chr6 | 191 |
Chr: chromosome; pos: position; LOD: logarithm of odds score; CI: confidence interval; R2
| QTL-7-2: Qyad-15 | |||||
| 1 | 2580.7 | 0.158 | 0.04395 | ||
| Qyad-7-2: Qyad-18 | 1 | 6341.0 | 0.026 * | 0.06074 | |
| 109.52 | |||||
| Qyad-15: Qyad-18 | 1 | 1408.4 | 0.57 | 0.309 | 5.54 |
| −0.01079 | Chr7 | ||||
| Qyad-7-1: QTL-7-2: Qyad-15: Qyad-18 | 127 | 3 | 59.84 | 1247.7 | 0.48 |
| Mean Squares | CV | Broad Sense Heritability | |||
|---|---|---|---|---|---|
| Trait | Genotype | Year | Genotype × Year | (%) | (%) |
| AUDPC | 163.01 * | 2190.01 ** | 3371.8 *** | 17.6 | 70.64 |
AUDPC: area under disease progression curve; *, **, *** significance at 0.05, 0.01, and 0.001 p-values, respectively; CV: coefficient of variation.
3. SNP Filtering
Total of 15,936 SNP markers were identified in the parental individuals and mapping population. Filtering for minor allele frequency (MAF < 0.05), low depth sequencing (< 5), and polymorphism between the parents TDa0500015 and TDa9900048 reduced the number of SNPs to 7583 SNPs (47.6% of the raw SNPs identified). Further filtering for 20% missing data (both for the SNP and genotype) and segregation distortion with chi-square test identified 3257 informative markers and 179 individuals out of 204 progenies with good coverage for linkage map construction. Pairwise recombination fractions calculated for all informative markers showed high SNP markers ordering across the different linkage groups.
4. Linkage Mapping
A genetic map was constructed that covered all 20 linkage groups of the water yam genome (Figure 1) with a total genetic distance of 1460.94 cM. The marker order on the linkage map showed perfect genetic recombination as the recombination fraction of the mapped SNP markers on linkage groups displayed a perfect alignment with no half circles between the recombination fraction and the LOD score. The linkage map had an average of 163 markers per linkage group or chromosome, with the highest SNP markers mapped on linkage 5. Linkage groups 6, 5, and 2 were the longest with 109.52, 109.19, and 109.17 cM, respectively, while linkage group 19 was the shortest with 33.08 cM (Table 2). The genetic gap map intervals ranged from 2.03 and 9.07 cM on chromosomes 19 and 16, respectively (Table 2).
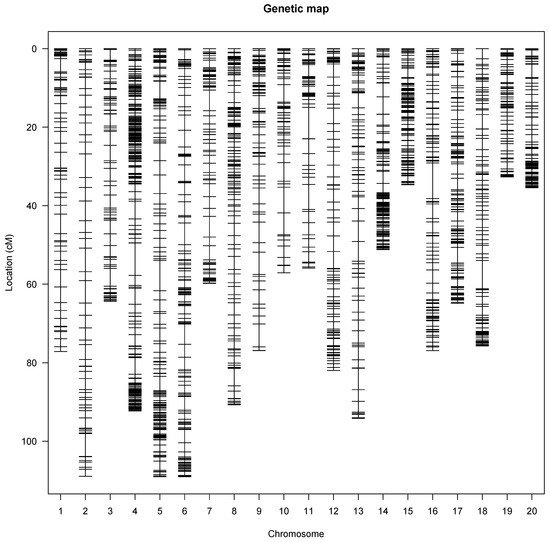

Figure 1. Genetic linkage map showing the SNP distribution across the 20 yam chromosomes. Each vertical line represents a yam chromosome with genetic distance in Kosambi units (cM).
Table 2.
Distribution of SNP markers and linkage group length (cM) in each chromosome.
| Chromosomes | Number of SNPs | Chromosome Length (cM) | ||
|---|---|---|---|---|
| 5.26 | ||||
| 0.068 | ||||
| 0.04413 | ||||
| Chr8 | 200 | 91.39 | 0.48 | 4.44 |
| Chr9 | 124 | 77.12 | 0.62 | 5.80 |
| Chr10 | 104 | 57.13 | 0.55 | 5.52 |
| Chr11 | 85 | 55.95 | 0.66 | 7.94 |
| Chr12 | 125 | 83.22 | 0.65 | 4.30 |
| Chr13 | 116 | 95.55 | 0.78 | 5.47 |
| Chr14 | 208 | 51.447 | 0.25 | 4.40 |
| Chr15 | 180 | 34.70 | 0.18 | 2.39 |
| Chr16 | 139 | 77.16 | 0.61 | 9.07 |
| Chr17 | 208 | 67.44 | 0.31 | 3.95 |
| Chr18 | 129 | 75.71 | 0.54 | 7.23 |
| Chr19 | 111 | 33.09 | 0.28 | 2.03 |
| Chr20 | 139 | 35.48 | 0.23 | 3.41 |
| Total | 3184 | 1,460.98 |
5. QTL Identification
The QTLs detected on three chromosomes out of the 20 are presented in Table 3 and Figure 2. Two significant QTLs were detected on chromosome 7 at position 10.60 cM (between 10.596 and 19.217 cM). This QTL (Qyad-7-1) had a LOD score of 4.51 and accounted for 33.7% of the total phenotypic variation in anthracnose severity score (Table 3, Figure 2). The second QTL located on chromosome 7 (Qyad-7-2) was at position 19.21 cM (between 10.596 and 19.218 cM) at LOD score of 5.28 and accounted for 29.54% of the total phenotypic variation in anthracnose severity score. The 3rd significant QTL, Qyad-15, which explained 30.90% of the total phenotypic variance with a LOD score of 4.43 was detected at 28.80 cM on chromosome 15. The QTL on chromosome 18 (Qyad-18) was at position 61.4 cM (between 61.345 and 61.432 cM) at LOD score of 4.65 and contributed 39.40% of the total phenotypic variance. For the four markers associated with the YAD, the favorable alleles were contributed by TDa0500015 tolerant to the YAD.
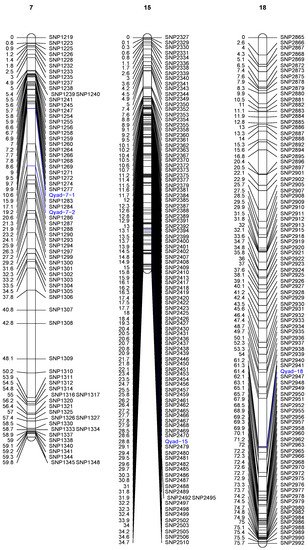

Figure 2. Genetic map of water yam showing significant QTLs associated with yam anthracnose disease resistance. Only those chromosomes where significant QTL are located are displayed. The identified QTLs are highlighted in blue on each chromosome.
Table 3.
Summary of significant QTLs detected for yam anthracnose disease resistance in water yam.
| Markers | Chr | Pos (cM) | LOD | Add/Dom | CI. Low | CI. High | R | 2 | (%) | Putative Genes |
|---|---|---|---|---|---|---|---|---|---|---|
| Qyad-7-1 | 7 | 10.60 |
df: degree of freedom; MS: mean square; * statistical significance at p-value 0.05.
Table 5. QTL by environment analysis considering the major QTL.
| Sum Sq | Mean Sq | F Value | |
|---|---|---|---|
| Year | 174,125 | 87,062 | 370.9525 |
| Qyad-7-1 | 12.25 | 12.25 | 0.0002 *** |
| QTL-7-2 | 101 | 101 | 0.0003 *** |
| Qyad-15 | 129 | 129 | 0.0001 *** |
| Qyad-18 | 2.6 | 2.6 | 0.0002 *** |
| Year × Qyad-7-2 | 275 | 112 | 0.789ns |
| Year × QTL-7-2 | 342 | 78 | 0.02 * |
| Year × Qyad-15 | 278 | 110 | 0.226ns |
| Year × Qyad-18 | 178 | 89 | 0.567ns |
MS: mean square; TPVE: total phenotypic variation estimation; ns: non-significant; *, *** statistical significance at p values 0.05 and 0.001, respectively.
6. Marker Effect
The presence of allele T for loci Qyad-7-1 and Qyad-7-2 appeared to lower the AUDPC score in the evaluated population, while the presence of the alleles C tended to increase the disease score, especially with Qyad-7-2 with p-value = 0.03 (Figure 3 and Figure 4). For QTLs detected on chromosomes 15 and 18, allele A of the variant AG/GA was associated with a higher AUDPC value while allele G linked with the lower AUDPC value in the population (Figure 5 and Figure 6).
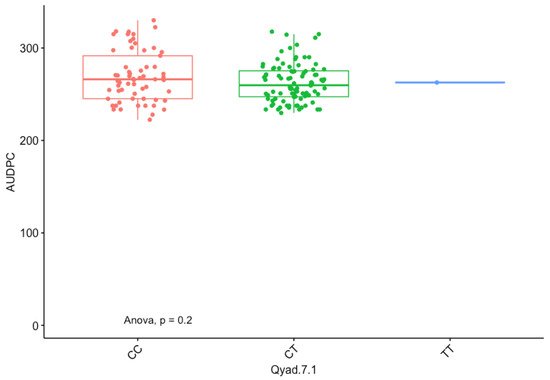
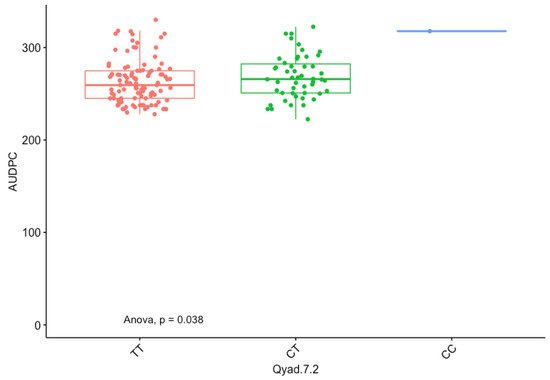
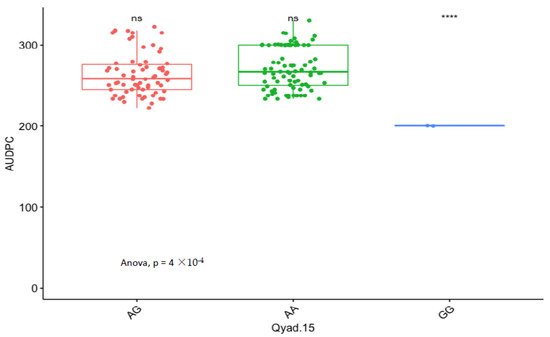
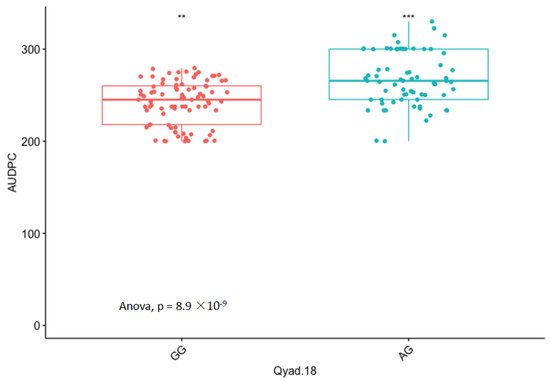

Figure 3. The boxplot showing the effect of the different alleles (variants) of Qyad-7-1 on the AUDPC values. The letters on the X-axis represent alleles (CC, CT, and TT).

Figure 4. The boxplot displaying the effect of the different alleles (variants) of Qyad-7-2 on the AUDPC estimates. The letters on the X-axis represent alleles (CC, CT, and TT).

Figure 5. Comparison of the effects of the different alleles (variants) of Qyad-15 on the AUDPC estimates in the study population. The letters on the X-axis represent alleles (AA, AG, and GG), **** statistical significance at p values 0.0001 while ns is non-significant.

Figure 6. Comparisons of allelic effects of the QTL Qyad-18 on AUDPC estimates in the study population. The letters on the X-axis represent alleles (AG and GG), ** and *** are statistical significance at p values 0.05 and 0.001.
