Your browser does not fully support modern features. Please upgrade for a smoother experience.
Please note this is a comparison between Version 2 by Camila Xu and Version 1 by Rafael Neto Ferreira.
Fall risk assessment based on wearable sensors can be performed from a long-term perspective, in which sensor data is used to predict subject’s long-term fall risk based on clinical scale scores, or from a short-term approach, where data collected is used to detect pre-fall/unbalanced situations in real-time and consequently identify fall risk events.
- fall risk assessment
- fall prediction
- wearable sensors
1. Introduction
Falls consistently rank as the second main cause of unintentional injury deaths worldwide [1]. About 684,000 fatal falls and an estimated 37.3 million non-fatal falls, which require medical attention, occur each year. The elderly aged 60 and over have the highest fall risk due to their increasingly reduced cognitive, physical, and sensory status [1]. Therefore, there is a major need to develop tools that enable the assessment of the fall risk of targeted aged populations in order to suggest evidence-based treatment interventions towards a safer gait and, consequently, lower the fall risk.
In the last years, fall-related research has increased its focus towards fall prediction relative to fall detection. While fall detection systems aim at alerting the subject and healthcare professionals whenever a fall takes place, fall prediction systems warn subjects before the fall event occurs [2]. Therefore, as fall prediction helps preventing the fall occurrence, it further reduces the harmful consequences of a fall. Furthermore, fall risk assessment systems, which are built to predict future falls, pave the way for an efficient fall prediction [3]. In this regard, fall risk assessment methods using different wearable sensory systems have been developed in order to provide quantitative measures towards an objective assessment of the risk of fall [4,5,6,7]. Fall risk assessment based on wearable sensors can be performed from a long-term perspective, in which sensor data is used to predict subject’s long-term fall risk based on clinical scale scores [8,9], or from a short-term approach, where data collected is used to detect pre-fall/unbalanced situations in real-time and consequently identify fall risk events [4,5]. Sensor-based fall risk assessment tackles some issues related to more traditional approaches to assess the fall risk, which mainly consist of qualitative, subjective, and oversimplified clinical scales or questionnaires [7,8,9,10]. Nevertheless, this sensor-based assessment is normally performed in supervised conditions, in which the behaviour adopted by test subjects may not be representative of the one adopted in the everyday life, as the subjects might be performing their “best effort” during the experimental tasks [11]. As fall events occur generally in an unpredictable fashion during the everyday life context, there is the need to assess the fall risk in uncontrolled conditions. An unsupervised fall risk assessment using wearable sensors would provide continuous monitoring during daily functional tasks and thus reflect subject’s real fall risk. Thus, the interest on wearable sensors has been increasing considering the monitoring of the fall risk among the elderly community. These wearable devices benefit from their wide range of products in the market, small size, as well as the meaningful data they provide while being an alternative low cost solution [6,7].
As mentioned in some previous review articles [2,3], reliable fall prediction and prevention require a multifactorial analysis according to the large amount of different factors that can cause fall events. Therefore, in order to build a reliable fall risk assessment system, both intrinsic and extrinsic factors have to be considered in the analysis. As reported by Rajagopalan et al. [2], intrinsic fall factors include characteristics inherently related to the subject such as its mobility impairments, neurological disturbances, age, or fall history. On the other hand, extrinsic factors are generally related to the environment in which the subject is inserted and account for inappropriate footwear, clutter, slippery surfaces, or poor lighting. Therefore, the complex interaction between biological, environmental, demographic, and behavioural fall risk factors require framework solutions that enable the integration of both contextual data regarding the environment and subject’s behaviours as well as physiological health information [2]. Indeed, literature studies have been exploring various kinds of statistically different features between fallers and non-fallers, which may have the potential to be monitored in fall risk assessment systems. Beyond the most common use of metrics extracted from kinematic and kinetic sensors to assess the risk of falling [6], other approaches included biosignal analysis by means of cardiovascular [12], electromyography [5,13] or electroencephalography [13] data. Additionally, sleep quality metrics can be monitored within the scope of fall risk assessment [14].
Rajagopalan et al. [2] indicated that current fall prediction systems are generally tested in laboratory conditions, which do not reflect the real relationship between the fall risk factors. As such, laboratory testing of fall risk assessment systems does not address the real fall risk and may bias the ability to predict future falls in regard to daily life unsupervised testing conditions [11,15]. Concerning this validation process, Howcroft et al. [16,17] pointed out the concern between the use of retrospective (fall history) or prospective (future falls) fall data as the standard to evaluate the predictive accuracy of fall risk assessment systems. Shany et al. [18] stated that, although many studies did not consider prospective falls, there has been an observed effort in recent years to incorporate future fall occurrence in fall risk assessment. As fall risk assessment models are built to predict future falls, the use of prospective fall occurrence information during the follow-up period after the baseline assessment may be more appropriate to validate the performance of the models [17]. Furthermore, retrospective fall occurrence is associated with the imprecise recall of past fall events by the test subjects, which may hinder the retrospective assessment [19]. Moreover, in retrospective fall risk assessment, as subjects have experienced previous falls, they may walk in a cautious way during the assessment due to fear of falling, which would deviate them from their natural gait [16,17]. Fear of falling produces observable changes in the gait and muscular activity patterns, such as increased double-support time, reduced stride length, and increased levels and duration of muscle co-contraction, as subjects seek to adopt a more stable gait to avoid another fall [20,21,22]. This fear may also minimise the execution of daily life activities, which leads to physical inactivity and consequent social isolation. These factors significantly correlate to the decrease in muscle strength, physical performance, and ability to control the posture [20]. As such, fear of falling leads to gait, balance, and cognitive disorders over time, resulting in mobility deterioration and consequently increasing fall risk [23]. Therefore, fear of falling emerges as an important psychological parameter in fall risk assessment, as the detection of the consequent motion deterioration could allow the identification of high fall risk subjects [20].
2. Fall Risk Assessment Methods
As suggested in Figure 21, the 16 selected manuscripts were divided into groups according to the method used to assess fall risk.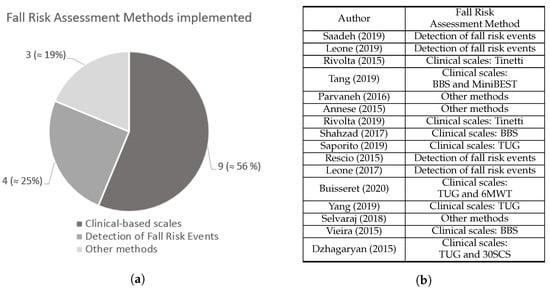
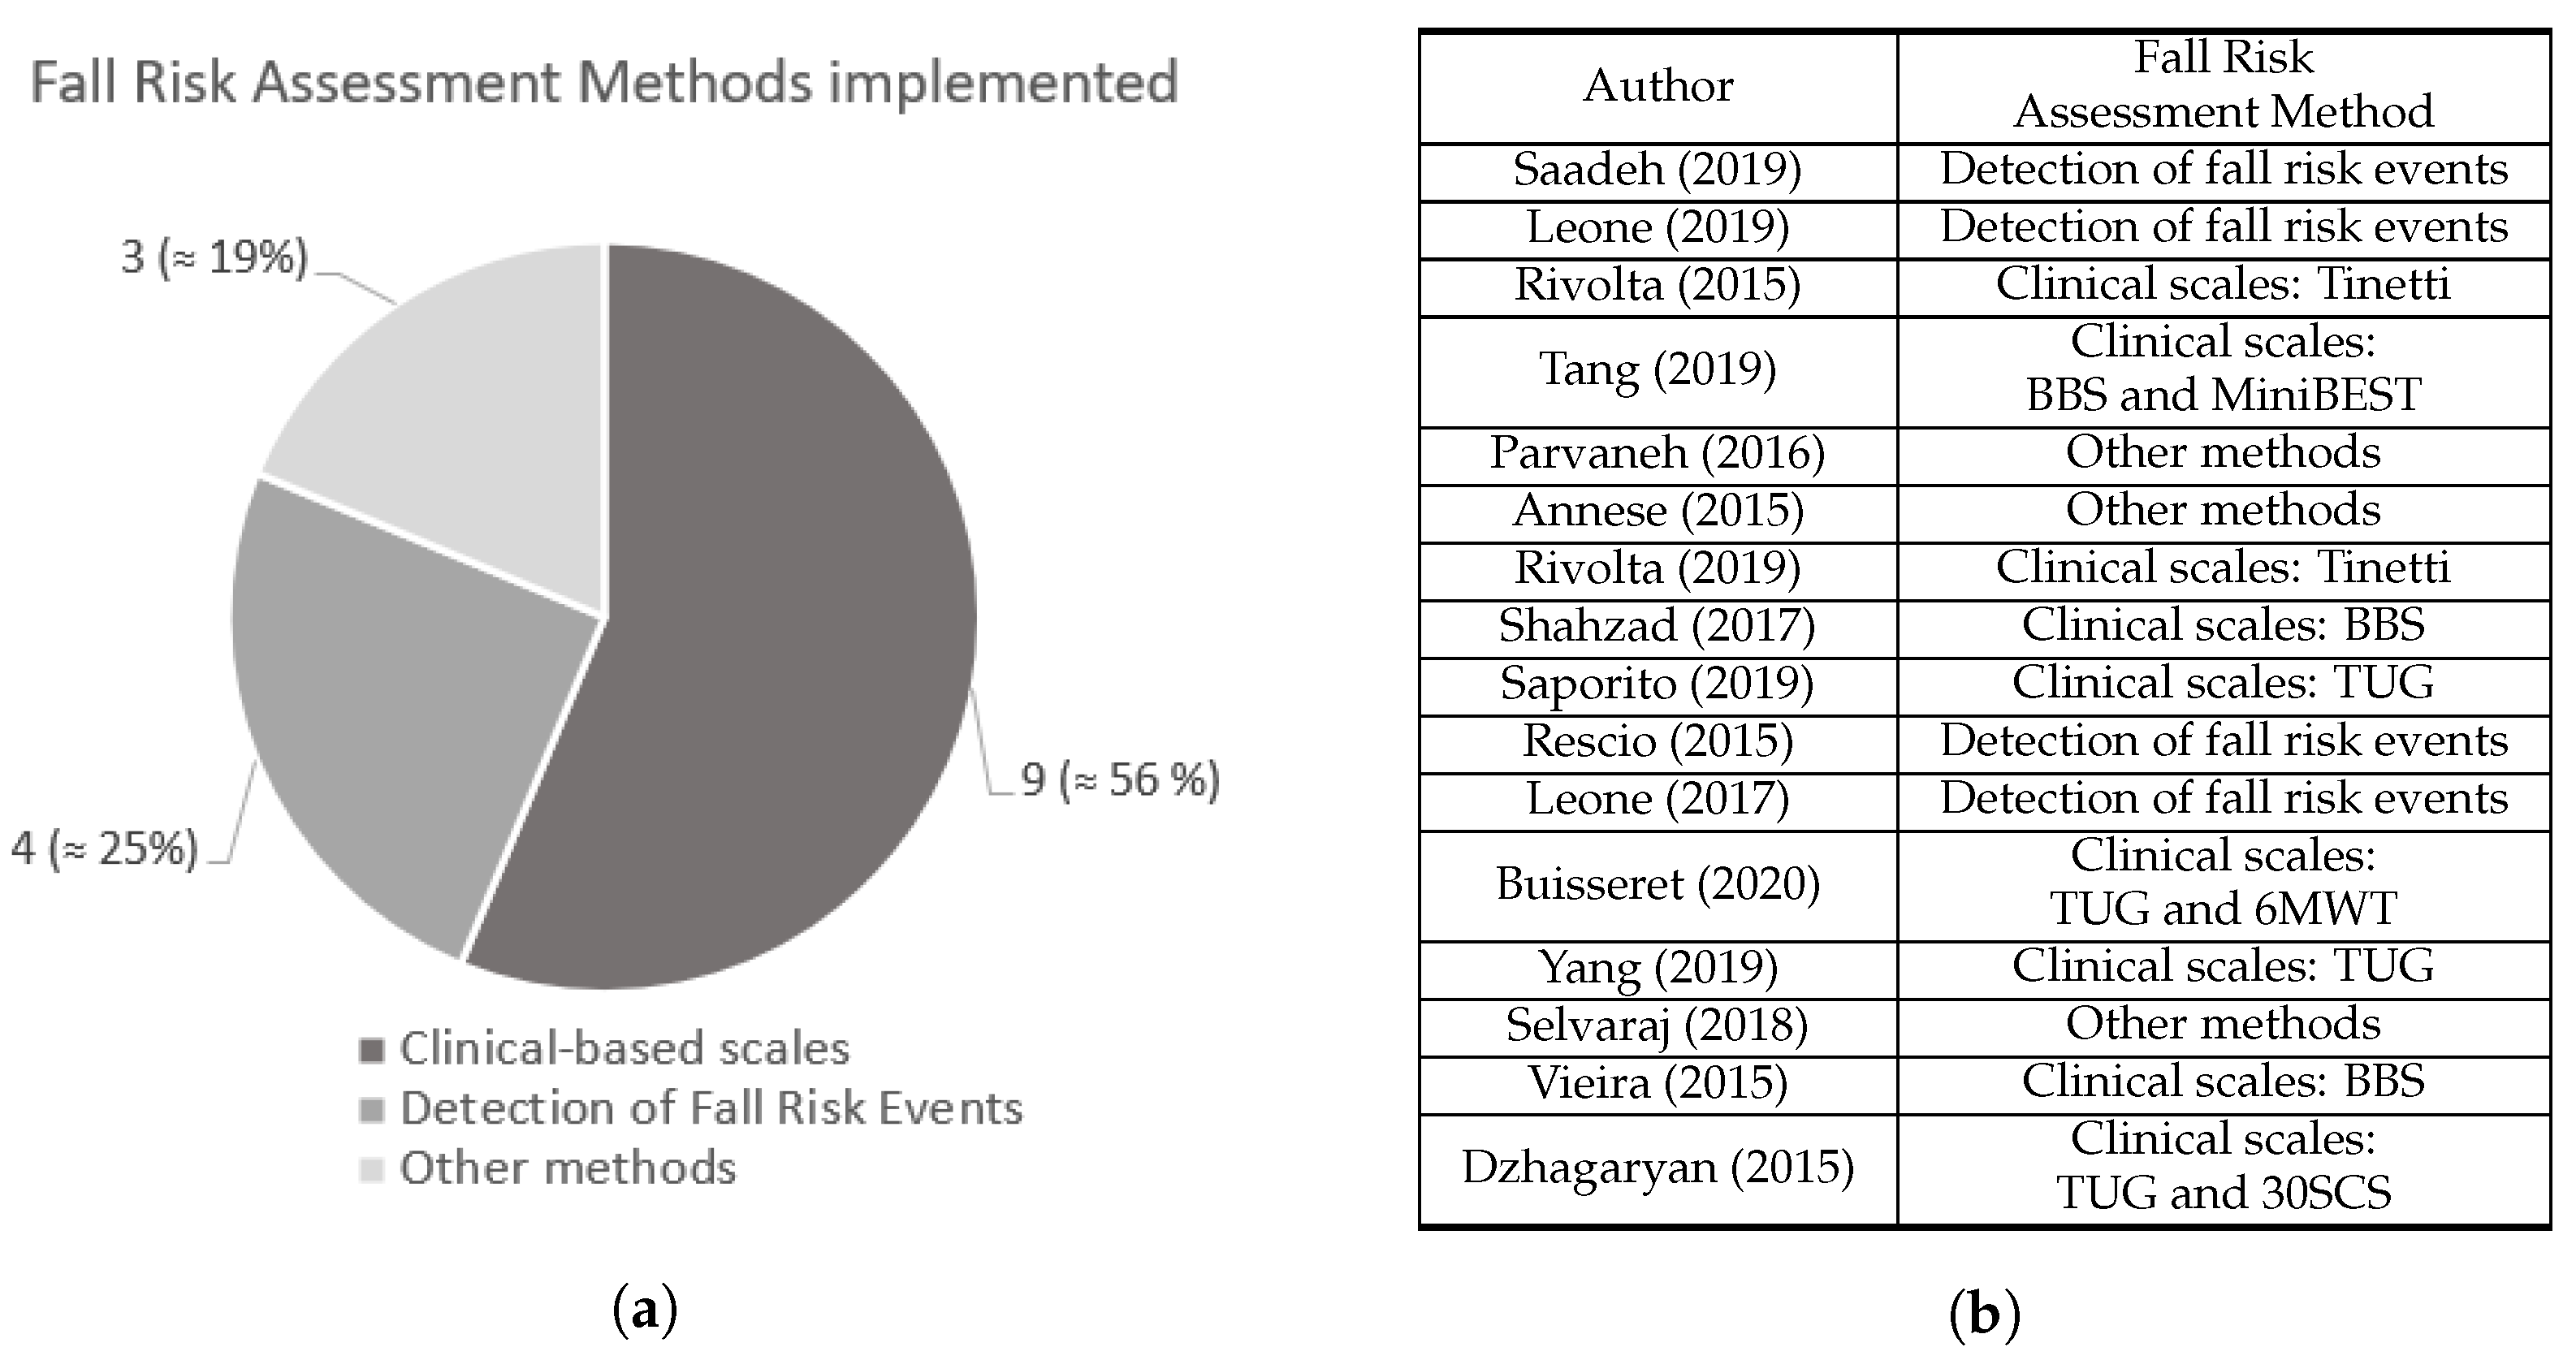 Figure 21. (a) Number of studies from each fall risk assessment methods identified. (b) Fall risk assessment method adopted by each study. Saadeh [4], Leone [5], Rivolta [8], Tang [9], Parvaneh [12], Annese [13], Rivolta [25], Shahzad [26], Saporito [27], Rescio [28], Leone [29], Buisseret [30], Yang [31], Selvaraj [32], Vieira [33], and Dzhagaryan [34].
2.1. Fall Risk Assessment Based on Clinical Scales
Vieira et al. [33] developed a gamified application for the elderly to independently measure the Berg Balance Scale (BBS) score at home by means of a custom-made sensor containing an accelerometer and a gyroscope. Shahzad et al. [26] estimated the BBS score from data acquired from a single accelerometer. Tang et al. [9] performed a study to obtain the BBS and MiniBEST test scores for each subject with a sensor apparatus composed by a SmartShoe, which comprised a pressure sensitive insole with three pressure sensors and an accelerometer, as well as an hip accelerometer. Yang et al. [31] conducted four environment-adapting TUGs in order to assess fall risk in a more comprehensive way than standard TUG by adapting gait in complex environments. During the trials, subjects wore a Smart Insole (SITUG) in each foot, with a sensing device composed by 16 pressure sensors array along with an Inertial Measurement Unit (IMU) including an accelerometer, gyroscope, and magnetometer. Saporito et al. [27] attempted to predict a remote TUG score based on data recorded from three days of free-living conditions by means of one accelerometer and one barometric sensor. Buisseret et al. [30] assessed subjects’ fall risk based on the TUG test score and data acquired from an accelerometer, a gyroscope and a magnetometer during the 6-minute walking test (6MWT). Dzhagaryan et al. [34] developed a wearable system, the Smart Button, capable of providing an automated mobility assessment of TUG and 30-second Chair Stand (30SCS) tests from data collected by an IMU with an accelerometer, a gyroscope and magnetometer sensors. In both studies conducted by Rivolta et al. [8,25], the Tinetti test score was predicted for each of the test subjects by means of data collected from a single accelerometer. Further details about the sensor systems used are provided in Figure 32.
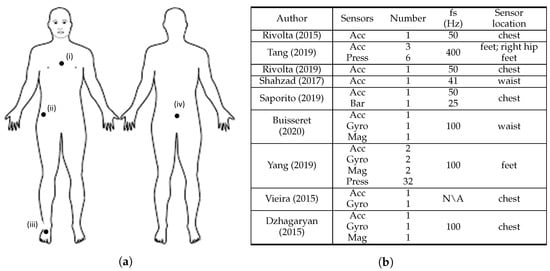
 Figure 32. Overview of the sensor characteristics from clinical scale-based fall risk assessment studies. (a) Anterior and posterior views of the human body depicting sensor location, where: (i) [8,25,27,33,34], (ii) [9], (iii) [9,31], and (iv) [26,30]. (b) Adopted sensor specifications, where: S = sensors, N = number, fs = sampling frequency, Acc = accelerometer, Gyro = gyroscope, Mag = magnetometer, Press = pressure sensors, Bar = barometer, Dist = distance sensors, N\A = Not Available. Rivolta [8], Tang [9], Rivolta [25], Shahzad [26], Saporito [27], Buisseret [30], Yang [31], Vieira [33], and Dzhagaryan [34].
Figure 32. Overview of the sensor characteristics from clinical scale-based fall risk assessment studies. (a) Anterior and posterior views of the human body depicting sensor location, where: (i) [8,25,27,33,34], (ii) [9], (iii) [9,31], and (iv) [26,30]. (b) Adopted sensor specifications, where: S = sensors, N = number, fs = sampling frequency, Acc = accelerometer, Gyro = gyroscope, Mag = magnetometer, Press = pressure sensors, Bar = barometer, Dist = distance sensors, N\A = Not Available. Rivolta [8], Tang [9], Rivolta [25], Shahzad [26], Saporito [27], Buisseret [30], Yang [31], Vieira [33], and Dzhagaryan [34].2.1.1. Sensor System Characteristics
Figure 32 summarises the sensor characteristics from the studies that performed fall risk assessment based on clinical scales.
All the studies used at least one accelerometer, which underlines the importance of the use of acceleration data to characterise the score results from clinical standard scales. The use of gyroscope sensors was highlighted in four articles [30,31,33,34]. This search revealed that accelerometers and gyroscopes were the most widely used sensors for this fall risk assessment method. The magnetometer sensor is also included in the sensing device of three studies [30,31,34] and is used along with both acceleremeter and gyroscope sensors. Beyond inertial sensors, pressure sensors were used in two studies [9,31]. Concerning the sensors’ sampling frequency, all the studies acquired data from sensors at 100 Hz or less except Tang et al. [9], which used 400 Hz, and Vieira et al. [33] that did not mention the frequency adopted. However, in the data processing stage, Tang et al. [9] downsampled data from 400 Hz to 25 Hz.
Most of the studies used a small number of three sensors or less. However, Tang et al. [9] and Yang et al. [31] used 9 and 38 sensors, respectively. In their setup, Yang et al. [31] used 32 pressure sensors and 2 IMU’s (with accelerometer, gyroscope, and magnetometer). Tang et al. [9] sensing apparatus consisted on six pressure sensors and three accelerometers. Within these manuscripts, almost all sensors were placed in the insole of the test subjects, thus the high amount of sensors did not compromise the wearability of the system. All the single sensor solutions that assessed fall risk through clinical-based scales used accelerometers [8,25,26]. The most widely used two-sensor combination for fall risk assessment is accelerometer and gyroscope, which is line with the search results of Rucco et al. [6]. In addition, four articles used the accelerometer and gyroscope combination [30,31,33,34], with Buisseret et al. [30] and Vieira et al. [33] using only data from those two sensing modalities.
Furthermore, five studies described the sensor placement on the chest [8,25,27,33,34], two on the waist/lower back [26,30], two on the feet [9,31] and one on the right hip [9]. Both studies that considered the feet to place the sensors used pressure sensors [9,31]. Additionally, eight studies [8,9,25,26,27,30,33,34] considered at least one upper body part to place the sensors, in which seven of them only considered upper body parts [8,25,26,27,30,33,34]. The chest and the lower back were the most used upper body locations. Therefore, the upper body contains the preferred locations to place the wearable sensors in fall risk assessment based on clinical scales.
2.1.2. Clinical-Based Scales Adopted
The variety of clinical-based scales adopted in the literature towards fall risk assessment is shown by the 6 different scales included in the group of 9 studies. TUG was the most selected scale [27,30,31,34] and BBS was the second most adopted [9,26,33]. The Tinetti test was implemented in both studies conducted by Rivolta et al. [8,25] and MiniBEST, 6MWT, and 30SCS were included in one study each [9,30,34]. In addition, three studies conducted two different clinical scales [9,30,34]. While the majority of the studies [8,9,25,30,31,33,34] collected data from activities performed during the clinical scales experimental protocols to assess fall risk, some collected data from activities outside the clinical scale protocols. For instance, Shahzad et al. [26] attempted to predict BBS score of test subjects by means of data collected during a routine which included a group of simple physical movement activities, namely the TUG test, five times sit-to-stand test, and alternate step test. Further, in Saporito et al. [27] data collected from subjects during 3 days of free-living conditions was used to predicted TUG time score.
2.1.3. Algorithms for the Classification of Fall Risk
In this fall risk assessment method, four studies implemented Machine Learning models [8,9,26,27], two considered a Deep Learning approach [25,30], two adopted threshold-based algorithms [30,33], and two studies did not perform this classification [31,34].
All four studies which applied Machine Learning used linear regression-based models to predict clinical scale scores. Shahzad et al. [26] used linear regression Machine Learning models to estimate the scores of the BBS test from the information provided by a single accelerometer positioned in the lower-back. In the same study, researchers opted to choose Machine Learning models that could be applied in small datasets and found that linear least square and LASSO regularised linear regression outperformed decision tree-based models, especially the LASSO one. Saporito et al. [27] also adopted a regularised linear model for the estimation of a TUG score, by means of signals collected from an accelerometer and a barometer in free living conditions for 3 days. Moreover, Rivolta et al. [8] applied a multiple linear regression model in order to predict the value of the Tinetti test scores assigned to the subjects by a clinician, using data obtained from a single sternum-mounted accelerometer. Tang et al. [9] applied a linear kernel support vector regression to predict clinical scores of BBS and MiniBEST from pressure and acceleration sensors data.
Some authors considered the use of Deep Learning [25,30]. Rivolta et al. [25] attempted to estimate the Tinetti test scores based on gait and balance features obtained from a single low cost acceleration sensor, considering a two-fold problem: (i) a binary classification problem to dichotomize individuals at score 18 as High and Low Fall risk; and (ii) a regression problem in order to estimate the gold standard Tinetti score assigned to each subject. Based on the performance results, the Artificial Neural Networks (ANN) provided better classification outcomes than the linear model.
Buisseret et al. [30] implemented a Deep Learning model, as well as a threshold-based algorithm in order to predict the risk of falls based on the TUG and 6MWT. Therefore, a 6-month prediction of subjects’ fall risk based on prospective fall occurrence as the start of the study was performed in three different classification ways: (i) a threshold-based approach considering only the time taken to complete standard TUG; (ii) another threshold-based approach (TUG+) considering the previously described time and kinematic parameters computed from IMU sensor data; and (iii) a Deep Learning Convolutional Neural Network (CNN) network that receives the raw IMU data only. The authors verified that both TUG+ and the Artificial Intelligence (AI) algorithm enhanced the performance in several classification metrics of the faller status of the subjects regarding the standard TUG alone. Vieira et al. [33] also implemented a threshold-based approach in order to assess the score of BBS through accelerometer and gyroscope measures. The researchers established reference values concerning each of the movements performed during the test in order to assign their respective classification. The works developed in [31,34] assessed the performance metrics of the features calculated by their systems against ground truth measures of video and optical motion capture system, respectively, rather than using algorithms to classify subject’s fall risk.
2.2. Fall Risk Assessment Based on the Detection of Fall Risk Events
Besides the clinical scale-based approach, four manuscripts [4,5,28,29] addressed fall risk assessment from a real-time perspective, focusing on the detection of fall risk events during the performance of activities. The details about the sensor systems used are presented in Table 1 (the table can be seen in the full text version of the review article). Saadeh et al. [4] used the data collected from an acceleration sensor to distinguish between ADLs and pre-fall events. Their system achieved a timely prediction of fall events, activating a fall risk alarm before the fall occurrence. Rescio et al. [28] described an EMG-based system composed by four EMG sensors capable of detecting and recognising fall risk events. Leone et al. [29] also presented a four EMG sensor-based fall risk assessment system capable of recognising pre-fall events. Later, the authors developed a smart sock system, each one equipped with two EMG sensors, able to detect unbalance events associated with a potential fall risk [5]. More details about the performance metrics obtained by these systems are further provided in Table 2 (the table can be seen in the full text version of the review article).
One important aspect analysed by each of the four studies was the lead-time. This time, which was used to study system’s detection performance of fall risk events, was considered with two different meanings. Saadeh et al.’s investigation [4], as well as both studies conducted by Leone et al. [5,29], evaluated detection performance of the system considering the lead-time as the time between the detection of the unbalance event and the impact of the fall. Saadeh et al. [4] mentioned that their system could predict a fall event with a lead-time between 300 ms and 700 ms before the fall impact. Leone et al. [29] claimed a mean lead-time of 775 ms of their system and, in a later study performed by the same authors [5], a smart sock EMG system was able to detect unbalance conditions with 750 ms of mean lead-time. However, Rescio et al. [28] interpreted lead-time from a different perspective, by considering it to be the time delay between the onset of the perturbation and the instant when the perturbation was detected. The authors claimed that their system was able to detect a perturbation 200 ms, on average, after its onset.
Table 1. Sensor characteristics from the fall risk assessment studies based on the detection of fall risk events, where: fs = sampling frequency, Acc = accelerometer.
| Author | Sensors | Number | Subjectsfs |
Subject’s Age (Hz) |
Model UsedSensor Location |
Validation MethodMean Lead-Time (ms) |
Reference MeasuresLead-Time Meaning |
|---|
| for Classification | Results |
|---|
| Saadeh [4] | Acc | 1 | 256 |
| Saadeh [4 | upper thigh | ] | 77300–700 | 20-70time between the detection | ML (NLSVM) | N\A | Type of event (pre-fall or normal ADL events). of the unbalance event and the impact of the fall |
|||||||
| Sens = 97.8%; | Spec = 99.1% | Leone [5] | EMG | 4 | 125 | gastrocnemius and tibialis muscles |
||||||||
| Leone [5 | 750 | ] | 5 | 28.7 ± 7.1 | ML (LDA) | Holdout (70% training; 30% testing) |
Type of event (pre-fall or normal ADL events).time between the detection of the unbalance event and the impact of the fall |
|||||||
| Accu = 82.3%; | Sens = 86.4 %; | Spec = 83.8% | Rescio [28] | EMG | 4 | 1000 | Leone [ | |||||||
| Rivolta [8] | 13 | 69.7 ± 10.7 | ML (multiple linear regression model)gastrocnemius and tibialis muscles |
Leave-one-out 200 |
CV | Clinical score (Tinetti)time difference between the perturbation onset and the detection of the perturbation |
Accu = 84.6% Sens = 85.7%; Spec = 83.3% |
29] | EMG | 4 | 1000 | gastrocnemius and tibialis muscles |
775 | time between the detection of the unbalance event and the impact of the fall |
Table 2. Validation characteristics adopted by the 11 selected articles, where: ML = machine learning, Th = threshold-based, Accu = accuracy, Sens = sensitivity, Spec = specificity, CV = cross-validation, NLSVM = NonLinear Support Vector Machine classifier, LDA = Linear Discriminant Analysis classifier, SVR = Support Vector Regression, ANN = Artificial Neural Networks, LLS = Linear Least Square Regression, LASSO = Least Absolute Shrinkage and Selection Operator regression, and CNN = Convolutional Neural Network.
| Author | Number of | |||||
|---|---|---|---|---|---|---|
| Tang [ | ||||||
| 9] | 30 | 76.0 ± 10.5 | ML (Linear kernel SVR) |
Leave-one-out CV |
Clinical score (BBS and MiniBEST) |
Mean error: 6.07 ± 3.76 (BBS); 5.45 ± 3.65 (MiniBEST) |
| Rivolta [25] | 90 | 69.3 ± 16.8 | ML (linear regression model); DL (single hidden layer ANN) |
Holdout (60% training; 40% testing) |
Clinical score (Tinetti) |
Sens (ML) = 71% Spec (ML) = 81% Sens (DL) = 86%; Spec (DL) = 90% |
| Shahzad [26] | 23 | 72.87 ± 8 | ML (LLS and LASSO models) |
10-fold CV | Clinical score (BBS) |
Mean error: 1.9 ± 2.53 (LLS); 1.44 ± 1.98 (LASSO) |
| Saporito [27] | 239 | 75.2 ± 6.1 | ML (regularised linear model) |
Leave-one-out CV |
Clinical score (TUG) |
Mean error: 2.1 ± 1.7s |
| Rescio [28] | 7 | 28.8 ± 7.6 | Th | 10-fold CV | Type of event (pre-fall or normal ADL events) |
Sens 70%; Spec 70% |
| Leone [29] | 15 | 32.6 ± 9.3 | ML (LDA) | 10-fold CV | Type of event (pre-fall or normal ADL events) |
Sens = 89.1%; Spec = 87.1% |
| Buisseret [30] | 73 | 83.0 ± 8.3 | Th; DL (CNN) | Holdout (78% training; 22% testing) |
Faller status based on prospective fall occurrence |
Accu(Th) = 73.9%; Sens(Th) = 85.7%; Spec(Th)= 50%; Accu(DL) = 75%; Sens(DL) = 75%; Spec(DL) = 75% |
| Yang [31] (*) | 10 | 19-44 | N\A | N\A | Video recordings from TUG |
Accu(gait cycle count) = 100% Accu(segment TUG phases) = 92.23% Accu(spatial—temporal features) = 92% |
(*) This study validated a system that extracted features from TUG rather than directly validate the system towards the classification of fall risk.
2.2.1. Sensor System Characteristics
Table 1 (the table can be seen in the full text version of the review article) depicts the sensor characteristics adopted in the studies that performed fall risk assessment based on the detection of fall risk events.
EMG-based systems were used in three studies [5,28,29] to detect pre-fall scenarios or unstable situations associated with fall risk. On the other hand, Saadeh et al. [4] described the detection of fall risk events based on accelerometer data. All the studies collected data using sampling frequencies higher than 100 Hz. All sensor systems were composed of four wearable sensors or less. A single-sensor solution comprised by one accelerometer was used in [4], two EMG sensors were used for each smart sock in [5], and a system with four EMG sensors was presented both in [28,29]. Saadeh et al. [4] placed the accelerometer sensor in the upper thigh. The three other studies placed EMG sensors in the gastronecmius and tibilias muscle groups. Leone et al. [5,29] specified the use of these sensors in the gastrocnemius lateralis and tibialis anterior muscles.
2.2.2. Types of Activities Performed
In order to collect data to identify fall risk events, the four studies performed ADL and fall events in the experimental protocol. Rescio et al. [28] instructed test subjects to simulate a series of events in a random order: (i) being at idle position or walking, both in either a normal context or presented with a deviant auditory stimuli; (ii) perform some common ADLs such as bending, lying down, standing up or sitting down; and (iii) unstable situations provoked by a tilting platform which simulated loss balance characteristic of fall events. Saadeh et al. [4] adopted an experimental protocol similar to the one performed to obtain the MobiFall dataset [35] and used the collected data along with the data from MobiFall dataset to train and test their system. A total of six different examples of falls and 11 ADL events were performed. ADLs included events that have a higher chance of being classified as false positives/falls such as: (i) jumping and jogging, as they are abrupt events that are alike to a fall event; (ii) stepping in a car or sitting on a seat; and (iii) performing standing or walking tasks and ascending or descending stairs. In addition, forward lying falls, back chair falls, front knees falls, and side falls were considered in the protocol. In [29], Leone and colleagues also developed a dataset consisting of ADLs and fall events to train and test their algorithm. Although the types of ADL performed were not specified in the study, the researchers mentioned that the falls were provoked through a movable platform to cause unstable events in the test subjects. In a later work performed by the same authors [5], simulated ADLs and fall events were conducted in order to acquire data to train and test their algorithm. Simulated ADLs included: (i) walking; (ii) sitting down on a chair; (iii) bending; and (iv) lying down on a mat. Additionally, forward, lateral, and backward falls were induced by the same movable platform described in [29].
2.2.3. Algorithms for the Classification of Fall Risk
Within the four studies that assessed fall risk from a real-time perspective based on the detection of fall risk events, three adopted Machine Learning models [4,5,29], whereas the remaining study used a threshold-based model [28].
Saadeh et al. [4] implemented a prototype system with two parallel real-time operating modes: slow mode fall detection (SMFD) and fast mode fall prediction (FMFP). In the FMFP mode, a nonlinear support vector machine classifier is used in order to predict fall events. This prediction is Patient Specific (PS) as, in the offline training stage of the classifier, PS parameters are computed and then uploaded to the system’s repository. Once those parameters are uploaded, they are used in the classification phase of fall prediction, adapting this process for each subject. Leone et al. [29] also implemented Machine Learning in order to distinguish between pre-fall and non pre-fall events. A linear discriminant analysis classifier was used to achieve a high generalisation capacity in the classification process while requiring low computational costs. Furthermore, in [5], Leone et al. used the same classifier to detect fall risk events using data collected from their developed smart EMG sock system. Rescio et al. [28] assessed the fall risk through a threshold-based approach as they had chosen the assurance of the system’s real-time operation rather than its generalisation ability.
2.3. Other Fall Risk Assessment Methods
There were other approaches also identified to assess the risk of fall. Selvaraj et al. [32] highlighted the importance of analysing the foot clearance during stair negotiation, as reduced values of this metric have an explicit mechanism linked to falls by increasing the chance of tripping. Therefore, the authors developed a wearable system for the subject’s shoe to determine the foot clearance during stair negotiation. The system was equipped with two distance sensors and an IMU sensor composed by an accelerometer, a gyroscope, and a magnetometer. Annese et al. [13] underlined the complexity of fall risk assessment and the need to perform it in a multifactorial approach in an everyday life monitoring scenario in order to accurately predict future falls. Hence, the same authors developed a cyber-physical system composed by EMG and EEG sensors interfaced to a Field-Programmable Gate Array (FPGA) responsible to perform an online processing of a subject’s fall risk coefficient. This fall risk index is based on a multifactorial approach considering the partial sum of four indexes namely, a subject condition or baseline factor, an environmental factor, an EMG co-contraction factor, and an EEG signal factor. While the first two factors, which are PS, are constant, the latter two are re-calculated just after a new step is detected during gait. Parvaneh et al. [12] explored the relationship between fall risk and the number of Premature Ventricular Contractions (PVC) episodes per hour, by using an ECG sensor.
2.4. System’s Validation
From the 16 selected studies, only 11 performed the validation of their fall risk assessment system [4,5,8,9,25,26,27,28,29,30,31]. As depicted in Table 2 (the table can be seen in the full text version of the review article), the validation carried out on the fall risk assessment systems varied across these different studies. The fall risk outcome of the system was compared against reference measures in order to compute the system’s performance metrics.
Seven studies [4,8,9,25,26,27,30] validated their fall risk assessment systems using data collected from elderly patients, while the remaining four manuscripts used data from young subjects [5,28,29,31]. In addition, the number of subjects enrolled in the experimental protocols was usually equal or below 30 subjects [5,8,9,26,28,29,31]. Only four studies [4,25,27,30] included data from more than 30 subjects in their validation process. Saadeh et al. [4] was the only study that performed an external validation, i.e., used data collected outside the study’s experimental protocol to validate the system. As well as the data collected from 20 subjects (aged between 65 and 70) within their study, these authors also used data from 57 subjects (aged between 20 and 47) from the MobiFall dataset [35]. The remaining studies performed only an internal validation, i.e., validate the system using only data collected within the same study.
Cross-Validation (CV) was the most used validation method using both K-fold [26,28,29] and Leave-one-out [8,9,27]. The Holdout validation method was used in three studies [5,25,30]. Saadeh et al. [4] did not explicitly mention the validation method used. Lastly, Yang et al. [31] performed validation without using an algorithm. Their validation process consisted of comparing the features extracted from their smart insole system during the performance of four environment-adapting TUGs against video ground truth references.
Concerning the references measures for classification, five studies [8,9,25,26,27] used the clinical scale scores obtained at the baseline assessment as the reference measures for comparing the algorithm’s classification outcome. The algorithms developed by these 5 studies attempted to estimate the baseline clinical scale scores based on the wearable sensor data collected from the subjects. A group of four studies [4,5,28,29] labelled the data based on the activities performed. Thereby, data samples were labelled as fall risk/pre-fall or normal/ADL events and were used as the reference values to compare against the algorithm’s outcome. The algorithms developed in these studies attempted to detect if the subject was experiencing a fall risk event and obtain the lead-time values of that detection. Buisseret et al. [30] followed a different approach by considering the faller status, i.e., faller or non-faller, associated to each subject based on the prospective occurrence of falls during a follow-up period of 6 months. This faller status served as the reference metric for the algorithm’s fall risk outcome. Yang et al. [31] used video recordings to obtain reference values. The features extracted by their smart insole systems are compared against these reference values to obtain the system’s performance metrics. According to Table 2 (the table can be seen in the full text version of the review article), the accuracy, sensitivity, and specificity were the most used performance metrics to validate fall risk assessment system’s performance. Nevertheless, the mean error is also used by some studies that predicted clinical scale scores [9,26,27]. Generally, studies seem to have reached good performance from the developed fall risk assessment systems.