Your browser does not fully support modern features. Please upgrade for a smoother experience.
Please note this is a comparison between Version 1 by Serena Fragiotta and Version 2 by Conner Chen.
Diabetic retinopathy (DR) remains a critical global burden, with 103.12 million individuals affected and an estimated increase to 160.5 million by 2045. It represents a common and preventable complication of both type 1 and type 2 diabetes affecting the adult working population. Neurodegeneration is a critical element of diabetic retinopathy pathogenesis. The neuronal cells’ apoptosis contributes to microvascular impairment and blood–retinal barrier breakdown.
- diabetic retinopathy
- neurodegeneration
- diabetes
- retinal ganglion cells
- blood-retinal barrier
- retina
1. Introduction
Diabetic retinopathy (DR) remains a critical global burden, with 103.12 million individuals affected and an estimated increase to 160.5 million by 2045 [1]. It represents a common and preventable complication of both type 1 and type 2 diabetes affecting the adult working population [2].
Screening and prevention are essential to successfully manage DR complications but challenging to achieve due to the significant disparity in resources across countries [3]. Microvascular changes on clinical examination represent the first recognizable clinical signs of DR, leading to the false conviction that DR is a mere microvascular disorder [4][5][4,5]. Nevertheless, increased neuronal cells’ apoptosis contributes to the microvascular impairment, affecting the glial cells that are mainly responsible for the maintenance of the integrity of the blood–retinal barrier [6][7][6,7]. Neural apoptosis starts early after diabetic onset with a constant and progressive rate of cellular death, involving retinal ganglion cells and other neural cells [6][8][9][10][6,8,9,10].
2. Molecular and Cellular Interactions in Diabetic Retinopathy
2.1. Neurovascular Unit (NVU)
The retinal dysfunction in DR should be considered as a change in the retinal neurovascular unit [8]. The retinal neurovascular unit refers to the close interdependency among three main elements: neurons, glial cells (astrocytes and Müller cells), and vascular components (endothelial cells and pericytes) (Figure 1) [11][22]. Glial cells are strictly related to the neuronal homeostasis and neurotransmitter regulation. The interaction among the three elements (glial cells, neurons, and pericytes) promote the formation of the blood–retinal barrier (BRB) [8][12][8,23]. Retinal glial cells are elements that permit the communication between retinal blood vessels and neurons thanks to their arrangement and regulatory functions. In particular, the Müller cells present extensive arborization in direct contact with retinal neurons, participating in neurotransmission. They rapidly remove glutamate and γ-aminobutyric acid (GABA) in the inner retina, preventing neurotoxicity and reconverting glutamate into glutamine, providing a substrate for neurotransmitter synthesis [13][14][15][16][17][18][19][24,25,26,27,28,29,30].
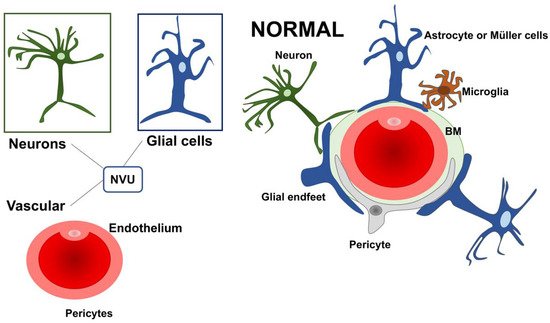
Figure 1. A schematic drawing of the neurovascular unit (NVU) in physiologic condition. The three main elements constituting the NVU are neurons, glial cells (astrocytes and Müller cells), and vascular components (endothelial cells and pericytes). NVU: Neurovascular Unit; BM: Basement membrane.
Further, Müller cells participate in the “potassium spatial buffering”, a process dedicated to the redistribution and normalization of the K+ levels. This process is also essential to remove the fluid accumulation within the retina. The potassium is taken up by Müller cells in the extracellular space through Kir2.1 channels and deposited into the blood vessels using Kir4.1 channels [19][20][21][22][23][30,31,32,33,34]. The contribution of Müller cells in maintaining BRB seems to be also connected with the secretion of antiangiogenic factors, including pigment epithelium-derived factor (PEDF) and thrombospondin-1 [19][30]. Within the NVU, some cells can directly communicate with each other through a direct cell-to-cell interaction, as demonstrated for glial cells, endothelial cells, and pericytes. Other cellular subtypes talk at a distance via the secretion of ligands and/or exosomes.
2.2. Neurovascular Unit Impairment in Diabetes
The role of retinal glial cells can be considered central in the early stages of DR (Figure 2). In fact, perivascular microglial cells tended to grow in number and become hypertrophic within the innermost retinal layers, leading to an increased expression of glial fibrillary acidic protein (GFAP) in Müller cells and reduction in GFAP in astrocytes [24][35]. Activated glial cells progressed into an inflammatory state, producing several cytokines such as the interleukins (IL)-6 and -1b, TNF-a, and MCP-1.
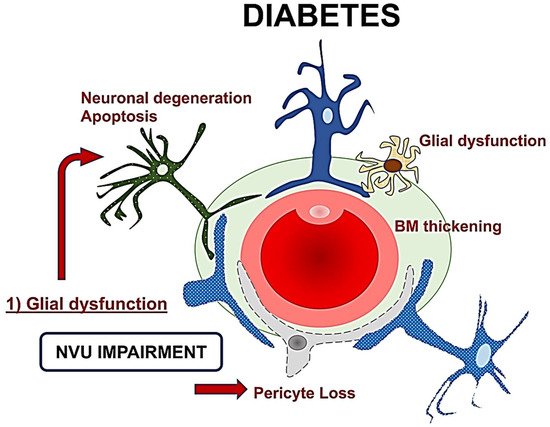
Figure 2. A schematic drawing of the neurovascular unit (NVU) in diabetes. The glial dysfunction appears to be the key element followed by neuronal degeneration, and then microvascular impairment with basement membrane thickening and pericytes loss. NVU: Neurovascular Unit; BM: Basement membrane.
The resultant neuroinflammation can lead to cellular death and microvascular impairment [6][8][6,8]. The glial cells’ activation contributes to neuronal abnormalities, including neurite degeneration and neuronal apoptosis [8][11][8,22].
In the early stages, a downregulation of the neuroprotective factors may be preponderant, including pigment epithelium-derived factor (PEDF), somatostatin (SST), and glucagon-like peptide 1 (GLP-1). The Müller cells dysfunction may further lead to an excess of glutamate, aggravating the neurotoxicity with neuron death [6][19][25][26][27][28][6,30,36,37,38,39]. Another consequence of Müller dysfunction is represented by the downregulation of the K+ channel subtype Kir4.1 and aquaporins but not Kir2.1, leading to an anomalous potassium intake and swelling [19][20][29][30,31,40]. The Müller glia are induced under hypoxic condition or glucose-deprived to increase their production and secretion of vascular endothelium growth factor (VEGF), which is also further increased by the altered permeability [12][29][30][23,40,41]. Glial activation and neural apoptosis represent the main mechanisms preceding the microvascular damage. Pericytes and an increased expression of the extracellular matrix components occurred before the involvement of the endothelial cells (Figure 3) [24][25][35,36].
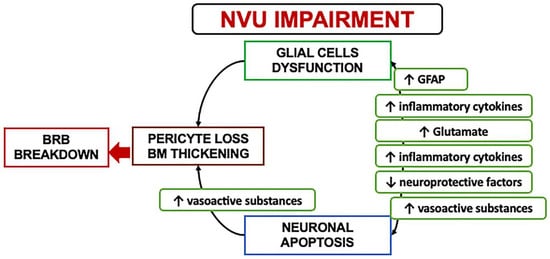
Figure 3. A schematization of the events characterizing the neurovascular unit impairment. NVU: Neurovascular Unit; BRB: Blood retinal barrier; GFAP: Glial fibrillary acidic protein.
2.3. Mechanisms and Clinical Implications of Neurodegeneration
The pathological hallmarks of neurodegeneration in diabetes include reactive gliosis, loss of neuronal functions, and neuronal apoptosis occurring before microangiopathy in experimental models [6][25][31][32][6,36,42,43]. NVU impairment is a critical event in the pathogenesis of the early stages of diabetes, and it is accompanied by an imbalance of several neuroprotective factors. Neurons are unable to proliferate or regenerate themselves, leading to a gradual and constant cell loss leading to chronic degeneration [25][33][36,44].
The potential loss of neuronal function in the absence of apoptosis can reasonably explain the early functional alterations seen in diabetic patients prone to developing diabetic retinopathy [34][26][27][12,37,38] Potential mechanisms involved in the decline of neuronal function may include the loss of synaptic proteins required for neurotransmission and intracellular calcium signaling alterations [27][38] It may be conceivable that other factors may be involved in the neurodegenerative process, including the protein misfolding altering endoplasmic reticulum homeostasis, but it has to be elucidated [35][45].
Retinal ganglion cells (RGCs) and amacrine cells have been identified as the first neurons involved in diabetes-induced apoptosis, but even photoreceptors may be affected. The direct consequence of an increased apoptotic death is a reduced thickness in the inner retinal layers and the nerve fiber layer clinically detectable through optical coherence tomography (OCT) [25][36]. The clinical recognition of a preclinical phase of retinopathy can be detrimental in identifying persons at risk for future retinal complications and visual loss, and, not less importantly, provide additional criteria for proper patient selection during clinical trials [36][46].
3. Clinical Hallmarks of Neurodegeneration in Diabetes
3.1. Functional Assessment
Early functional alterations in diabetes can be assessed using contrast sensitivity, dark adaption, frequency doubling technology perimetry (FDT), and multifocal electroretinogram (mfERG) [37][38][39][40][41][15,16,47,48,49].
Contrast sensitivity tested with the Pelli-Robson chart was significantly altered in eyes with diabetic retinopathy and correlated with the blood glucose levels [39][47]. Pelli-Robson contrast sensitivity was significantly reduced in diabetic patients without DR, with an average of 19% age-corrected reduction compared to healthy subjects [42][50]. Achromatic contrast sensitivity reduction was evident in diabetic patients independently from diabetic retinopathy microvascular complications, further supporting early neuronal involvement [43][51].
The functional integrity of the magnocellular component of the ganglion cells was estimated through Humphrey FDT technology. Type 1 diabetes patients presented an early functional impairment without any detectable microvascular alterations of diabetic retinopathy [41][49]. Diabetic patients without DR exhibited a mean of 2.9 dB loss compared to healthy subjects in the central region, while a more significant loss of sensitivity (3.93 dB) was evident in eyes with non-proliferative diabetic retinopathy [39][47]. FDT perimetry was superior to microperimetry in detecting a functional decline, more specific in tracing the neural damage of the RGCs [42][50]. A reduced dark adaption in diabetic patients without retinopathy or early changes indicated a rod cell impairment occurring as one of the earliest deficits in retinal function [40][48].
The most important functional factor predictive for the development of DR is represented by implicit time (IT) on mfERG. Patients with diabetes exhibited a significantly delayed P1 IT from rings 3 to 6, worsening in patients who presented microangiopathic abnormalities [44][52]. The clinical onset of DR intended as evidence of pathologic microvascular changes on clinical exam represents already a critical progression. The implicit time is spatially associated with retinopathy, correlated with the severity of the disease, and is a strong predictor for DR development over a short period. Thus, it is considered an essential surrogate outcome in clinical trials [45][34][46][47][48][11,12,13,53,54]. The mfERG P1 component is generated primarily by bipolar cells in the inner nuclear layer of the retina, further corroborating the presence of neural alterations in the absence of evident microvascular changes [34][12].
Recently, the photopic negative response (PhNR) has gained substantial interest in diabetic patients to estimate the RGCs response. It has been noted that the PhNR is reduced even in patients without clinically evident DR. These abnormalities can be detectable in people with diabetes with normal a- and b-waves on full-field ERG, indicating that the RGCs are affected independently from compromised photoreceptors or bipolar cells [49][50][51][55,56,57].
3.2. Structural Features on Retinal Imaging
In type 1 diabetes with no signs of diabetic retinopathy, the retinal nerve fiber layer (RNFL) imaged by GDx VCC was found to be significantly altered in eyes with HBA1c ≥ 7% [41][49]. Preclinical retinal changes were demonstrated in the macular NFL, RGC layer (GCL), inner plexiform layer (IPL), inner nuclear layer (INL), and photoreceptors on OCT morphometric analysis in eyes with long-standing type 1 diabetes [52][58]. A significant difference in macular NFL was confirmed by van Dijk et al. [53][18] in patients with minimal or no signs of DR compared to healthy subjects. However, other studies did not show significant differences in macular NFL thickness between controls and diabetic eyes [54][55][56][57][59,60,61,62].
The alterations of the GCL are not of univocal interpretation. Some authors reported thickening of the GCL+IPL, hypothesizing a diffuse swelling occurring before the development of diabetic macular edema [52][58][58,63]. However, most studies reported a GCL+IPL thinning in diabetic patients [9][53][54][59][60][9,18,59,64,65]. In pediatric patients with DM1, the significant reduction in the ganglion cell complex (GCC) was postulated to be aggravated by hyperlipidemia, whereas the insulin demonstrated a possible protective effect with a thicker GCC [61][66]. Of note, the GCC is an automated OCT parameter that includes all three innermost retinal layers, RNFL, GCL, and IPL [62][67].
The INL/outer plexiform (OPL) thickening was attributed mostly to the change of the INL layer, which is essentially formed by the nuclei of bipolar and Müller cells and by the associations of horizontal and amacrine cells. This morphometric alteration may reflect a signature for Müller cells activation and hypertrophy due to swelling [59][64]. Similar results were achieved in a selected group of DM1 patients with a good glycemic control and no concomitant comorbidities. In this group, the INL was thicker in all the four explored quadrants (superior, nasal, temporal, and inferior) [63][68]. However, other authors obtained different results with a thinner INL in diabetic patients with no or initial signs of DR [52][64][58,69]. In general terms, the neurodegeneration characterizing early diabetes is accompanied by macular thickness reduction due to neural tissue loss. Still, as the disease progresses, the macular thickness tends to thicken for increased vascular permeability [64][69].
Recently, a cohort of patients with diabetes before any evident clinical signs of DR demonstrated a thinning of the inner retina (GCL-IPL). More interestingly, the structure–function relationship revealed that FDT and microperimetry measurements significantly correlated with structural parameters in the global and topographic analysis [65][70]. In DR patients with ETDRS level < 20, the presence of a GCL-IPL thinning was concomitant to mfERG abnormalities in 67% of cases. The lack of mfERG in the remaining 1/3 of the cases was explained by the fact that as the electric signal generated with mfERG is derived by bipolar cells and photoreceptors, thus, it may not reflect the status of all the cellular components of the inner retinal layers directly [44][52].
Glial cell proliferation in diabetic retinopathy has been hypothesized to be revealed through hyperreflective foci (HRF) visualization on OCT b-scan. A direct association between proinflammatory cytokines expressed by microglia, monocytes, macrophages and HRF localized in the inner retina has been established. The distinction between HRF of possible inflammatory origin and other etiologies includes the inner retina location, size ≤ 30 mm, absence of posterior shadowing, and reflectivity similar to the retinal fiber layer [66][67][68][71,72,73].