Porphyrin is a molecular material with many potential applications. New porphyrin-functionalized benzoxazine (Por-BZ) in high purity and yield was synthesized in this study based on 1H and 13C NMR and FTIR spectroscopic analyses through the reduction of Schiff base formed from tetrakis(4-aminophenyl)porphyrin (TAPP) and salicylaldehyde and the subsequent reaction with CH2O. Thermal properties of the product formed through ring-opening polymerization (ROP) of Por-BZ were measured using DSC, TGA and FTIR spectroscopy. Because of the rigid structure of the porphyrin moiety appended to the benzoxazine unit, the temperature required for ROP (314 °C) was higher than the typical Pa-type benzoxazine monomer (ca. 260 °C); furthermore, poly(Por-BZ) possessed a high thermal decomposition temperature (Td10 = 478 °C) and char yield (66 wt%) after thermal polymerization at 240 °C. An investigation of the thermal and luminescence properties of metal–porphyrin complexes revealed that the insertion of Ni and Zn ions decreased the thermal ROP temperatures of the Por-BZ/Ni and Por-BZ/Zn complexes significantly, to 241 and 231 °C, respectively. The metal ions acted as the effective promoter and catalyst for the thermal polymerization of the Por-BZ monomer, and also improved the thermal stabilities after thermal polymerization.
- polybenzoxazine
- ring-opening polymerization
- porphyrin
- metal complex
- thermal stability
1. Introduction
2. Metal Complexes of the Porphyrin-Functionalized Polybenzoxazine
2.1. Synthesis of TAPP
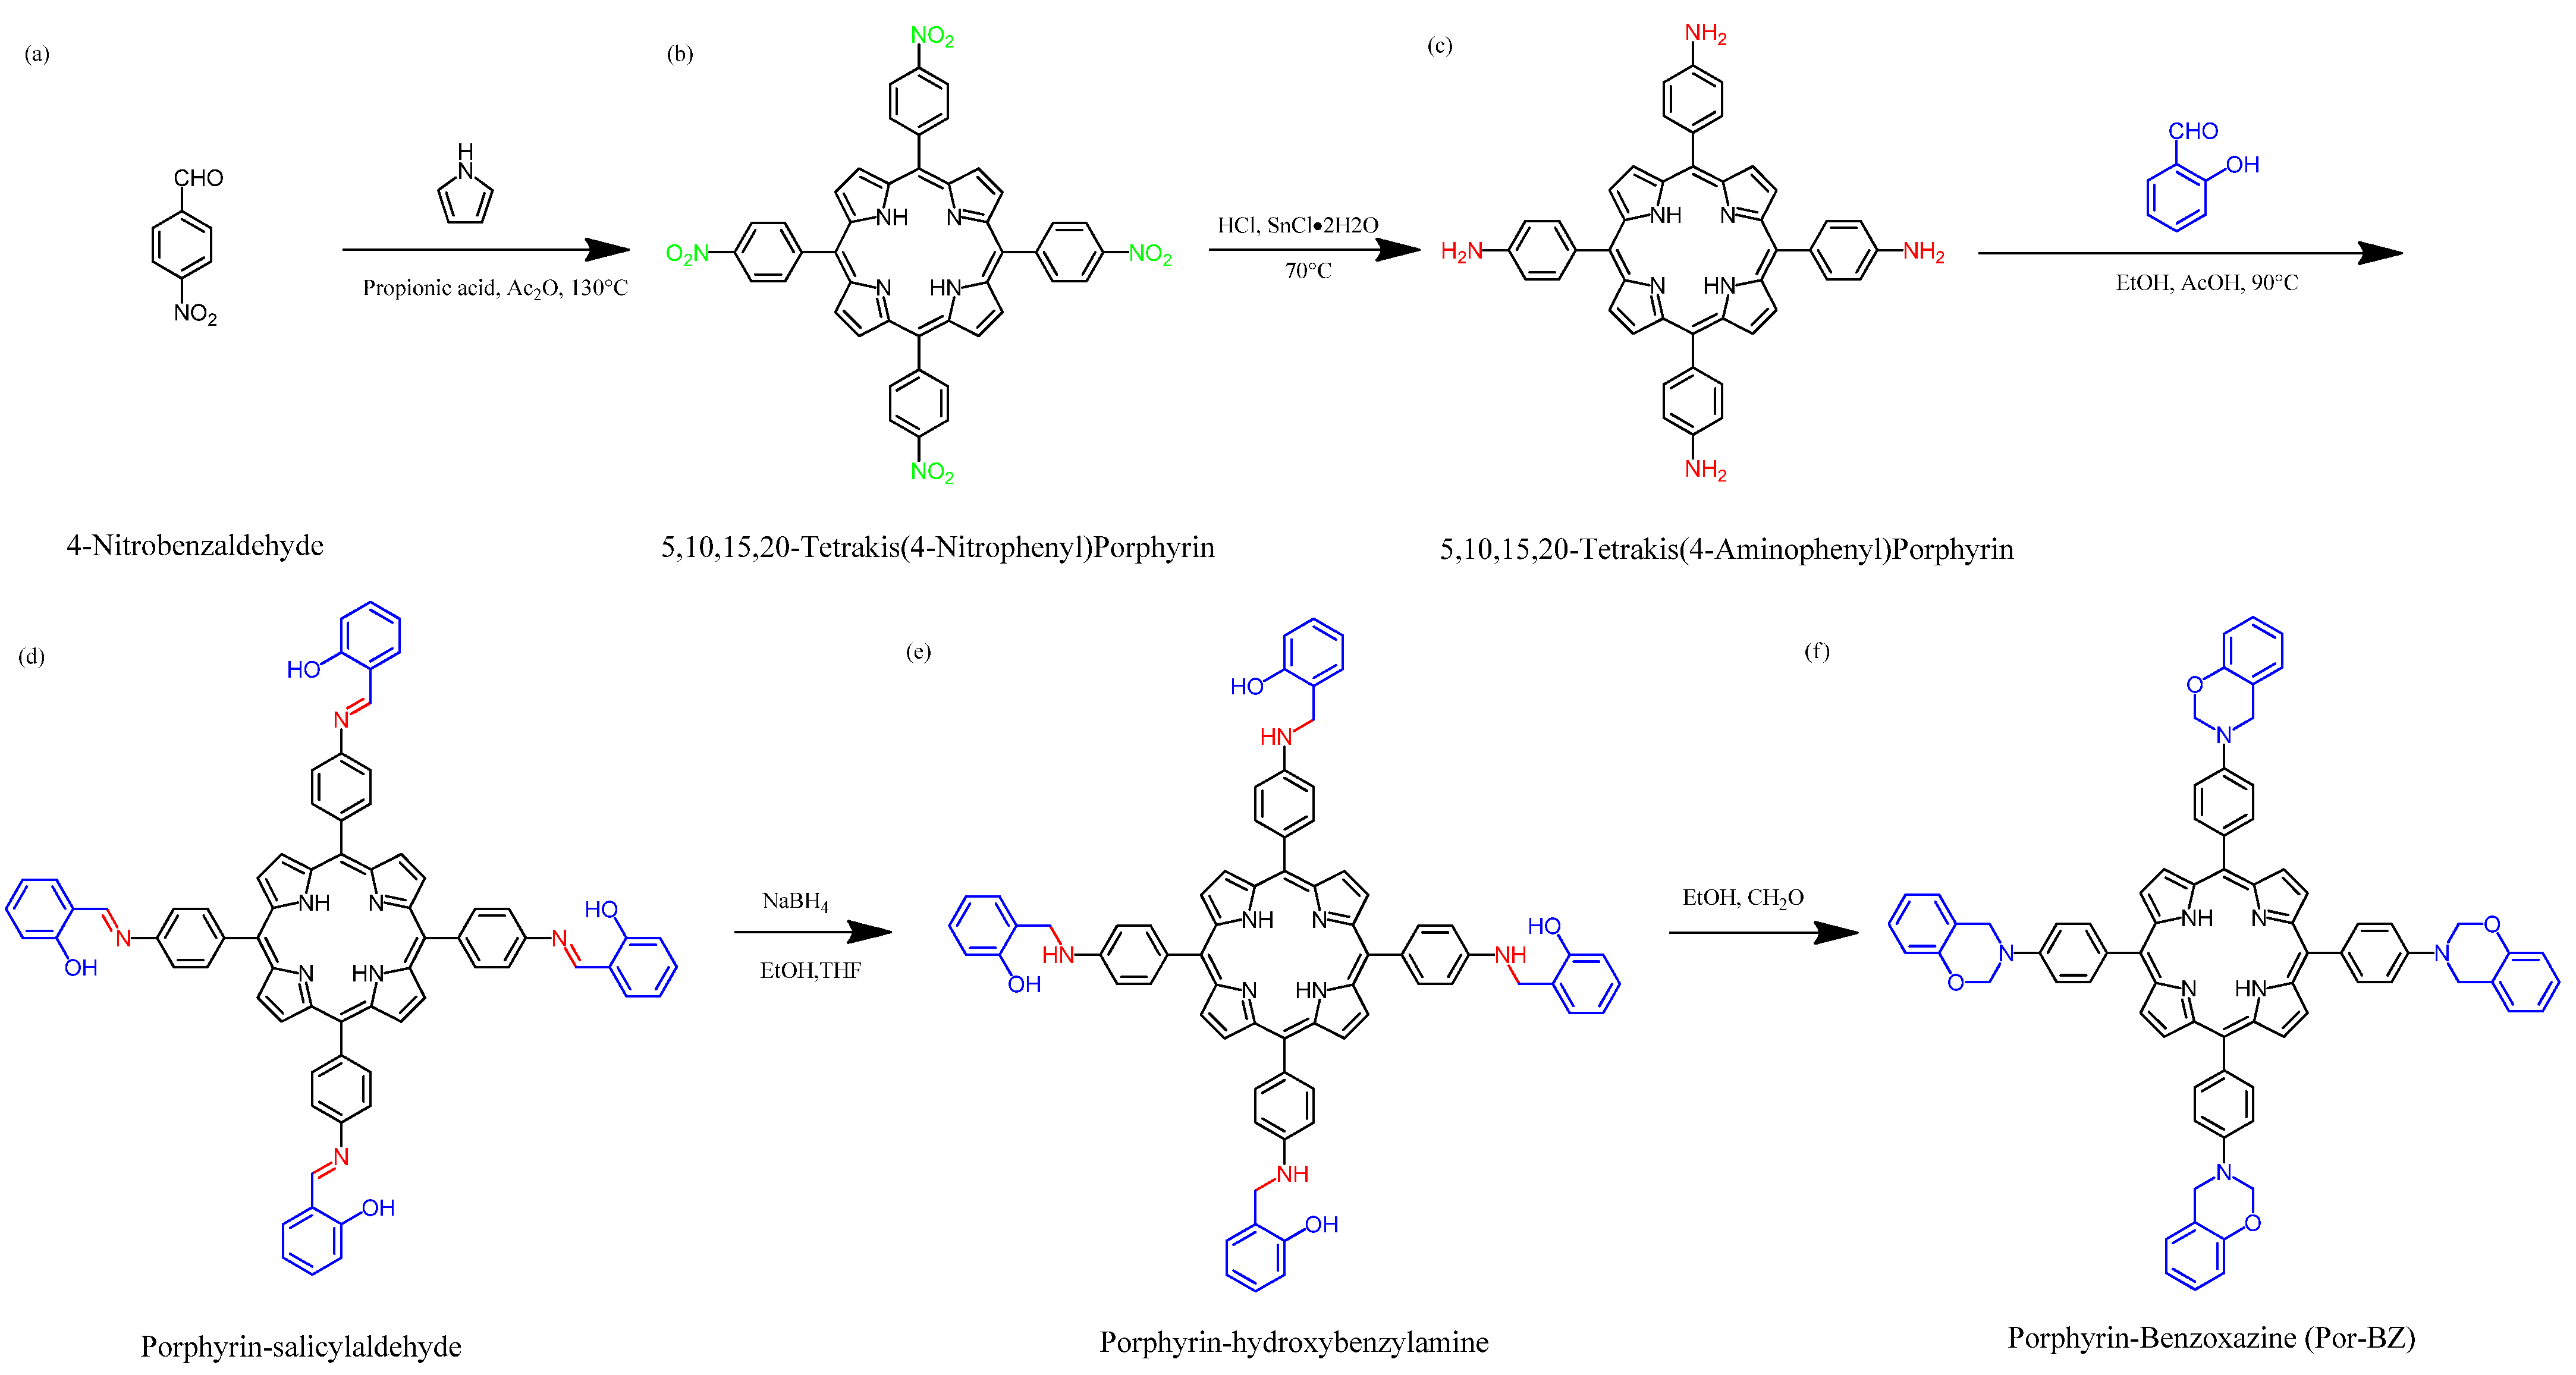
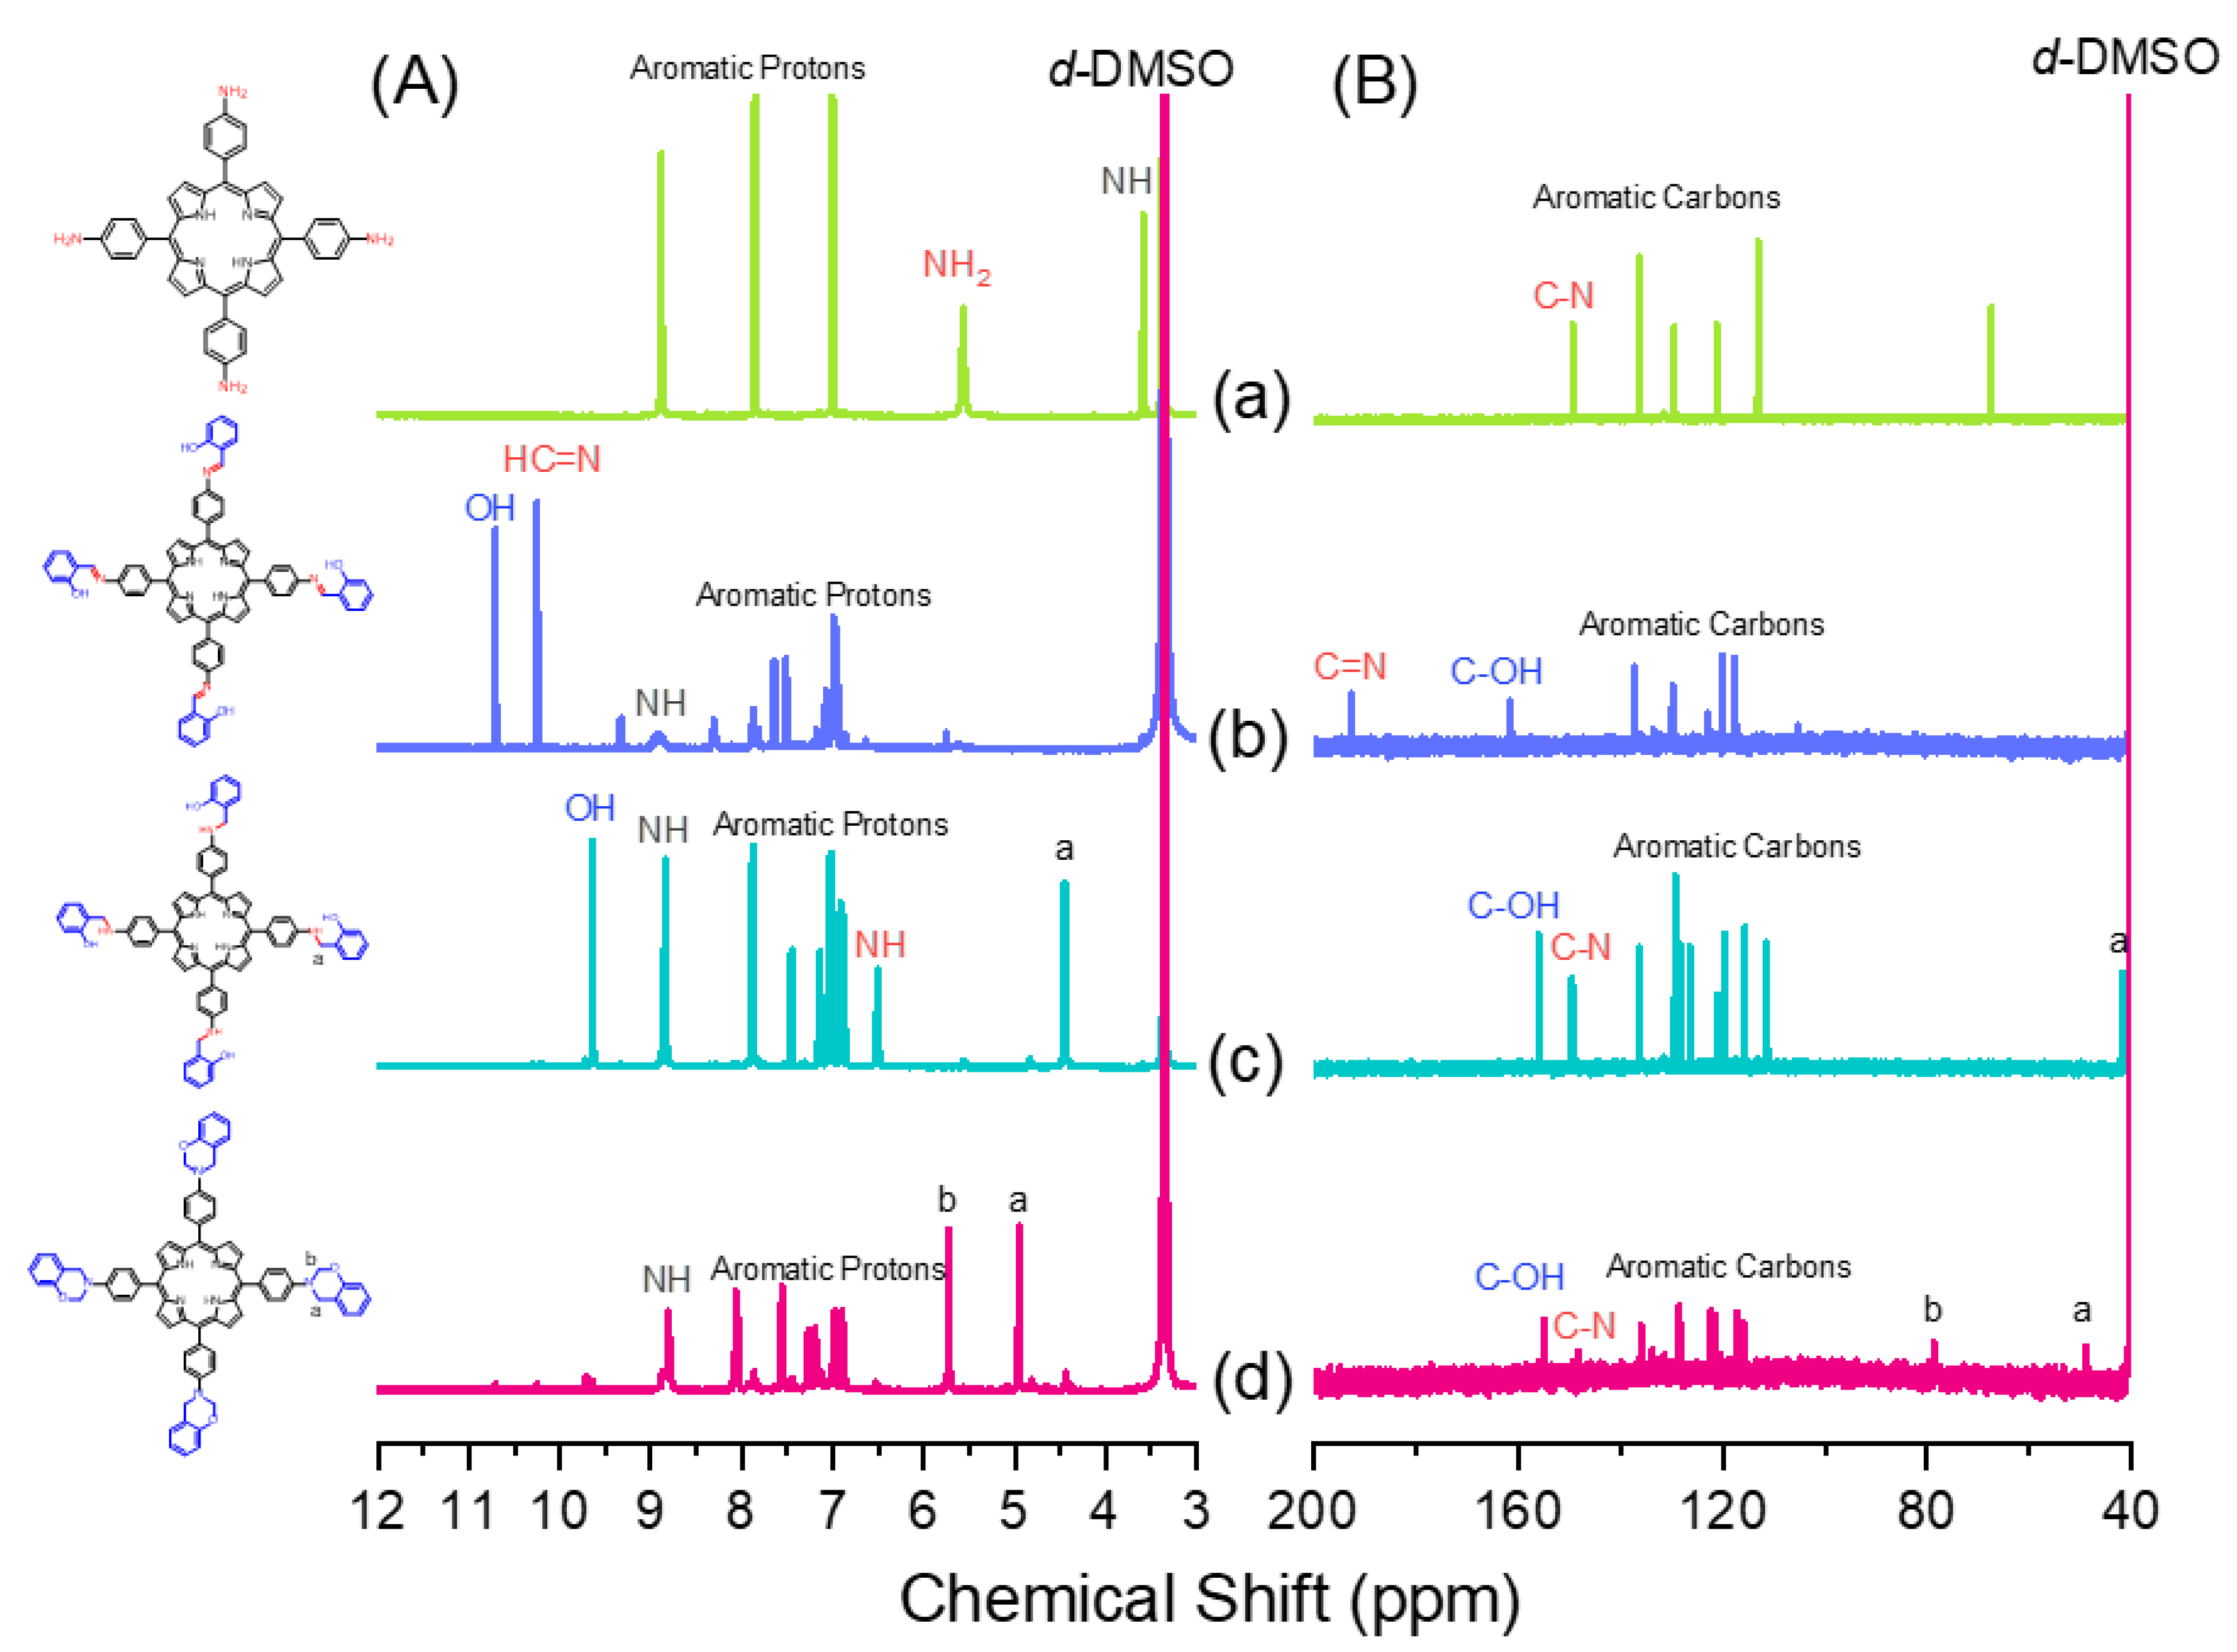
Scheme 1 presents the synthesis of the monomer Por-BZ from 4-nitrobenzaldehyde (Scheme 1a). First, the reseachers prepared TNPP (Scheme 1b) through the reaction of 4-nitrobenzaldehyde with pyrrole in the presence of propionic acid and acetic anhydride at 130 °C. The reduction of TNPP with HCl and SnCl2·H2O at 70 °C for 2 h provided TAPP as violet microcrystals in high yield and purity (Scheme 1c); FTIR and NMR spectroscopy confirmed the chemical structure. Figure 1a–c display the FTIR spectra of 4-nitrobenzaldehyde, TNPP, and TAPP, respectively, each recorded at room temperature. The signals for the NO2 units appeared near 1346 and 1593 cm−1 for both 4-nitrobenzaldehyde and TNPP; the signals of the CHO unit of 4-nitrobenzaldehyde at 2855, 2776, 2733 (C–H) and 1700 (C=O) cm−1 were absent from the spectrum of TNPP, but signals appeared for an NH unit at 3312 cm−1 and a C=N unit at 1596 cm−1 [51]. In the spectrum of TAPP, the signals of the NO2 units had almost disappeared, with two new absorption peaks appearing for NH2 units at 3352 and 3439 cm−1. Figure 2 show 1H and 13C NMR spectra of TAPP. The signals of the NH and NH2 protons appeared at 3.57 and 5.56 ppm, respectively (Figure 2A). The signal at 149.32 ppm in Figure 2B represents to the C–N units of TAPP, confirming the successful reduction of TNPP to form TAPP in high purity.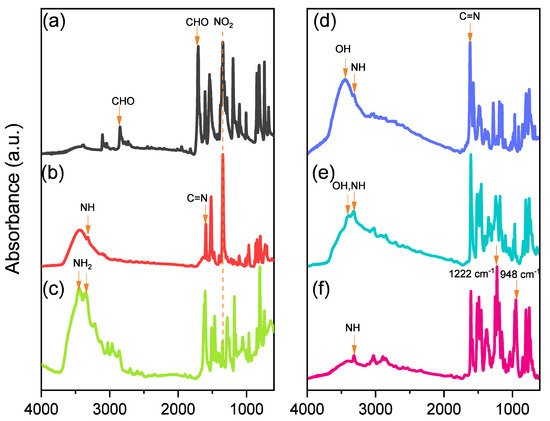
2.2. Synthesis of Por-BZ
Although TAPP features four amino groups, one-pot Mannich condensations from primary amines, phenol, and CH2O do not always occur in the preparation of BZ monomers due to low selectivity, which is strongly dependent on the substituent positions. In previous studies [27], the reseachers used the approach described by Ishida and Lin et al. to prepare BZ rings through a three-step synthesis (Scheme 1d–f). Here, the reseachers used the Schiff base formed from TAPP and salicylaldehyde to first form porphyrin-salicylaldehyde (Por-Sa) (Scheme 1d). Next, the reseachers reduced Por-Sa to form the o-hydroxybenzylamine derivative Por-Hy (Scheme 1e). Finally, the reaction of Por-Hy with the aldehyde derivative was provided the target monomer Por-BZ (Scheme 1f). Figure 1 also presents FTIR spectra of Por-Sa, Por-Hy, and the monomer Por-BZ, recorded at room temperature. The O–H and N–H stretching absorptions appeared near 3455 and 3409 cm−1 for Por-Sa (Figure 1d) and Por-Hy (Figure 1e), respectively. After the reaction with paraformaldehyde, the signal of the OH groups was absent from the spectrum of the Por-BZ monomer, with the main characteristic signals being those for the oxazine ring (948 cm−1), C–O stretching (1222 cm−1), and N–H stretching of the pyrrole units (3319 cm−1), indicative of the BZ ring having formed. Figure 2 displays 1H and 13C NMR spectra of Por-Sa (Figure 2b), Por-Hy (Figure 2c), and Por-BZ monomer (Figure 2d) in DMSO-d6. The signals of the NH2 units of TAPP were absent in the spectrum of Por-Sa (Figure 2A-b), with characteristic signals appearing for the N=CH, OH, and NH units at 10.24, 10.72, and 8.90 ppm, respectively, along with signals for aromatic protons in the range 8.30–6.87 ppm. The spectrum of Por-Hy (Figure 2A-c) also featured signals for aromatic protons (7.88–6.87 ppm), but the signal of the N=CH units of Por-Sa (at 10.24 ppm) was disappeared, with the new signal for NHCH2 units appearing at 4.45 ppm, in addition to signals for the NH and OH units at 9.62 and 8.85 ppm, respectively. The high-field signal of the OH units was due to a change in intramolecular hydrogen bonding after the reduction of Por-Sa. The spectrum of Por-BZ (Figure 2A-d) featured signals for aromatic rings and NH units at 8.06–6.85 and 8.78 ppm, respectively. Furthermore, the signals of the oxazine ring protons were appeared at 4.93 (ArCH2N) and 5.72 (OCH2N) ppm with equal integral intensity. The corresponding 13C NMR spectra confirmed their chemical structures (Figure 2B). The 13C NMR spectrum of Por-Sa (Figure 2B-b) featured signals at 192.67, 161.75, and 137.02–117.54 ppm for the N=CH, COH, and aromatic carbon nuclei, respectively. The Por-Hy spectrum featured a new peak at 41.56 ppm for the NHCH2 carbon nuclei (Figure 2B-c). The characteristic signals for Por-BZ appeared at 49.16 (ArCH2N) and 78.80 (OCH2N) ppm, indicating that the BZ ring had been synthesized with high purity and yield.2.3. Thermal Curing Polymerization of Por-BZ Monomer
The reseachers used DSC, TGA, and FTIR spectroscopy to investigate the thermal curing polymerization of the Por-BZ monomer. Figure 3A displays DSC traces of pure Por-BZ monomer, which provided a high exothermic maximum curing temperature of 314 °C and the reaction heat of 163 J g−1. Compared with the typical thermal curing temperature of a Pa-type BZ monomer (255–263 °C), the significantly higher value for pure Por-BZ monomer was presumably because the rigid structure of its porphyrin unit inhibited ROP at relatively high temperatures. After thermal polymerizations at 150, 180, and 210 °C, the polymerization temperatures of Por-BZ shifted to 312, 312, and 295 °C, respectively, with the reaction heat of 144, 138, and 80 J g−1, respectively. In addition, after thermal curing polymerization at 240 °C for 2 h, no obvious exothermic peak was observed, suggesting that the complete ROP of the Por-BZ monomer had occurred at this temperature to form poly(Por-BZ). Figure 3B displays the FTIR spectra of Por-BZ after its thermal polymerizations at the various temperatures. The signals of BZ units at 1222 and 948 cm−1 decreased gradually upon increasing the thermal polymerization temperature, consistent with ring-opening of the oxazine structure. After the temperature had increased to 240 °C, the signals of the oxazine ring disappeared completely based on the FTIR spectra, suggesting the formation of the highly cross-linked poly(Por-BZ) structure (Scheme S1), which is consistent with DSC data.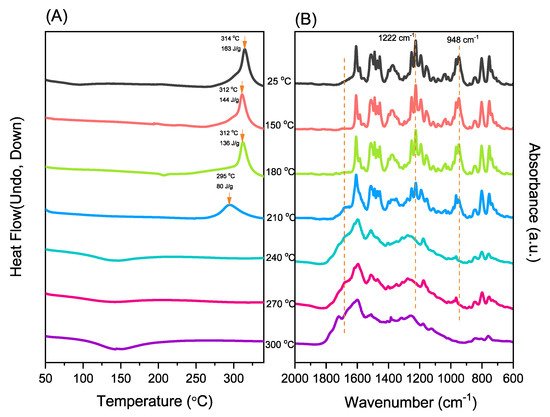
2.4. Characterization of Por-BZ/Metal Complex
Because porphyrins are excellent moieties for complexing metal cations, the reseachers tested the ability of the reearchers Por-BZ to bind Ni2+ and Zn2+ ions [52][53]. the reseachers used DSC and FTIR spectroscopy to demonstrate the incorporation of these metal ions into the porphyrin structures, and DSC thermograms to record the thermal ROP behavior of the Por-BZ/Ni and Por-BZ/Zn complexes. Figure 5A presents that the thermal curing peaks of the uncured Por-BZ/Ni and Por-BZ/Zn complexes were centered at 241 and 231 °C, respectively, implying that the metal ions could act as catalysts for the ROPs of the BZ rings. In previous studies the reseachers found that the mechanism through which these metal ions catalyze the ring-opening of BZ involves three steps: first, the metal ion coordinates the nitrogen or oxygen atom in the oxazine ring structure, and then the next electrophilic attack of the metal ions to the oxazine ring occurs. Finally, the rearrangement was occurred to form the stable phenolic and phenoxy structures [3]. Figure 5B presents FTIR spectra of Por-BZ and the Por-BZ/Ni and Por-BZ/Zn complexes, measured at room temperature. The BZ structure (signals at 1222 and 948 cm−1) remained for the uncured Por-BZ/Ni and Por-BZ/Zn complexes. Meanwhile, the signal at 3316 cm−1 for NH stretching of the pyrrole ring had disappeared, suggesting that the metal ions had been inserted into the porphyrin structure, replacing the original pyrrole protons (Scheme 2b), with new signals observed at 1663 and 991 cm−1 in the FTIR spectra of the Por-BZ/Ni and Por-BZ/Zn complexes, arising from coordination of the metal ions with the porphyrin structures.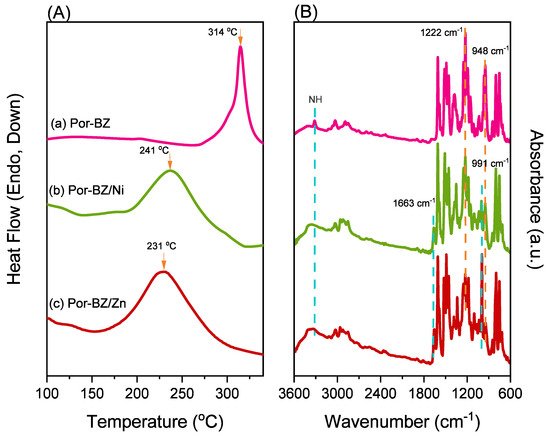
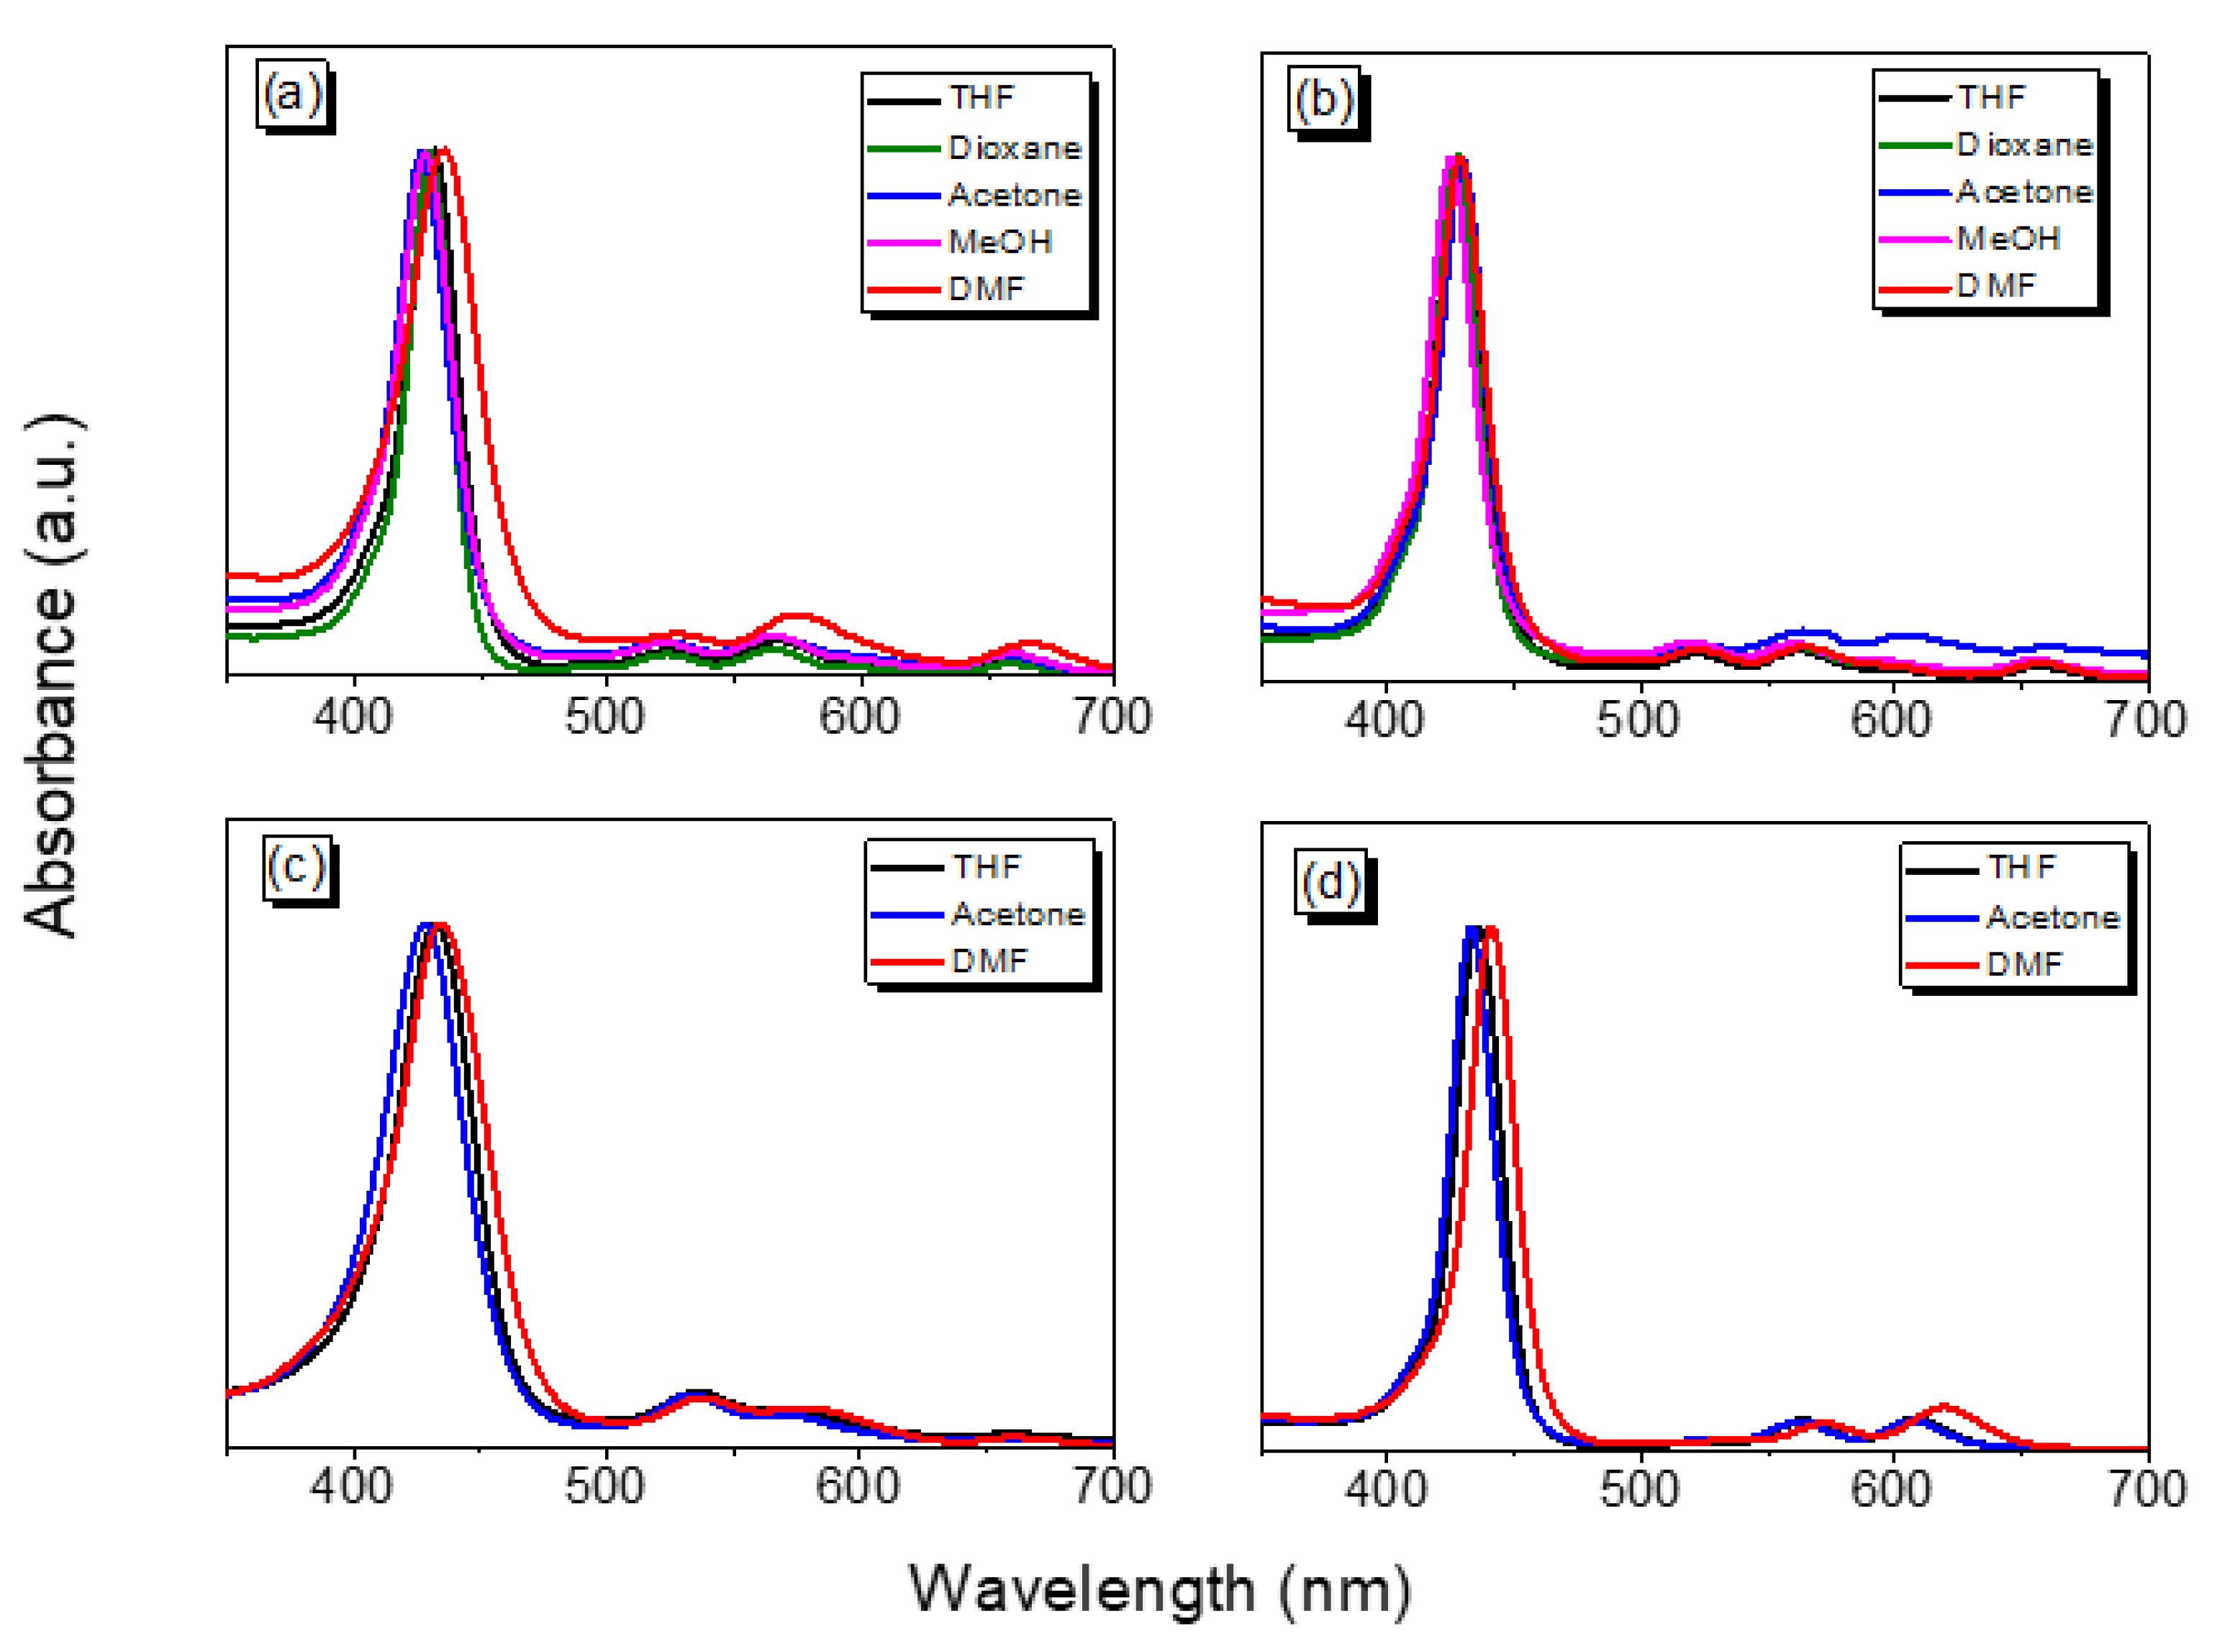
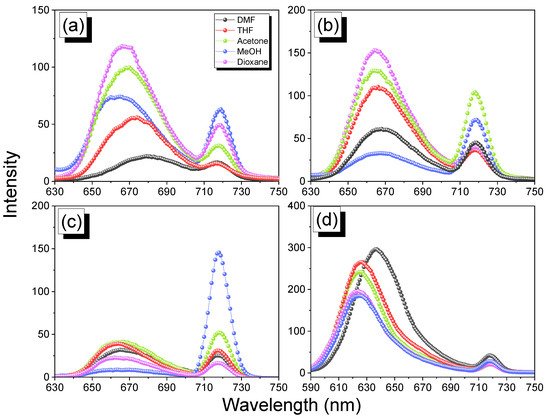
| Compound | Solvent | λabs (nm) (Soret Band) | λabs (nm) (Q Band) |
|---|---|---|---|
| TAPP | THF | 524, 566, 602, 662 | 432 |
| Dioxane | 524, 564, 600, 660 | 430 | |
| Acetone | 522, 564, 600, 660 | 428 | |
| MeOH | 522, 564, 596, 656 | 426 | |
| DMF | 528, 574, 608, 666 | 436 | |
| Por-BZ | THF | 522, 562, 598, 658 | 428 |
| Dioxane | 522, 562, 598, 656 | 428 | |
| Acetone | 520, 560, 596, 654 | 424 | |
| MeOH | 522, 564, 606, 662 | 430 | |
| DMF | 522, 564, 600, 658 | 428 | |
| Por-BZ/Ni | THF | 535, 574, 657.5 | 432 |
| Acetone | 533.5, 571, 656.5 | 428 | |
| DMF | 538, 579, 660.5 | 434 | |
| Por-BZ/Zn | THF | 564, 608 | 436 |
| Acetone | 562, 606 | 432 | |
| DMF | 572, 620 | 440 |
2.5. Thermal ROP of Por-BZ/Metal Complex
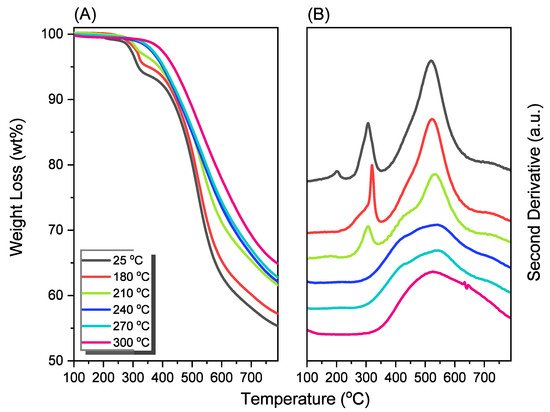
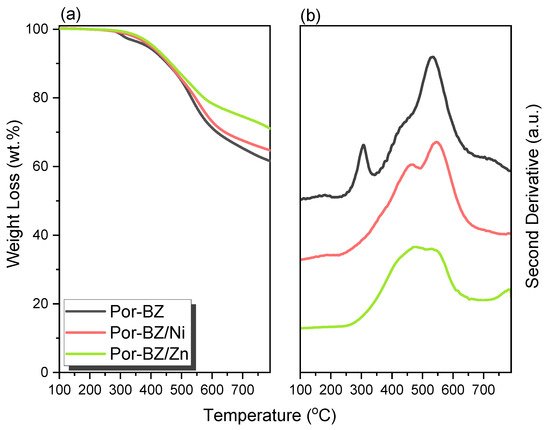
The reseachers used DSC analyses to monitor the thermal ROP behavior of Por-BZ/Ni and Por-BZ/Zn complexes after their thermal curing for 2 h at temperatures of 150, 180, and 210 °C, respectively. Figure 10a,c reveal that the thermal curing peak temperatures of uncured Por-BZ/Ni and Por-BZ/Zn complexes were centered at 241 and 231 °C, respectively, as mentioned in the reearchers discussion of Figure 5A. Similar to the behavior of pure Por-BZ, the exothermic enthalpies of both the Por-BZ/Ni and Por-BZ/Zn complexes decreased with the increase in temperature, and disappeared completely after thermal treatment at 210 °C. Although the thermal curing behavior was consistent with that of the pure Por-BZ under the same thermal curing conditions, which was much lower than that of pure Por-BZ monomer, suggesting that the presence of the Ni and Zn ions assisted the ring-opening procedure. the reseachers used FTIR to study the thermal curing polymerization behavior of Por-BZ/Ni and Por-BZ/Zn complexes after thermal polymerization at different temperatures (Figure 10b,d). Similar to Figure 3B, when the thermal polymerization temperature was increased, the characteristic absorption bands of the oxazine structure at 1222 and 948 cm−1 gradually decreased, and disappeared completely as the thermal curing temperature was only 210 °C, compared with 240 °C for the pure Por-BZ monomer, again suggesting that the Ni (Figure 10b) and Zn (Figure 10d) ions assisted the ROP, and implying the formation of highly cross-linked poly(Por-BZ/metal) complexes. Figure 11a displays the results of TGA analyses of pure Por-BZ and the Por-BZ/Ni and Por-BZ/Zn complexes after thermal ROP at 210 °C. The values of Td10 and the char yields increased to 458 °C and 64.3 wt%, respectively, for the poly(Por-BZ/Ni) complex and to 465 °C and 71.1 wt%, respectively, for the poly(Por-BZ/Zn) complex, when compared with those of the pure poly(Por-BZ) (453 °C and 61.5 wt%, respectively). Figure 9B displays these three corresponding exothermic peaks after thermal ROP at 210 °C; the first exothermic peaks disappeared for both the Por-BZ/Ni and Por-BZ/Zn complexes, indicating that the Ni and Zn ions not only facilitated the ROP of Por-BZ, but also enhanced the thermal stability and char yield significantly based on TGA analyses. According to the DSC, FTIR spectral, and TGA analyses, the coordination ability to the porphyrin structure of the Zn ion appeared to be stronger than that of the Ni ion, as has been discussed widely in previous reports [49], resulting in a lower ROP temperature and a higher thermal stability.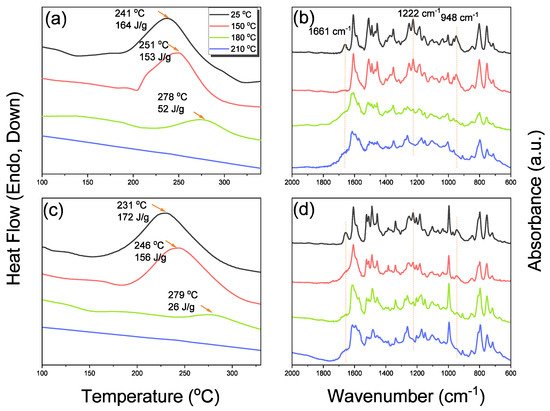
3. Conclusions
References
- Yadav, N.; Monisha, M.; Niranjan, R.; Dubey, A.; Patil, S.; Priyadarshini, R.; Lochab, B. Antibacterial performance of fully biobased chitosan-grafted-polybenzoxazine films: Elaboration and properties of released material. Carbohydr. Polym. 2021, 254, 117296.
- Lyu, Y.; Rachita, E.; Pogharian, N.; Froimowicz, P.; Ishida, H. Electronic effects of asymmetric and meta-alkoxy substituents on the polymerization behavior of bis-benzoxazines. Polym. Chem. 2020, 11, 800–809.
- Zhang, X.; Mohamed, M.G.; Xin, Z.; Kuo, S.W. A tetraphenylethylene-functionalized benzoxazine and copper(II) acetylacetonate form a high-performance polybenzoxazine. Polymer 2020, 201, 122552.
- Wu, J.J.; Zhao, C.X.; Li, Y.T.; Li, H.; Xiang, D.; Sun, Z.M.; Li, X. Properties of bio-based thermosetting composites synthesized from epoxidized soybean oil and azo-cardanol benzoxazine. J. Polym. Res. 2021, 28, 77.
- Ohashi, S.; Rachita, E.; Baxley, S.; Zhou, J.; Erlichman, A.; Ishida, H. The first observation on polymerization of 1,3-benzothiazines: Synthesis of mono- and bis-thiazine monomers and thermal properties of their polymers. Polym. Chem. 2021, 12, 379–388.
- Zhang, K.; Yu, X.; Kuo, S.W. Outstanding dielectric and thermal properties of main chain-type poly(benzoxazine-co-imide-co-siloxane)-based cross-linked networks. Polym. Chem. 2019, 10, 2387–2396.
- Abuzeid, H.R.; EL-Mahdy, A.F.M.; Ahmed, M.M.M.; Kuo, S.W. Triazine-functionalized covalent benzoxazine framework for direct synthesis of N-doped microporous carbon. Polym. Chem. 2019, 10, 6010–6020.
- Kolanadiyil, S.N.; Minami, M.; Endo, T. Implementation of meta-Positioning in Tetrafunctional Benzoxazines: Synthesis, Properties, and Differences in the Polymerized Structure. Macromolecules 2020, 53, 6866–6886.
- Hao, B.; Han, L.; Liu, Y.; Zhang, K. An apigenin-based bio-benzoxazine with three polymerizable functionalities: Sustainable synthesis, thermal latent polymerization, and excellent thermal properties of its thermosets. Polym. Chem. 2020, 11, 5800–5809.
- Deliballi, Z.; Kiskan, B.; Yagci, Y. Advanced Polymers from Simple Benzoxazines and Phenols by Ring-Opening Addition Reactions. Macromolecules 2020, 53, 2354–2361.
- El-Mahdy, A.F.; Lin, F.W.; Su, W.H.; Chen, T.; Kuo, S.W. Photoresponsive azobenzene materials based on pyridine-functionalized benzoxazines as surface relief gratings. ACS Appl. Polym. Mater. 2019, 2, 791–804.
- Li, X.; Liu, Y.; Chen, H.; Li, H. Benzoxazine monomers containing triphenylimidazole: Polymerization of monomers and properties of polybenzoxazines. Eur. Polym. J. 2019, 121, 109347.
- Tavernier, R.; Granado, L.; Foyer, G.; David, G.; Caillol, S. Formaldehyde-Free Polybenzoxazines for High Performance Thermosets. Macromolecules 2020, 53, 2557–2567.
- Wang, C.F.; Su, Y.C.; Kuo, S.W.; Huang, C.F.; Sheen, Y.C.; Chang, F.C. Low-Surface-Free-Energy Materials Based on Polybenzoxazines. Angew. Chem. Int. Ed. 2006, 118, 2306–2309.
- Sawaryn, C.; Landfester, K.; Taden, A. Benzoxazine Miniemulsions Stabilized with Polymerizable Nonionic Benzoxazine Surfactants. Macromolecules 2010, 43, 8933–8941.
- Alhwaige, A.A.; Agag, T.; Ishida, H.; Qutubuddin, S. Chitosan Biobased Polybenzoxazine Cross-Linked Films: Preparation in Aqueous Media and Synergistic Improvements in Thermal and Mechanical Properties. Biomacromolecules 2013, 14, 1806–1815.
- Chen, C.; Cao, Y.; Lu, X.; Yao, H.; Xin, Z. Copolymer of eugenol-based and pyrogallol-based benzoxazines: Low curing temperature and enhanced corrosion resistance. Colloids Surf. A Physicochem. Eng. 2021, 609, 125605.
- Yang, R.; Han, M.; Hao, B.; Zhang, K. Biobased high-performance tri-furan functional bis-benzoxazine resin derived from renewable guaiacol, furfural and furfurylamine. Eur. Polym. J. 2020, 131, 109706.
- Yu, X.; Zhang, K. Studies on the isomeric effect of nitrile functionality on the polymerization and thermal properties of ortho-norbornene-based benzoxazine resins. J. Polym. Res. 2020, 27, 130.
- Mohamed, M.G.; Chen, T.C.; Kuo, S.W. Solid-State Chemical Transformations to Enhance Gas Capture in Benzoxazine-Linked Conjugated Microporous Polymers. Macromolecules 2021, 54, 5866–5877.
- Liu, Y.; Sheng, W.; Yin, R.; Zhang, K. Propargylamine: An attractive amine source for designing high-performance benzoxazine resins with low polymerization temperatures. Polym. Chem. 2021, 12, 6694–6704.
- Abuzeid, H.R.; EL-Mahdy, A.F.M.; Kuo, S.W. Covalent Organic Frameworks: Design Principles, Synthetic Strategies, and Diverse Applications. Giant 2021, 6, 100054.
- Samy, M.M.; Mohamed, M.G.; Mansoure, T.H.; Meng, T.S.; Khan, M.A.R.; Liaw, C.C.; Kuo, S.W. Solid state chemical transformations through ring-opening polymerization of ferrocene-based conjugated microporous polymers in host–guest complexes with benzoxazine-linked cyclodextrin. J. Taiwan Inst. Chem. Eng. 2022, 132, 104110.
- Tavernier, R.; Granado, L.; Foyer, G.; David, G.; Caillol, S. Aromatic dialdehyde-based bisbenzoxazines: The influence of relative position of oxazine rings. Polymer 2021, 216, 123270.
- Ohara, M.; Yoshimoto, K.; Kawauchi, T.; Takeichi, T. Synthesis of high-molecular-weight benzoxazines having azomethine linkages in the main-chain and the properties of their thermosetting resins. Polymer 2020, 202, 122668.
- Salum, M.L.; Iguchi, D.; Arza, C.R.; Han, L.; Ishida, H.; Froimowicz, P. Making Benzoxazines Greener: Design, Synthesis, and Polymerization of a Biobased Benzoxazine Fulfilling Two Principles of Green Chemistry. ACS Sustain. Chem. Eng. 2018, 6, 13096–13106.
- Mohamed, M.G.; Kuo, S.W. Crown Ether-Functionalized Polybenzoxazine for Metal Ion Adsorption. Macromolecules 2020, 53, 2420–2429.
- EL-Mahdy, A.F.M.; Liu, T.E.; Kuo, S.W. Direct synthesis of nitrogen-doped mesoporous carbons from triazine-functionalized resol for CO2 uptake and highly efficient removal of dyes. J. Hazard. Mater. 2020, 391, 122163.
- EL-Mahdy, A.F.M.; Yu, T.C.; Kuo, S.W. Synthesis of multiple heteroatom–doped mesoporous carbon/silica composites for supercapacitors. Chem. Eng. J. 2021, 414, 128796.
- El-Mahdy, A.F.M.; Kuo, S.W. Direct synthesis of poly (benzoxazine imide) from an ortho-benzoxazine: Its thermal conversion to highly cross-linked polybenzoxazole and blending with poly (4-vinylphenol). Poly. Chem. 2018, 9, 1815–1826.
- Coban, Z.G.; Yagci, Y.; Kiskan, B. Catalyzing the Ring-Opening Polymerization of 1,3-Benzoxazines via Thioamide from Renewable Sources. ACS Appl. Polym. Mater. 2021, 3, 4203–4212.
- Mohamed, M.G.; Kuo, S.W. Functional Silica and Carbon Nanocomposites Based on Polybenzoxazines. Macromol. Chem. Phys. 2019, 220, 1800306.
- Samy, M.M.; Mohamed, M.G.; Kuo, S.W. Pyrene-functionalized tetraphenylethylene polybenzoxazine for dispersing single-walled carbon nanotubes and energy storage. Compos. Sci. Technol. 2020, 199, 108360.
- Martinez, V.G.; Gude, M.R.; Calvo, S.; Urena, A. Enhancing an Aerospace Grade Benzoxazine Resin by Means of Graphene Nanoplatelets Addition. Polymers 2021, 13, 2544.
- Kumaran, R.; Kumar, A.V.; Ramaprabhu, S.; Subramanian, V. Absorption-enhanced EMI shielding using silver decorated three-dimensional porous architected reduced graphene oxide in polybenzoxazine composites. New J. Chem. 2021, 45, 16939–16948.
- Lin, C.H.; Chen, W.B.; Whang, W.T.; Chen, C.H. Characteristics of Thermosetting Polymer Nanocomposites: Siloxane-Imide-Containing Benzoxazine with Silsesquioxane Epoxy Resins. Polymers 2020, 12, 2510.
- Zhang, S.; Lan, T.; Ren, D.; Liu, X.; Ran, Q. Tuning the polymerization sequence of alkynyl-functionalized benzoxazine: Application as precursor for efficient magnetic EMI shielding materials. J. Mater. Sci. 2021, 56, 10691.
- Mohamed, M.G.; Kuo, S.W. Functional Polyimide/Polyhedral Oligomeric Silsesquioxane Nanocomposites. Polymers 2019, 11, 26.
- Prasomsin, W.; Parnklang, T.; Sapcharoenkun, C.; Tiptipakorn, S.; Rimdusit, S. Multiwalled Carbon Nanotube Reinforced Bio-Based Benzoxazine/Epoxy Composites with NIR-Laser Stimulated Shape Memory Effects. Nanomaterials 2019, 9, 881.
- Ahn, D.; Choi, H.J.; Kim, H.D.; Yeo, S.Y. Properties of Conductive Polyacrylonitrile Fibers Prepared by Using Benzoxazine Modified Carbon Black. Polymers 2020, 12, 179.
- Arivalagan, V.; Stephen, L.D.; Meera, M.; Gunasekaran, S.G. Carbazole terminal phenylene core imine skeletal nanosilica reinforced polybenzoxazine (nSiO2O2/PBZ) hybrid nanocomposites. J. Polym. Res. 2021, 28, 381.
- Auwärter, W.; Seufert, K.; Bischoff, F.; Ecija, D.; Vijayaraghavan, S.; Joshi, S.; Klappenberger, F.; Samudrala, N.; Barth, J.V. A surface-anchored molecular four-level conductance switch based on single proton transfer. Nat. Nanotechnol. 2012, 7, 41.
- Spitaleri, L.; Gangemi, C.M.A.; Purrello, R.; Nicotra, G.; Trusso Sfrazzetto, G.; Casella, G.; Casarin, M.; Gulino, A. Covalently Conjugated Gold–Porphyrin Nanostructures. Nanomaterials 2020, 10, 1644.
- Cui, F.Z.; Liu, Z.; Ma, D.L.; Liu, L.; Haung, T.; Zhang, P.; Tan, D.; Wang, F.; Jiang, G.F.; Wu, Y. Polyarylimide and porphyrin based polymer microspheres for zinc ion hybrid capacitors. Chem. Eng. J. 2021, 405, 127038.
- Mukherjee, G.; Thote, J.; Aiyappa, H.B.; Kandambeth, S.; Banerjee, S.; Vanka, K.; Banerjee, R. A porous porphyrin organic polymer (PPOP) for visible light triggered hydrogen production. Chem. Commun. 2017, 53, 4461–4464.
- Zhang, H.; Xu, Z.; Mao, Y.; Zhang, Y.; Li, Y.; Lao, J.; Wang, L. Integrating Porphyrinic Metal-Organic Frameworks in Nanofibrous Carrier for Photodynamic Antimicrobial Application. Polymers 2021, 13, 3942.
- Ognibene, G.; Gangemi, C.M.A.; Spitaleri, L.; Gulino, A.; Purrello, R.; Cicala, G.; Fragalà, M.E. Role of the surface composition of the polyethersulfone–TiiP–H2T4 fibers on lead removal: From electrostatic to coordinative binding. J. Mater. Sci. 2019, 54, 8023.
- Li, D.; Fang, Y.; Zhang, X. Bacterial Detection and Elimination Using a Dual-Functional Porphyrin-Based Porous Organic Polymer with Peroxidase-Like and High Near-Infrared-Light-Enhanced Antibacterial Activity. ACS Appl. Mater. Interfaces 2020, 12, 8989–8999.
- Chen, Y.; Fang, Y.; Yu, J.; Gao, W.; Zhao, H.; Zhang, X. A silsesquioxane-porphyrin-based porous organic polymer as a highly efficient and recyclable absorbent for wastewater treatment. J. Hazard. Mater. 2021, 406, 124769.
- Li, M.; Zhao, H.; Lu, Z.Y. Porphyrin-based porous organic polymer, Py-POP, as a multifunctional platform for efficient selective adsorption and photocatalytic degradation of cationic dyes. Microporous Mesoporous Mater. 2020, 292, 109774.
- EL-Mahdy, A.F.M.; Zakaria, M.B.; Wang, H.X.; Chen, T.; Yamauchi, Y.; Kuo, S.W. Heteroporous bifluorenylidene-based covalent organic frameworks displaying exceptional dye adsorption behavior and high energy storage. J. Mater. Chem. A 2020, 8, 25148–25155.
- Bain-Ackerman, M.J.; Lavallee, D.K. Kinetics of Metal-Ion Complexation with N-Methyltetraphenylporphyrin. Evidence Concerninga General Mechanism of Porphyrin Metalation. Inorg. Chem. 1979, 18, 3358–3364.
- Angelis, F.D.; Fantacci, S.; Sgamellotti, A.; Pizzotti, M.; Tessore, F.; Biroli, A.O. Time-dependent and coupled-perturbed DFT and HF investigations on the absorption spectrum and non-linear optical properties of push–pull M(II)–porphyrin complexes (M = Zn, Cu, Ni). Chem. Phy. Lett. 2007, 447, 10–15.
- Torre, G.; Vazquez, P.; Lopez, F.A.; Torres, T. Role of Structural Factors in the Nonlinear Optical Properties of Phthalocyanines and Related Compounds. Chem. Rev. 2004, 104, 3723–3750.
- Uttamlal, M.; Holmes-Smith, A.S. The excitation wavelength dependent fluorescence of porphyrins. Chem. Phys. Lett. 2008, 54, 223.
- Gangemi, C.M.A.; Iudici, M.; Spitaleri, L.; Randazzo, R.; Gaeta, M.; D’Urso, A.; Gulino, A.; Purrello, R.; Fragalà, M.E. Polyethersulfone Mats Functionalized with Porphyrin for Removal of Para-nitroaniline from Aqueous Solution. Molecules 2019, 24, 3344.
- EL-Mahdy, A.F.M.; Lai, M.Y.; Kuo, S.W. Highly fluorescent covalent organic framework as hydrogen chloride sensor: Roles of schiff base bonding and π-stacking. J. Mater. Chem. C 2020, 8, 9520–9528.
- Wu, J.H.; Chen, W.C.; Liou, G.S. Triphenylamine-based luminogens and fluorescent polyimides: Effects of functional groups and substituents on photophysical behaviors. Polym. Chem. 2016, 7, 1569–1576.
- EL-Mahdy, A.F.M.; Elewa, A.M.; Hung, S.W.; Chou, H.H.; Kuo, S.W. Dual-Function Fluorescent Covalent Organic Frameworks: HCl Sensing and Photocatalytic H2 Evolution from Water. Adv. Opt. Mater. 2020, 8, 2000641.
- EL-Mahdy, A.F.M.; Young, C.; Kim, J.; You, J.; Yamauchi, Y.; Kuo, S.W. Hollow Microspherical and Microtubular Carbazole-Based Covalent Organic Frameworks and Their Gas and Energy Storage Applications. ACS Appl. Mater. Interface 2019, 11, 9343–9354.
- Mohamed, M.G.; EL-Mahdy, A.F.M.; Kotp, M.G.; Kuo, S.W. Advances in porous organic polymers: Syntheses, structures, and diverse applications. Mater. Adv. 2022, 3, 707–733.
- Annalinda, C.; Giuseppe, M.; Maria, E.F.; Luca, S.; Antonino, G. Conjugated Gold–Porphyrin Monolayers Assembled on Inorganic Surfaces. Chem. Eur. J. 2017, 23, 14937–14943.
