Speckle tracking echocardiography is a novel technique to quantify cardiac function and deformation. It has been applied in a series of cardiovascular diseases for the evaluation of early cardiac impairment. Cardiac damage usually occurs earlier in patients with primary aldosteronism than those with primary hypertension, probably because aldosterone hypersecretion is more commonly observed in the former than the latter patients.
Speckle tracking echocardiography is a novel technique to quantify cardiac function and deformation. It has been applied in a series of cardiovascular diseases for the evaluation of early cardiac impairment. Cardiac damage usually occurs earlier in patients with primary aldosteronism than those with primary hypertension, probably because aldosterone hypersecretion is more commonly observed in the former than the latter patients. In this article, we will review the imaging studies, especially with speckle tracking echocardiography, for the detection of early cardiac dysfunction in primary aldosteronism as a disease model.
- speckle tracking echocardiography
- primary aldosteronism
- cardiac dysfunction
1. Introduction
2. Diagnosis and Screening of Primary Aldosteronism
3. Left Cardiac Evaluation
3.1. Left Ventricular Remodeling
3.2. Systolic Dysfunction
3.3. Diastolic Dysfunction
4. Right Cardiac Evaluation
5. Cardiac Myocardial Work Evaluation
5. Cardiguac Myocare 3
Evaluation
Strain analysis is useful in the quantitative assessment of cardiac functional perfor- mance. However, strain parameters are still load dependent [67] as evidence that the decrease of strain might also be affected by the elevation of left ventricular afterload [68]. An even newer technique, the left ventricular pressure–strain loop, which is based on speckle tracking echocardiography and cardiac afterload [69], may provide more infor- mation on cardiac physiological changes under various loading conditions than global longitudinal strain in cardiac evaluation [70]. This advanced technique included four major myocardial work indices: global myocardial work index (GWI), global constructive work (GCW),global wasted work (GWW) and global work efficiency (GWE). In brief, GWW and GWE might act as indices of energy loss to indicate dyssynchrony and remodeling [71,72], while GWI and GCW are more related to the total energy and oxygen consumption at various after loads [73]. These indices have shown advantages in the early diagnosis of coronary artery disease [74] and the prediction of cardiac resynchronization therapy response over global longitudinal strain [75].
This novel method has recently been adopted in several studies on hypertension. Chan J et al. first investigated myocardial work analysis in hypertensive patients and found that GWIand GCW were comparable in patients with stage 1 hypertension and normotensive control subjects, but significantly increased in patients with stage 2 and 3 hypertension [76], though GWW and GWE remained similar among all groups. Jaglan A et al., on the other hand, found a significant increase in GWW in addition to the similar significant differences in GWI and GCW in patients with stage 1 and 2 hypertension and normotensive subjects [77]. Nonetheless, it should be noted that the global longitudinal strain in these studies were all comparable between groups, suggesting that these patients were in the early stage of cardiac remodeling and dysfunction. Indeed, Sahiti F et al. found that hypertension was associated with a mild increase in GCW, but a profound increase in GWW, resulting in a higher GWI and a lower GWE [78].
With this novel technique, we found that patients with primary aldosteronism had a significantly decreased GWE, but similar GWI, in comparison with primary hypertensive patients and normotensive subjects (Figure 3) [79]. We speculated that similar and nor- malized total myocardial work could possibly be a compensation at the expense of work efficiency. Furthermore, we found that the global work efficiency was also significantly correlated with the plasma urinary aldosterone level (r = −0.43 for both, p < 0.001,
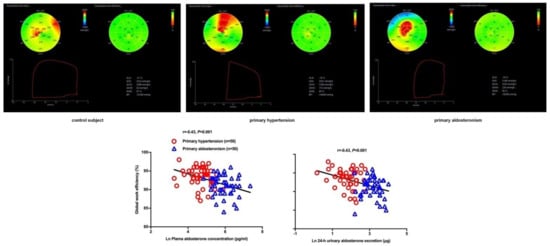
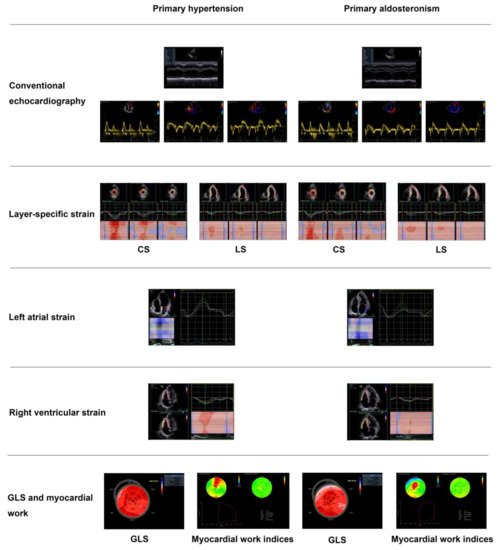
3), independent of left ventricular mass index and blood pressure. A summary figure of main echocardiographic findings is presented in Figure 4 between patients with primary hypertension and those with primary aldosteronism.
. Myocardial work analysis in a control subject (
), primary hypertensive patient (
) and primary aldosteronism patient (
) and the correlation analysis between global work efficiency with plasma aldosterone concentration (
) and urinary aldosterone excretion (
). The correlation coefficients and corresponding p values are given for all subjects. Reproduced from Chen YL, et al. [79].
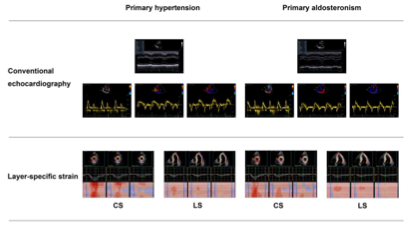
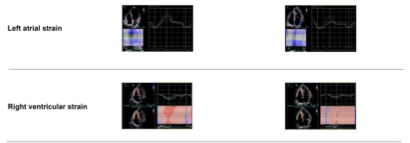
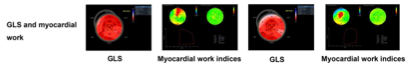
. Main echocardiographic findings in primary hypertension and primary aldosteronism. Two representative cases of different echocardiographic parameters in a patient with primary hypertension (
) and in another with primary aldosteronism (
6. Myocardial Fibrosis
7. Treatment Effect on Cardiac Structure and Function
) with similar blood pressure. CS—circumferential strain; GLS—global longitudinal strain; LS—longitudinal strain. Values in the figure are expressed as below. Blood pressure: 149/69 in the primary hypertensive patient vs. 150/83 mmHg in the primary aldosteronism patient; left ventricular mass index: 97 vs. 145 g/m2, respectively; E/A: 1.4 vs. 0.88, respectively; E/e’: 10.4 vs. 18.9, respectively; CSendo (basal short- axis view): −42.8 vs. −39.2%, respectively; CSmid: −26.3 vs. −21.5%, respectively; CSepi: −13.6 vs. −10.4%, respectively; LSendo (four-chamber view): −21.4 vs. −19.9%, respectively; LSmid: −19.0 vs. −16.4%, respectively; LSepi: −16.8 vs. −13.3%, respectively; LASs (left atrial strain, four- chamber view): 27.8 vs. 20.4%, respectively; LASe: 17.6 vs. 10.7%, respectively; LASa: 10.3 vs. 9.8%, respectively; right ventricular four-chamber longitudinal strain: −24.6 vs. −17.3%, respectively; GLS: −18.5 vs. −16.2%, respectively; global myocardial work index: 2201 vs. 2196 mmHg%, respectively; global constructive work: 2336 mmHg% vs. 2322 mmHg%, respectively; global wasted work: 174 vs. 234 mmHg%, respectively; global work efficiency: 93 vs. 90%, respectively.
6. Myocardial Fibrosis
In addition to left ventricular hypertrophy, hyperaldosteronism has also been shown to be associated with myocardial fibrosis [80], which might further worsen cardiac diastolic and systolic function, impact cardiac remodeling and increase ventricular stiffness [81]. Car- diac magnetic resonance (MR) imaging has been an established reference imaging method for the assessment of cardiac anatomy and function [82]. According to the cardiomyo- pathic process, myocardial fibrosis can be classified as replacement, diffuse interstitial and infiltrative interstitial fibrosis [81,83]. The first two types of fibrosis are usually pre- sented in hypertensive patients and could be detected by cardiac MR imaging. Myocardial replacement fibrosis is characterized by increased extracellular volume distribution that may cause late gadolinium enhancement (LGE) [84]. It is considered as the later stage of disease when cellular damage and cardiomyocyte necrosis have appeared [85]. In an early cardiac MR imaging study, Rudolph A et al., found that the presence of non-infarct LGE patterns was recognized in about 50% of the patients with hypertension-induced left ventricular hypertrophy and was significantly correlated with left ventricular mass index [86]. Diffuse interstitial fibrosis, on the other hand, is another type of myocardial fibrosis seen in hypertensive patients with a diffuse distribution within the interstitium as well as the perivasculature [87], which could not be detected with LGE. Thus, T1 mapping with the evaluation of extracellular volume fraction in cardiac MR imaging was developed as a quantitative technique to identify this type of fibrosis by computing the pre- and post-contrast T1 value of the myocardium and blood pool together with hematocrit [88]. Several studies have demonstrated high values of extracellular volume fraction and native T1 in hypertensive patients, both of which were associated with left ventricular mass and left ventricular hypertrophy [89,90].
Freel EM et al. first investigated cardiac fibrosis in patients with primary aldosteronism using cardiac MR imaging [91]. They found a 4.3 times higher prevalence of non-infarct related replacement fibrosis in patients with primary aldosteronism than those with primary hypertension. Su MY et al., on the other hand, found a significant increase in diffuse fibrosis compared with control subjects, although replacement fibrosis was not measured in their study [92]. In a recent study, extracellular mass index was significantly increased only in primary aldosteronism, while extracellular volume fraction increased in both primary and secondary aldosteronism, possibly because left ventricular structure was associated with primary pathological aldosterone secretion [93]. On the contrary, in another study, Grytass MA et al., did not find any difference in diffuse interstitial fibrosis between the patients with primary aldosteronism and the control subjects [94]. The contradictory results between the two studies might be explained by the difference in the blood pressure level and sample size and by the difference in antihypertensive therapy as mineralocorticoid receptor antagonists or adrenalectomy might affect the fibrosis extent in primary aldosteronism.Speckle tracking echocardiography might also be useful in the evaluation of my- ocardial fibrosis. Several previous studies showed good agreement between this echocar- diographic technique and cardiac MR imaging. Strain parameters derived from speckle tracking echocardiography have a significant predictive value in the identification of delayed LGE segments and intramyocardial hemorrhage in acute ST-segment elevation myocardial infarction [95,96]. Global longitudinal strain has been shown to be significantly correlated with the degree of replacement fibrosis in patients with dilated cardiomyopa- thy [97]. Regional longitudinal strain, on the other hand, might be the best indicator to detect segmental fibrosis in patients with hypertrophic cardiomyopathy [98]. Besides, a significant and inverse correlation between left atrial reservoir strain and myocardial fibrosis was also demonstrated by cardiac MR in patients with atrial fibrillation [99]. With the novel left ventricularpressure–strain technique, Galli E et al., found in patients with hypertrophic cardiomyopathy that GCW, instead of global longitudinal strain, had significant predic- tive value for left ventricular fibrosis [100]. We recently applied this echocardiographic technique to investigate myocardial fibrosis in primary aldosteronism, with cardiac MR imaging as standard. We found that GWE was associated with focal replacement fibrosis as assessed by cardiac MR imaging, while another fibrosis type, diffuse interstitial fibrosis, was associated with abnormalities in aldosterone and renin [101].
7. Treable 1
tment Effect on Cardiac Structure and Function
Current clinical guidelines recommend adrenalectomy for unilateral primary aldos- teronism and medical treatment for bilateral idiopathic hyperaldosteronism orthose who are unwilling to undergo surgery [19,22,102]. Several previous studies have demonstrated that these treatments, especially adrenalectomy, may reverse the cardiac structural alter- ations such as left ventricular hypertrophy [30,103]. In a prospective study, Lin YH. et al., found a significant regression of left ventricular mass index and a decrease in the cyclic vari- ation of integrated backscatter in patients with adrenalectomy at 1 year of follow-up [29,30]. In a retrospective study of drug treatment, Ori Y. et al., found that left ventricular mass index significantly decreased at 1 year of follow-up and normalized at 3 years [104]. Besides, the regression of left ventricular hypertrophy and the reduction in right ventricular volume measured by cardiac MR were also prospectively observed at 3 and 6 months of follow-up in a drug treatment study by Gaddam K et al. [105]. In a comparison study, Catena C. et al., prospectively found that the response of left ventricular mass occurred earlier in adrenalectomized patients than in those treated with spironolactone but later became comparable in the two groups of patients during an average follow-up of 6.4 years [40]. On the contrary, other studies have shown a significant regression in left ventricular mass in the surgery group, while the medical treatment group showed no change or slightly decreased in cardiac structure [106–108]. However, these results should be interpreted with caution, because the clinical characteristics and echocardiographic parameters at baseline and the follow-up time were different.
The surgical and medical treatments not only regressed left ventricular structure, but also improved diastolic function when evaluated by E/e’. Indra T et al. found that E/e’ was significantly decreased in both surgically and medically treated patients during a median follow up of 64 months [109]. Chang YY et al. demonstrated that patients with adrenalectomy had an improvement in diastolic function as reflected by a significant decrease in E/e’ [110]. They further demonstrated that only patients with KCNJ5 mutation, but not those with other mutations, had a significant improvement in diastolic function and regression of left ventricular mass after surgery [111].
Previous studies rarely investigated treatment effects on alterations in systolic function, possibly because of the limitations of evaluation with conventional echocardiography. Speckle tracking echocardiography has recently been applied in the evaluation of treatment effects of cardiovascular diseases such as coronary artery disease and heart failure [112,113]. Nonetheless, there is limited data on the effect of antihypertensive medications on left ventricular strain, probably because of the difficulties in differentiating the effect of antihypertensive drugs from that of blood pressure reduction [114]. The left ventricular pressure–strain loop analysis might overcome this dilemma and be useful in the evaluation of treatment effects in primary aldosteronism, as this technique takes the left ventricular afterload into consideration. In a recent study, Ikonomidis I et al., found that cardiac function defined as an increase in GCW and a decrease in GWW was significantly improved in diabetic patients treated with combination therapy of two new antidiabetic agents [115]. We used the speckle tracking echocardiographic technique, including global longitudinal strain and myocardial work indices, to investigate treatment effects of adrenalectomy and min- eralocorticoid receptor antagonists in patients with primary aldosteronism [116]. In a 6-month follow-up study, we observed that surgery, but not drug treatment, significantly improved global longitudinal strain and GWE; though both treatments effectively lowered blood pressure and normalized serum potassium. The changes in GWE were dependent on the changes in the aldosterone level in patients treated with spironolactone but not those treated with adrenalectomy, indicating that adrenalectomy might have treatment effects over and beyond reductions in the aldosterone secretion and mineralocorticoid receptor antagonism (
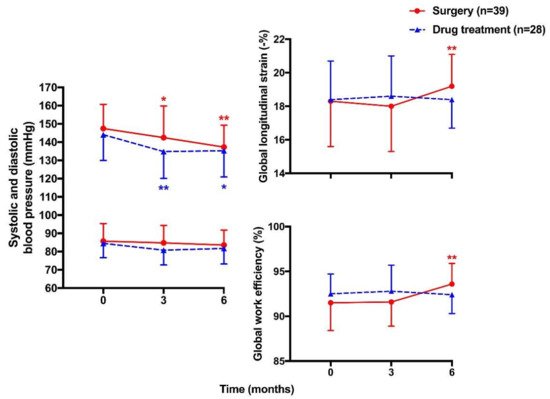
).
. Mean (± SD) values of systolic (
) and diastolic blood pressure (
) and global longitudinal strain (
) and global work efficiency (
| First Author | Year | Study Design | Participants | No. of Participants | Age (y) | Sex (Male) | Outcome Measures | Results | Summary of Findings |
|---|---|---|---|---|---|---|---|---|---|
| Rossi GP [9] | 1996 | Cross-sectional | PA vs. PH | 34 vs. 34 | 51 ± 13 vs. 49 ± 12 | 18 vs. 18 | LVMI | 112 ± 5 vs. 98 ± 4 g/m2 | |
| 0.43 ± 0.05 vs. 0.36 ± 0.07 | |||||||||
| Significantly increased diffuse fibrosis in PA compared with controls | |||||||||
| First Author | Year | Study Design | Participants | No. of Participants | Age (y) | Sex (Male) | Outcome Measures | Results | Summary of Findings | |||||||||||||||
|---|---|---|---|---|---|---|---|---|---|---|---|---|---|---|---|---|---|---|---|---|---|---|---|---|
| Chen ZW [34] | 2018 | Cross-sectional | Significantly greater LVMI and higher prevalence of LVH in PA than PH | |||||||||||||||||||||
| PA vs. PH | 36 vs. 31 | 49 ± 11 vs. 53 ± 12 | 15 vs. 16 | GLS | −17.8 ± 2.4 vs. −20.3 ± 2.3% | Significantly lower GLS in PA than PH | Matsumura K [27] | 2006 | Cross-sectional | PA vs. Renovascular hypertension | 25 vs. 29 | 47 ± 2 vs. 45 ± 4 | ||||||||||||
| Wang D [39 | 13 vs. 10 | LVMI | 154 ± 7 vs. 135 ± 9 g/m | 2 | Higher prevalence of LVH in PA than renovascular hypertension | |||||||||||||||||||
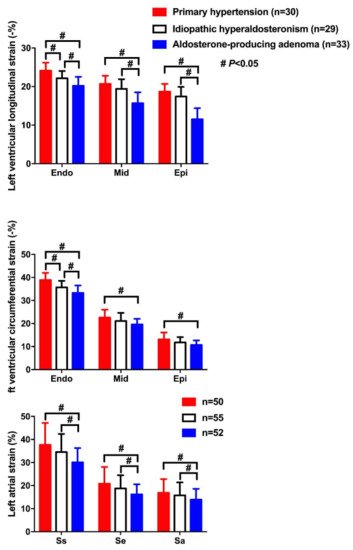
| ] | 2019 | Cross-sectional | APA, IHAand PH | 33, 29 and 30 | 49 ± 10, 52 ± 8 and 51 ± 20 | 20, 22 and 18 | LS&CS | LSendo: −20.2 ± 2.3, −22.1 ± 1.9 and −24.1 ± 2.1% LSmid: −15.7 ± 2.8, −19.4 ± 2.5 and −20.7 ± 21% LSepi: −15.8 ± 2.1, −19.6 ± 2.2 and −21.2 ± 1.9% CSendo: −33.3 ± 3.2, −35.7 ± 2.8 and −38.9 ± 3.1% CSmid: −19.6 ± 2.4, −21.1 ± 3.5 and −22.6 ± 3.4% CSepi: −10.7 ± 2.0, −11.8 ± 2.3 and −13.1 ± 3.0% |
Lowest CS and LS in endocardium (endo), midmyocardium (mid) and epicardium (epi) in APA, intermediate in IHA, and highest in PH | Muiesan ML [10] | 2008 | Cross-sectional | PA vs. PH | 125 vs. 125 | 50 ± 11 vs. 51 ± 11 | 71 vs. 71 | LVMI | 50 ± 17 vs. 40 ± 11 g/m2.7 | Significantly higher prevalence of inappropriate LVMI in the absence of traditionally defined LVH in PA than PH | |||||
| Wang D [40] | 2019 | Cross-sectional | APA, IHA and PH | 52, 55 and 50 | 52 ± 11, 51 ± 10 and 50 ± 17 | Yang Y [12] | 2017 | Cross-sectional | PA vs. PH | 100 vs. 100 | 50 ± 12 vs. 50 ± 12 | 58 vs. 58 | LAVI&E/e’ | LAVI: 23 ± 6 vs. 21 ± 6 mL/m2 E/e’: 13.5 ± 4.3 vs. 11.9 ± 3.3 |
Significantly lower e’ and higher E/e’ in PA than PH, in addition to left atrial enlargement | |||||||||
| LVMI | 142 ± 28 at baseline, 121 ± 21 at 1 year and 112 ± 24 g/m | 2 | at 3 years | Significant decrease in LVMI at 1 year and normalized at 3 years | ||||||||||||||||||||
| Rossi GP [106] | 2013 | Prospective longitudinal | PA | Surgery 110 vs. Drug treatment 70 | 51 ± 12 in PA patients | 57 in PA patients | LVMI | 53 ± 13 vs. 50 ± 11 g/m2.7 at baseline 49 ± 10 vs. 47 ± 8 g/m2.7 during follow-up |
Significant regression in LVMI in surgery but with slight decrease in drug treatment at a median of 36 months follow-up | |||||||||||||||
| 35, 34 and 33 | LAS&LASR | LASs: 30.1 ± 6.2, 34.5 ± 7.9 and 37.7 ± 9.5% | LASe: 16.2 ± 4.4, 18.8 ± 5.7 and 20.8 ± 7.3% | LASa: 13.9 ± 4.7, 15.8 ± 5.6 and 16.9 ± 6.0% LASRs: 1.8 ± 0.6, 1.9 ± 0.4 and 2.1 ± 0.7/s LASRe: 1.6 ± 0.4, 1.7 ± 0.4 and 1.9 ± 0.6/s LASRa: 1.5 ± 0.5, 1.6 ± 0.6 and 1.8 ± 0.5/s |
Significantly lower LAS and LASR during atrial reservoir (s), conduit (e) and contractile (a) phases in APA than IHA and PH | |||||||||||||||||||
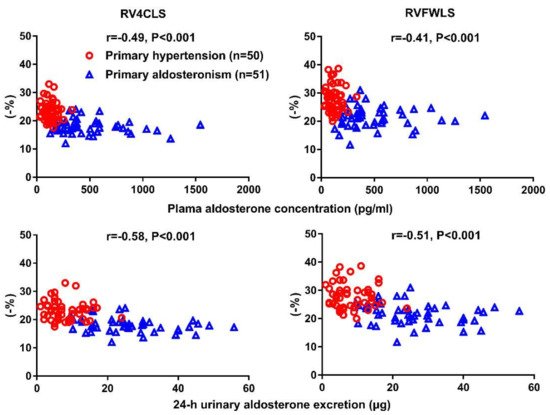
| Chen YL [66] | 2020 | Cross-sectional | PA vs. PH | 51 vs. 50 | 51 ± 11 vs. 53 ± 11 | 34 vs. 30 | RV4CLS & RVFWLS | RV4CLS: −18.1 ± 2.5 vs.−23.3 ± 3.4% RVFWLS: −21.7 ± 3.7 vs. −27.9 ± 4.5% |
Significantdecrease in both RV4CLS and RVFWLS in PA than PH | Catena C [41] | ||||||||||||||
| Chen YL 2007 | [Prospective longitudinal | 79]PA | Surgery 24 vs. Drug treatments 30 | 53 ± 12 in PA patients | 38 inPA patients | 2021 | Cross-sectional | PA vs. PHLVMI | 53 ± 11 vs. 52 ± 11 g/m2.7 at baseline 45 ± 12 vs. 49 ± 11 g/m2.7 at 1 year 43 ± 11 vs. 44 ± 11 g/m |
50 vs. 50 | 51 ± 10 vs. 55 ± 11 | 32 vs. 33 | Strain (GLS) and myocardial work indices (GWI, GCW, GWW, & GWE)2.7 at the end of study | Earlier response of LVM regression in surgery than drug treatment but later comparable in the two groups during an average of 6.4 years follow-up | ||||||||||
| GLS: −18.0 ± 2.1 vs. −19.2 ± 2.0% | GWI: 2336 ± 333 vs. 2366 ± 288 mmHg% | GCW: 2494 ± 325 vs. 2524 ± 301 mmHg% | GWW: 206 ± 75 vs. 142 ± 56 mmHg% | GWE: 91.1 ± 2.7 vs. 93.5 ± 2.5% |
Significant decrease in GLS and GWE and increase in GWW in PA than PH, with similar GWI and GCW in the two groups | Lin YH [29] | 2011 | [ | Prospective longitudinal | PA | Surgery 11 | 116 | 47 ± 8 | 5 | LVMI | ] | 2021 | Prospective longitudinal | PA | 153 ± 31 at baseline vs. 116 ± 12 g/m2 at 1 year | Significant regression in LVMI at 1 year | |||
| Surgery 39 vs. Drug treatment 28 | 49 ± 10 vs. 49 ± 12 | 26 vs. 22 | Strain (GLS) and myocardial work indices (GWI, GCW, GWW, & GWE) | GLS: −18.3 ± 2.7 vs. −18.4 ± 2.3% at baseline | Indra T [111 | |||||||||||||||||||
| Chen YL | 19.2 ± 1.9 vs. 18.4 ± 1.7% at 6 months | GWI: 2372 ± 388 vs. 2335 ± 341 mmHg% at baseline | 2280 ± 344 vs. 2208 ± 306 mmHg% at 6 months | GCW: 2510 ± 360 vs. 2437 ± 293 mmHg% at baseline 2436 ± 335 vs. 2330 ± 311 mmHg% at 6 months GWW: 201 ± 87 vs. 164 ± 56 mmHg% at baseline 142 ± 58 vs. 164 ± 53 mmHg% at 6 months GWE: 91.5 ± 3.1 vs. 92.5 ± 2.2% at baseline 93.6 ± 2.3 vs. 92.4 ± 2.1% at 6 months |
Significant improvement in GLS and GWE in surgery but not drug group at 6-month follow-up | Ori Y [104] | 2013 | Retrospective | PA | Drug treatment 48 | 61 ± 10 | 28] | 2015 | Prospective longitudinal | PA | Surgery 15 vs. Drug treatment 16 | 49 ± 11 vs. 51 ± 7 | 9 vs. 11 | LVMI&E/e’ | LVMI: 50 ± 12 vs. 53 ± 12 g/m2.7 at baseline 39 ± 9 vs. 49 ± 11 g/m2.7 at the end of study E/e’: 9.6 ± 3.0 vs. 14.4 ± 4.4 at baseline 7.1 ± 1.1 vs. 8.7 ± 1.0 at the end of study |
Significant decrease in E/e’ in both surgery and drug treatment groups, with regression of LVMI only in surgery group | |||
| Freel EM [91] | 2012 | Cross-sectional | PA vs. PH | 27 vs. 53 | 54 ± 11 vs. 55 ± 9 | 21 vs. 42 | LGE | 70% vs. 13% | 4.3 times higher prevalence of non-infarct related replacement fibrosis in PA than PH | |||||||||||||||
| Su MY [92] | 2012 | Cross-sectional | PA vs. Controls | 25 vs. 12 | 50 ± 13 vs. 49 ± 14 | 6 vs. 7 | EV |
Values are expressed as mean ± SD. APA—aldosterone-producing adenoma; CS—circumferential strain; GCW—global constructive work; GLS—global longitudinal strain; GWE—global work efficiency; GWI—global work index; GWW—global wasted work; IHA—idiopathic hyperaldosteronism; LAS—left atrial strain; LASR—left atrial strain rate; LS—longitudinal strain; PA—primary aldosteronism; PH—primary hypertension; RV4CLS—right ventricular four-chamber longitudinal strain; RVFWLS—right ventricular free wall longitudinal strain.
) of the left ventricle at baseline and during follow-up in patients treated with surgery (circles with solid lines) and drugs (triangles with dashed lines). * p < 0.05, ** p < 0.01 vs. baseline. Reproduced from Chen YL, et al. [116].
8. Biomarkers in Primary Aldosteronism
Plasma aldosterone concentration and plasma renin activity are the major diagnostic biomarkers in primary aldosteronism. Besides, the 24 h urinary aldosterone excretion could also be useful to the diagnosis [18–20]. N-terminal pro B-type natriuretic peptide (NT-proBNP) was found significantly higher in patients with primary aldosteronism than those with primary hypertension and was correlated with plasma aldosterone level [117]. In our cardiac MR study, it was associated with both focal replacement and diffuse interstitial fibrosis [101]. During the follow-up study, a reduced pre-treatment plasma aldosterone level after surgical removal of the adrenal gland and increased post-treatment plasma renin activity in the medically treated patients were shown to be possibly predictive of favorable changes in cardiac structure and clinical outcomes [118,119].
9. Conclusions and Perspectives
Strain echocardiography is useful in the early detection of cardiac structural and functional alterations in both the left and the right heart. Primary aldosteronism is a very good disease model for the research of this novel technology for several reasons. First, patients with primary aldosteronism develop cardiac structural and functional changes earlier and more severely than those with primary hypertension at similar levels of blood pressure. Second, there are specific treatments, either surgical or medical, for primary aldosteronism. Treatment effects can be studied for both intermediate and hard clinical outcomes. Third, there is increasing awareness of primary aldosteronism. With the use of an automated chemiluminescence technique for the measurement of plasma renin and aldosterone concentration, massive screening is feasible. There would be a huge number of patients with hypertension and primary aldosteronism diagnosed and treated [120].
Strain echocardiography may be increasingly used in the evaluation of cardiac func- tion at various stages of the disease, such as at the diagnosis and after surgical and medical treatment. Nonetheless, this advanced echocardiographic technique in primary aldostero- nism has been recently adopted in primary aldosteronism. There are still a number of unresolved research questions, such as its long-term predictive value for major adverse cardiac events. Future research should address whether strain echocardiography may provide prognostic value and guide the choice of treatment modalities, and hence improve clinical outcomes.