Your browser does not fully support modern features. Please upgrade for a smoother experience.
Please note this is a comparison between Version 1 by Daehoon Kang and Version 4 by Vivi Li.
As an alternative method to the practical limitations of air cooling, liquid cooling methods have drawn attention. Liquid cooling can dissipate heat up to 202 W/cm2, which is approximately six times higher than that of conventional air cooling. The liquid cooling can be divided into one-phase driven by a pump and two-phase cooling using pool boiling.
- immersion cooling
- porous foam
- pool boiling
- surface enhancement
- liquid cooling
- data center
1. Introduction
Industrial Revolution 4.0, as well as the development of related industries, such as autonomous driving vehicles, cloud computing, artificial intelligence, and big data technology, have caused the IT sector to consume approximately 10% of the world’s energy in 2020 and is expected to consume 20% by 2030 [1]. The performance of the data center is expressed in terms of power usage effectiveness (PUE), which is the ratio of the total energy usage to the actual computing energy. The ideal PUE is 1.0, and the average PUE in 2019 was 1.67, indicating that 67% of the computing energy was used for the other activities, including cooling [2]. To manage or process large-scale data, the demand for data centers is rapidly growing. Because appropriate cooling techniques must be used to operate the data center efficiently, a variety of studies related to thermal management methods have been conducted. Although the thermal issues in the data center over the past decades have been addressed by air-cooling methods, the technical limitations of air cooling (37 W/cm2) are yet to be addressed [3] owing to the dense and high-performance computing.
As an alternative method to the practical limitations of air cooling, liquid cooling methods have drawn attention. Liquid cooling can dissipate heat up to 202 W/cm2 [4], which is approximately six times higher than that of conventional air cooling. Therefore, liquid cooling technologies have been adopted as an efficient thermal management strategy for various electronic components as well as for data center cooling. For example, Google used the tensor processor unit for deep learning of Alpha-Go in 2016 [5]. Intel predicts that liquid cooling will gradually be adopted as computing increasingly becomes dense [6]. CRAH (computer room air handler) is a method of employing coil with chilled water instead of an air conditioner CRAC (computer room air conditioner). This method circulates air into the coil in the aisle or rack unit. Alternatively, an evaporative cooling method controls the humidity of the circulating air, which can ensure the PUE is as low as 1.2; however, this requires a large quantity of water. For instance, a 20 MW data center necessitated cooling water in a quantity that can be used by 2500 people [7]. Moreover, liquid cooling can be effective for the thermal management of the electronic components of electric vehicles, such as power modules [8][9][10][11][8,9,10,11], insulated-gate bipolar transistors [12][13][14][15][12,13,14,15], and battery packs [16][17][18][16,17,18].
For liquid cooling, it is crucial to select a suitable liquid depending on the application and regulation of various types of available liquids. Water-based fluids, such as ethylene glycol, may damage electronic circuits owing to short circuits when the liquids are in direct contact, thus mineral oils were introduced to single-phase immersion cooling and contact cooling, albeit at risk of fire [19]. ASHRAE periodically establishes safety guidelines for working fluids based on flammability and toxicity [20]. In compliance with environmental regulations, cooling liquids with ozone depletion potential have been regulated since the Montreal Protocol in 1987. Refrigerants with high global warming potentials (GWPs) have been banned since the Kyoto Protocol in 1997. The value of regulation gradually increased, especially after the Paris Agreement in 2015. Accordingly, fluorocarbon-based liquids are in disfavor owing to their high GWP, although two-phase immersion cooling studies have often been conducted with fluorocarbons, such as FC-72 and PF-5060. Another consideration is the boiling point of cooling liquids. Two-phase cooling demands a boiling point lower than the maximum allowable temperature of the electronics. Conversely, single-phase cooling entails liquids whose boiling points are higher than the highest operating temperature of the electronics. Table 1 lists the various liquids used in the data center cooling.
Table 1.
Various liquids used for cooling and their boiling temperatures and GWPs.
| Product Name | Chemical Formula | Boiling Temp. (°C) | GWP | Note |
|---|---|---|---|---|
| HFE-7000 | CF3CF2CF2OCH3 | 34 | 575 | |
| Novec-649 | C2F5C(O)CF(CF3)2 | 49 | 0.6 | |
| FC-72 | C6F14 | 56 | >5000 | High GWP |
| PF-5060 | CxFy | 56 | >5000 | High GWP |
| HFE-7100 | C4F9OCH3 | 61 | 320 | |
| HFE-7200 | C4F9OC2H5 | 76 | 55 | |
| HFE-7300 | C7H3F13O | 98 | 310 | |
| Water | H2O | 100 | - | Corrosive |
| Mineral oil | CnH2n+2 | >100 | - | Flammable |
| Ethylene Glycol | C2H4(OH)2 | >100 | 4 | Conductive |
Figure 1 shows the classification of the liquid cooling techniques [13]. Direct-to-chip cooling (Figure 1a,b) circulates the liquid from the outer cooler (or heat exchanger) to the inner cold plate in contact with the hot components. Immersive-type cooling (Figure 1c–e) includes chassis and tub-type cooling by direct contact between dielectric liquids and hot components. In general, immersion cooling is preferred over direct-to-chip cooling for new sites. Heat is dissipated in the outer cooling circuit for single-phase cooling (Figure 1c,d) and by condensation for two-phase cooling (Figure 1e). Two-phase cooling typically offers a higher heat transfer coefficient (HTC) than single-phase cooling [8]. Heat dissipation with single-phase cooling can be increased by increasing the flow rate using a pump; however, the additional energy required to run the pump necessitates exploring various types of two-phase liquid cooling (both direct-to-chip and immersion type) methods.
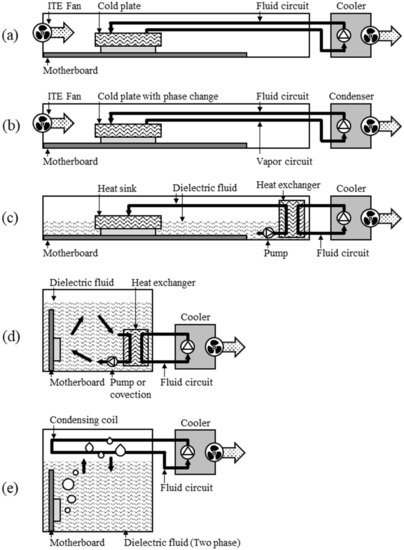
Figure 1. Diagrams of liquid cooling technologies. Direct-to-chip cooling with (a) a single and (b) two-phase liquid. (c) Immersive chassis-type cooling with a single/two-phase liquid. Immersive tub-type cooling with (d) a single and (e) two-phase liquid [21].
Two-phase cooling can be divided into pool boiling, submerged jet impingement, and confined jet impingement, as shown in Figure 2 [4]. Contrarily to pool boiling without a driving device, the jet impingement method directly injects a liquid on the surface, which can boost the heat flux beyond 202 W/cm2 of basic pool boiling [22]. However, it requires additional devices and energy to generate the flow. Current technological advances in thermal management may not require such a high heat flux. This enstrudy focuses on pool boiling without additional driving force to enhance heat dissipation, particularly liquid-based two-phase immersion cooling for data centers. ResearchersWe described the fundamentals of boiling heat transfer for two-phase cooling technology, thermal management applications based on pool boiling, and immersion cooling technologies under two sub-topics: single-layer surface treatment and substructure fabrication. Thereafter, researcherswe discussed the cooling performance and future work for the thermal management of data centers.
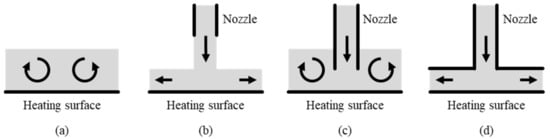
Figure 2. Types of submerged two-phase boiling. (a) Pool boiling. (b) Jet impingement. (c) Submerged jet impingement. (d) Confined jet impingement.
2. Two-Phase Boiling Heat Transfer Depending on the Morphology of the Heat Dissipating Structure
In typical immersion cooling, heat-dissipating surfaces increase the temperature of the cooling liquid. Initially, only single-phase convection occurs when the surface temperature is slightly higher than the boiling point of the liquid. The onset of nucleate boiling (ONB) occurs with an increase in the surface temperature, and the heat dissipation from the surface increases with more bubbles as the surface increasingly becomes hot. The relationship between the surface (or wall) temperature and heat flux is shown in Figure 3. After ONB and before the critical heat flux (CHF), the heat flux increases with increasing the wall superheat, which is referred to as fully developed nucleate boiling. A further increase in the wall superheat causes transition and film boiling, where the surface is covered by vapor, and then heat dissipation is reduced. Because of this risk, a cooling system is often designed at 70% of the CHF [23]. Kutateladze and Zuber [24] expressed the CHF as Equation (1). CHF is proportional to the Zuber constant, the phase change enthalpy, and gas density, and related to surface tension, gravity, and liquid density.
(1)
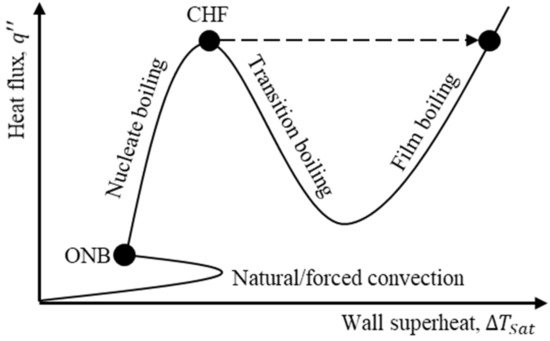
Figure 3. The b Boiling curve shows the ting typical relationship between wall superheat (difference in temperature between the heated surface and liquid) and heat flux.
According to the expression, the CHF is determined by the properties of the liquid and constant C. Liquid properties are highly dependent on pressure; Cichelli and Bonilla experimentally demonstrated that CHF increases with pressure up to one-third of the critical pressure. The constant C is independent of the surface material, weakly dependent on the surface geometry, and has a value between 0.1 and 0.2. In this enstrudy, only the effect of constant C was summarized, and the pressure was the same as the atmospheric pressure. Data center cooling requires that the chip temperature (i.e., superheat) is maintained under the desired limit while maximizing the heat flux. The temperature of typical commercial silicon devices must be maintained below 125 °C [25].
The cooling performance is dependent on various factors, including the surface inclination and morphology. For example, the heat dissipation was similar until the inclination angle of the heated surface was vertically placed. When the heated surface was placed upside down over 120 °C, the air bubbles were not discharged properly, and the heat dissipation was reduced [26]. The performance of two-phase immersion cooling can be enhanced by properly designing the surface morphology to promote bubble generation in the nucleate boiling stage. In this enstrudy, the morphology was categorized based on the roughness of the flat surfaces, porous foam, and sub-structures, as illustrated in Figure 4. Common performance indicators are CHF and HTC in the literature, and many studies report their results by applying heat to the unit area (1 cm2) without characterizing the boiling curve. Therefore, reswearchers summarized these separately for surface treatment, porous foam, and sub-structure fabrication strategies in the following sections.
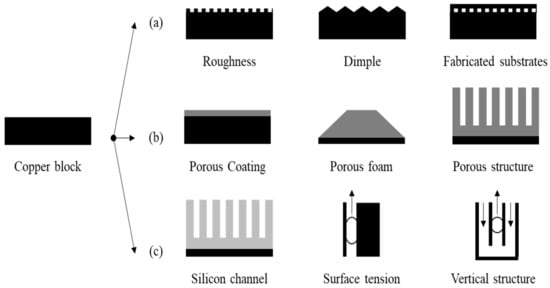
Figure 4. Three different types of morphologies, (a) surface treatment, (b) porous foam, and (c) sub-structures, to enhance boiling heat transfer.
3. Surface Treatment
El-Genk et al. [27] created different surfaces with average roughness in the range of 0.039~1.79 μm using sandpaper with grit sizes of 120–2500, and investigated the transient growth rate, departure diameter, and frequency of bubbles [23]. The density of the active sites increased as the roughness increased. HTC increased by more than 100%, but it did not change the CHF.
The oxidation on the surface as an additional variable did not significantly affect the heat transfer characteristics [28]. Different coolants, HFE-7000 and PF-5060, were compared with surfaces with an average roughness of 0.039~0.58 μm, showing that HFE-7000 has better cooling performance than PF-5060 because of the higher latent heat of vaporization and surface tension [29]. Duan et al. [29] controlled the surface roughness using sandpaper and a femtosecond laser and observed lower superheat temperatures with rougher surfaces when water was used as a coolant. The boiling curve was affected by both the roughness and roughness techniques. There is limited evidence that wettability affects the boiling curve, and sub-structural researchers have conducted further studies. Thermo-economic and exergy analyses show that the immersion cooling data center can improve performance, including the coefficient of performance (COP), power usage efficiency (PUE), exergy efficiency, and system cost compared to conventional data center cooling with a room-size experimental setup using HFE-7100 by identifying the energy consumption of each component [30].
Leong et al. [31][32][31,32] investigated the CHF, HTC, and saturation temperature depending on the surface with fins and millimeter-scale lattice cavity structure using selective laser melting. Al-6061 was placed on copper, and an irregular surface was created by a laser. Both the HTC and CHF were enhanced by increasing the surface area and nucleation site. The size per unit lattice structure was used as a variable, and there was an optimal value that produced the ideal performance. The effects of dimples on copper surfaces have been investigated [33]. Dimples were made using a ball mill, and the optimal diameter existed at a fixed depth. The CHF and maximum HTC were higher when the temperature of the dielectric liquid was lower than the boiling point. Table 2 summarizes the CHF and maximum HTC corresponding surfaces and cooling liquids after surface treatments. Ra is the average surface roughness.
Table 2. Experiments of single-layer surface treatment.
| Surface | Liquid | CHF (W/cm2) |
Max HTC (W/cm2K) |
Reference |
|---|---|---|---|---|
| Smooth copper | HFE-7100 | 24.5 | - | 2003, El-Genk [26] |
| Roughened copper (Ra = 0.039–0.58 μm) |
HFE-7000 | 30 | 1.9 | 2019, El-Genk [34] |
| PF-5060 | 20.6 | 1.44 | ||
| Roughened copper (Ra = 0.039–1.79 μm) |
PF-5060 | 20.9 | 1.6 | 2014, El-Genk [27] |
| Roughened Copper (Ra = 0.039–1.79 μm) |
PF-5060 | 21.5 | 1.67 | 2015, El-Genk [23] |
| Roughened copper (Ra = 0.045–1.22 μm) |
Water | 120 | 10 | 2020, Duan [29] |
| Dimples on copper | PF-5060 | 19.3 | 1.06 | 2016, El-Genk [33] |
| Smooth copper | FC-72 | 47.9 | 1.27 | 2016, Leong [31] |
4. Porous Ffoam
4.1. Effect of the Porous Foam
Copper, graphite, and nickel were used in porous foam studies. The studies comparing the thermal dissipation effects of porous and general copper blocks are as follows. El-Genk et al. [28][34][28,35] reported that porous copper has the highest natural convection cooling rate among rough surfaces, porous graphite, porous copper, and micro-structured methods, and has been experimented with porous graphite to create more nucleate sites. The superheated temperature of the surface decreased owing to the adhesion of the porous foam, which indicates an increase in HTC. In addition, the best HTC was observed at a temperature of 30 °C lower than the boiling temperature. Leong et al. [35][36] and El-Genk et al. [36][37] compared two types of graphite foam, as well as a general copper block in FC-72 and HFE-7000. The thermal resistance of HFE-7000 is smaller than that of FC-72. The large pore diameter discharged the bubbles well, which is expressed by the buoyancy to surface tension ratio. The thermal conductivity and pore size are mutually related, and there exists a maximization point for the HTC.
4.2. Modeling and Experimental Study
Theoretical and computational studies are useful in predicting heat transfer behavior, although numerical values may differ from actual experimental values. El-Genk et al. [37][38] performed a thermal analysis by 3D modeling of porous graphite with HFE-7100 with various tilting angles and subcooling temperatures and suggested equations describing the relationship between the peak heat flux at the center of the chip and the lowest heat flux at the edge of the chip. They recommended the attachment of a heat-spreading layer comprised of porous graphite with a size larger than that of the heating chip. Further numerical study with 3D modeling of the anisotropic composite spreader layer [38][39] has been conducted to calculate the total thermal resistance and temperature distribution by varying the thickness and thermal conductivities, as well as the ratio of copper to graphite. Manetti et al. [39][40] gathered the relationship between CHF and HTC and suggested a predictive model. They modeled the entire experimental device in 3D, contrary to the other authors, who only modeled the experimental space. Chakravarty et al. [40][41] computationally studied a thick porous copper bed in distilled water, the same as Figure 5. They found that thermal conductivity ratio and bed geometry, such as trapezoids, cylinders, and cones, affect the flow field and temperature distribution, and the permeability and heat generation rate of the porous bed influence the energy distribution. In addition, they proposed a model based on geometry and then compared it with known experimental values [41][42]. Porosity, which is the volumetric ratio of individual particle size, affects fluid transport and heat transfer, and the critical power density at the dryout varies as a function of the bed geometry. In particular, the height of the bed and the area of the upper interface determine the power density at the dryout. Among the cylinders, taller structures showed better performances, and for the same height, a truncated conical shape resulted in better performance than a cylinder.
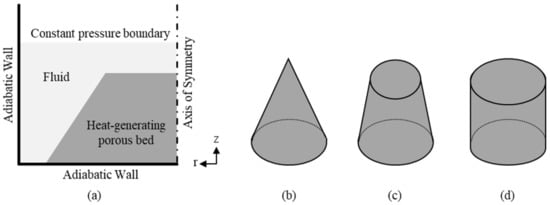
Figure 5. Examples of the porous bed modeling in the cylindrical coordinate system. (a) Cross- section. (b) Cone shape bed. (c) Trapezoid shape bed. (d) Cylinder shape bed.
The experimental studies for each variable of the porous foam are as follows: El-Genk et al. [26] compared the effects of liquids, including FC-72 and HFE 7100. The authors investigated the performance according to the thickness and porosity of the foam; however, the combinations according to the conditions were limited [42][43]. The thickness and porosity of the copper dendrites were determined by controlling the proportion of the electrolyte. The best performance was observed at a thickness of 145 µm. Therefore, further research has increased the thickness to 230 microns [43][44]. Porosity was the same. As the thickness increased, the CHF increased. However, an optimal thickness for the best HTC and lowest superheat temperature existed. In a further study, only 80 and 197 microns were studied, and the performance was compared according to the angle [44][45]. Leong et al. [45][46] compared the case of coating all surfaces with carbon nanotubes and the case of interlaced coating. Even if only a part of the surface was coated, the performance was similar. Therefore, the minimum amount of coating or pattern could be studied. The performance was also checked according to the angle; however, this showed the same trend as in previous studies. Manetti et al. [46][47] compared the experimental results of a plain copper surface, copper foam, nickel foam, and their own model to verify its validity. The copper foam exhibited a higher CHF than the nickel foam. As the thermal conductivity and pore diameter of the foam increased, the HTC was affected positively. The reduction in pore diameter has the advantage of reducing the overshoot of the superheat temperature until the onset of nucleate boiling. The authors compared the performance based on the thickness of the copper foam [47][48]. At a lower heat flux than 5 W/cm2, it was shown that a thickness of less than a certain value degrades the performance. At a high heat flux, it was considered that the increase in wickability prevented liquid replenishment and hotspot generation, decreased heat resistance, and increased HTC by reducing the bubble trap.
4.3. Applied Subjects
The following studies were conducted to create porous foam into fin shapes. Zhao et al. [48][49] made a fin-shaped copper foam and then heated it using water. It exhibited a higher HTC and lower superheat temperature. There were optimal thicknesses and optimal fin numbers. Leong et al. [49][50] investigated the performance of GF in a finned shape. However, the general cuboid block type generated more bubbles than the finned shape, owing to increased nucleation sites. FC-72 showed a lower superheat temperature than HFE-7000.
Some studies used more than one foam. Zhao et al. [50][51] compared the experiments for a layer of high-pore-density Ni and low-pore-density Ni with a layer of high-pore-density Cu and low-pore-density Ni. Compared to the Ni foam, the Cu-Ni mixture foam showed good performance at low heat flux and poor performance at high heat flux. This enstrudy showed that there is an optimal foam formulation ratio depending on the amount of heat dissipation.
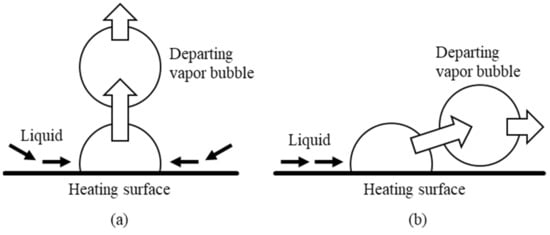
Table 3. Experiments with a porous foam.
| Surface | Liquid | CHF (W/cm2) |
Max HTC (W/cm2K) |
Reference |
|---|---|---|---|---|
| Copper foam | PF-5060 | 3 | - | 2015, El-Genk [28] |
Figure 6.
Type of bubble separation. (
a
) Normal to the surface (
b
) Along the surface.
Kandlikar et al. continuously researched open channel microchannels (heat sinks) in which the fins are arranged in an upward direction as the same as Figure 7a. Water was used as the liquid, and a silicon structure was placed on the copper chip [52][53]. The shape of the fin and notch, and the ratio of the area of the chip to the channel were variables. A larger area and longer fin showed a higher HTC. In addition, a picture was taken showing the bubble rising from the bottom of the channel by following the wall. The authors predicted that the structure and wettability can quickly remove bubbles. Furthermore, they added more cases and analyzed the bubble dynamics [53][54]. They found that thinner finned surfaces, as well as wider and deeper channels, exhibit higher HTCs. Thereafter, they studied the increase in heat transfer using the evaporation momentum force obtained by the difference in density between the liquid and vapor [54][55]. The authors coated a part of the surface with a carbon nanotube and evaluated its performance. First, the protrusions of open-channel microchannels were coated [55][56]. The shape of the fins and channels and the number of fins were considered variables. There was a channel width that resulted in optimal performance. They found that when the channel was wide, the liquid entered the channel and created a rising flow toward the fin, which increased the heat dissipation. In addition, they used FC-87 as a liquid, and then compared the results with those of water studies [56][57]. Next, they coated the wall and the bottom of the open-channel microchannels [22]. In this case, the narrower the channel width, the better the performance. When the channel is wide, the liquid does not sufficiently wet the floor, which prevents the generation of air bubbles. The authors developed an idea to divide the nucleate region and the region where bubbles do not occur. This helps to induce the flow for the liquid to easily descend to wet the surface. First, the authors divided the two regions by conducting an extensive study on coating, and then demonstrating that this approach can improve the performance [57][58]. Second, the authors suggested an analytic model dividing the two regions by extending the 2013 channel study, which made the descending liquid flow through the fin and created bubbles at the bottom [58][59].
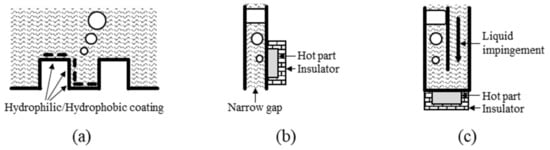
Figure 7. Examples of experimental setting (a) Silicon channel with the partial surface coating (b) Using surface tension (c) Vertical guidance tube.
5.2. Buoyancy and Surface Tension
The studies based on using buoyancy and gravity in the form of a vertical plane with a thin gap between glass and a vertical pipe are as follows. Lee et al. [59][60] fabricated a porous coating on a vertical Al plate surface and immersed part of it in distilled water to increase the water on the surface as the same as Figure 7b. As the particle size increases, the CHF increases. They suggested a model that predicts the dryout time based on the pressure drop of the porous layer. In addition, they conducted further experiments using acetone, methanol, and ethanol [60][61]. Novec 7100 was compared using only the formula. A copper sheet was heated with a glass and a 0.5 mm narrow gap in distilled water [61][62]. When the surface was smooth, the boiling curve changed according to the narrow gap; however, the boiling curve was maintained with the porous surface until the gap decreased to 1 mm. Cheng et al. [62][63] mathematically expressed heterogeneous nucleation on convex and concave surfaces prior to the experiment. They showed that when the pipe is fabricated vertically, the same as Figure 7c, pool boiling can flow in a certain direction without a gear pump [63][64].
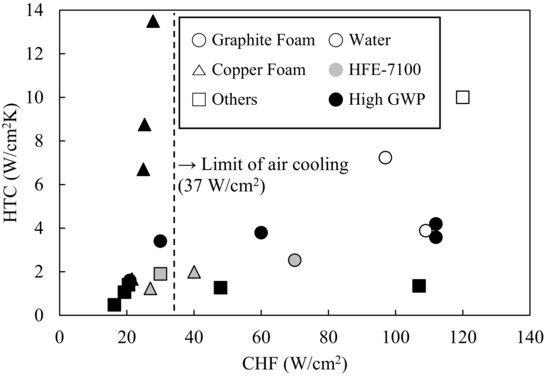
Table 4. Experiments of structure configuration.
| Surface | Liquid | CHF (W/cm2) |
Max HTC (W/cm2K) |
Reference | |||||
|---|---|---|---|---|---|---|---|---|---|
| Silicon channel | Water | 97 | 7.23 | 2011, Kandlikar [53] | Graphite foam | HFE-7100 | 66.4 | ||
| Silicon channel | Water- | 2005, El-Genk [ | 244 | 24.435] | |||||
| 2012, Kandlikar [ | 54 | ] | Graphite foams | ||||||
| Silicon channelHFE-7000 | Water112 | 300- | 2011, Leong [36] | ||||||
| 62.9 | 2013, Kandlikar [ | 55] | FC-72 | 112 | - | ||||
| Carbon coating | Water | 325 | 99.5 | 2014, Kandlikar [56] | Graphite foams | HFE-7000 | 112 | 3.58 | 2012, Leong [50] |
| Carbon coating | FC-87 | 37 | 2.0 | 2015, Kandlikar [57] | FC-72 | 112 | 4.19 | ||
| Carbon coating | Water | 420 | 290 | 2016, Kandlikar [22] | Graphite foam | HFE-7100 | 33 | - | 2012, El-Genk [38] |
| Carbon coating | Water | 394 | 71.3 | 2016, Kandlikar [58] | FC-72 | 30 | 3.4 | ||
| Silicon channel | Water | 300 | 62.9 | 2016, Kandlikar [59] | Graphite foam | PF-5060 | 20.5 | 1.4 | 2016, El-Genk [39] |
| Aluminum | Water | 1.49 | - | 2020, Lee [60] | Copper foam Nickel foam |
Water, n-pentane, FC-72, FC-87 |
- | 0.6 | 2017, Manetti [40 |
| Aluminum | Hydrocarbon | ] | |||||||
| 0.16 | - | 2020, Lee [61] | Copper foam | Water | |||||
| Copper | Water- | - | 2016, Chakravarty [41] | ||||||
| 205 | - | 2020, Lee [62] | Copper foam | Water | |||||
| Copper foam | - | Water- | 2020, Chakravarty [ | 147 | -42] | ||||
| 2013, Zhao [ | 48 | ] | Graphite foam | HFE-7100 | 70 | 2.53 | 2008, El-Genk [37] | ||
| Copper foam Nickel foam |
Water | 140 | - | 2016, Zhao [50] | FC-72 | 60 | 3.79 | ||
| Copper | Water | 109 | 3.88 | 2019, Cheng [64] | Copper foam | PF-5060 | 25.27 | 8.76 | 2010, El-Genk [ |
| Lattice structure of aluminum alloy | FC-72 | 43] | |||||||
| 107 | Copper foam | PF-5060 | 27.8 | 13.5 | 2010, El-Genk [44] | ||||
| Copper foam | PF-5060 | 24.9 | 6.7 | 2012, El-Genk [45] | |||||
| 1.35 | Coating on Silicon | FC-72 | 16.3 | 0.48 | 2014, Leong [46] | ||||
| Copper foam Nickel foam |
HFE-7100 | 27 | 1.24 | 2020, Manetti [47] | |||||
| Copper foam | HFE-7100 | 40 | 2 | 2020, Manetti [48] |
5. Sub-Sstructure Fabrication
5.1. Shape and Surface Conditions of Channels
The terms used in structure-based research are as follows: impingement is a term used in flow boiling research, and it can refer to inducing flow using a structure in pool boiling. Kandlikar et al. [51][52] reviewed previous studies on separating the liquid-vapor pathway by structure. They stated that macro-convection exhibits the best performance, as shown in Figure 6, removing bubbles from the liquid. In the influence region, it can also be called micro convection, transient conduction, or contact line evaporation. It includes a method in which the liquid approaches from all directions and raises the bubble upward, or the liquid approaches from the side and pushes the bubble to the other side.| 2018, Leong [ |
| 32 |
| ] |
6. Convection scheme by CHF and HTC
Single-phase liquid cooling has been adopted as an efficient thermal management strategy for various electronic components as well as data center cooling. However, the increase in energy consumption of the data center necessitates an advanced cooling strategy with higher heat transfer performance, such as two-phase immersion cooling. This work categorized two sub-topics of immersion cooling technologies and then summarized the recent advances. First, a single-layer surface treatment for immersion cooling methods was summarized. Some representative porous materials, such as porous copper and porous graphite, have higher surface areas than plain substrates. This expanded surface area causes an increase in the number of sufficient nucleation sites for boiling heat transfer, which is proportionally related to the better cooling performance. Moreover, several previous studies have investigated the effect of substructure fabrication on the two-phase heat transfer occurring on the surface. They revealed that by applying a wide range of sub-structures, including fins, microchannels, and fin-shaped foams, the heat transfer performance can be further improved. Finally, researchwers summarized the major characteristics and performance factors of recent advances in two-phase immersion cooling technologies. Figure 8 summarizes some of the experimental results of the above studies. This enstrudy only covered pool boiling, but not the range of HTC over 100 W/cm2K, which can be reached by jet impingement with a pump and is called flow boiling. The limit of air cooling (37 W/cm2), which is the reason for the introduction of liquid cooling, is indicated by the dotted line. The cases of using a high GWP refrigerant are indicated in black; that of using the low-GWP refrigerant, such as HFE-7100, are indicated in gray; that of using water are indicated in white. The cases of using graphite and copper foams are indicated by the circles and triangles, respectively, while the other cases are indicated by squares. Figure 8 can be compared with Figure 8 [52]. The experimental results reviewed in this papentryr are summarized in Figure 8 and are mostly CHF below 150 W/cm2, wall superheat below 20 °C, and HTC below 15 W/cm2.Figure 8. Summary of the cases.
Summary of the cases.
7. Patents
Table 5 shows the representative patents dealing with two-phase immersion cooling. The patents in the same column mean the same content. Bitfury suggested the ideas which are auxiliary condensing space [65], a flow path that collects bubbles from the surface [66], the connection of two or more tubs [67]. TMGCore suggested the ideas which are a pressure adjustment space in the entrance of the motherboards [68] and preventing leakage by injecting inert gas when opening the entrance [69]. TMGCore supplemented the description of the robot arm [70], the condensing coil and pressure control [71], the auxiliary condensing space [72], and the application for adsorption system [73].
Table 5. Representative patents.
| Bitfury | TMGCore |
|---|---|
| 2016-06-15 GB2549946A 2017-11-09 US 20170325355A1 [65] 2019-02-12 US10206307B2 (abandoned) |
2018-10-19 US11102912B2 2019-11-12 US10477726B1 [68] |
| 2016-06-29 GB2550356B 2017-11-16 US20170326489A1 2020-09-08 US10765983B2 [66] |
2020-03-19 US20200093026A1 2020-04-07 US10617032B1 [70] |
| 2021-03-30 US10966349B1 [67] | 2020-03-19 US20200093025A1 2020-04-14 US10624237B2 [71] |
| 2020-03-19 US20200093038A1 2020-05-12 US10653043B2 [72] |
|
| 2020-03-19 US20200093032A1 2020-08-24 US11102912B2 [69] |
|
| 2021-01-21 US20210022263A1 2021-05-18 US11013144B2 2021-09-02 US20210274677A1 [73] |
8. Future research needs
Some available approaches for future research are as follows:- (1) The bubble dynamics and energetic analysis of the chip level are well developed. However, economic analysis of the rack level is at an early stage.
- (2) PF liquids are prohibited by regulation. Experiments using new dielectric liquids under previous conditions are required. Water shows good heat transfer performance, but it is not dielectric.
- (3) The experimental conditions for the porous foam do not vary. Various combinations of pore size, particle size, porosity, and thickness may be possible.
- (4) There is concern that the porous foam or coating on the surface will fall off and the metal powder will harm the device. Research addressing these concerns is required.
- (5) The advantage of using a two-phase pool boiling immersion tub is the absence of a moving or controlling device. Therefore, it is important to show how the tub condition changes in a variable heat situation rather than a constant heat. The dynamic control of the condensing coil can be studied.
- (6) The boiling curve depends on the pressure applied to the fluid and not only on the surface condition. It is necessary to check whether there are benefits to increasing the performance by pressurizing the tanks rather than operating under atmospheric pressure. The idea of balancing the pressure between the auxiliary condensing space and the multi-tank can be studied.
- (7) Tall structures using gravity and buoyancy show a heat transfer performance as high as when using a pump. However, compared to the surface-level treatment, the volume becomes larger. Research is required to determine the economic feasibility of using a large volume versus improved heat transfer performance.
- (8) Methods to prevent leakage of dielectric liquid can be studied.