Your browser does not fully support modern features. Please upgrade for a smoother experience.
Please note this is a comparison between Version 1 by Clovis Chabert and Version 2 by Rita Xu.
Preventing the cytokine storm observed in COVID-19 is a crucial goal for reducing the occurrence of severe acute respiratory failure and improving outcomes. The analysis of transcriptomic data from lung samples of patients who died from COVID-19 demonstrates an increased expression of the gene encoding AKR1B10.
- cytokines
- inflammation
- COVID-19
1. Introduction
The Coronavirus Disease 2019 (COVID-19) infection, which rapidly spread worldwide, was declared a pandemic on 11 March 2020 by the World Health Organisation [1]. The intense campaign of vaccinations that protect against severe COVID-19 forms in several countries currently contributes to the fight against the pandemic [2]. Nonetheless, the vaccination appears insufficient to completely prevent the circulation of the virus, and the occurrence of severe forms requiring the Intensive Care Unit (ICU) is still associated with high mortality rates [3]. Hence, developing new approaches to detect SARS-CoV2 infection [4][5][4,5] and preventing the occurrence of the most severe cases of Acute Respiratory Distress Syndrome (ARDS) associated with severe COVID-19 forms represents a crucial strategy to reduce the burden of the COVID-19 pandemic. Although COVID-19 is associated with a wide range of symptoms [6], life-threatening ARDS are tightly triggered by a massive inflammatory burst, named a cytokine storm [7]. Among the released cytokines, the Tumour Necrosis Factor α (TNFα), Interleukine-6 (IL-6), Interleukine-1β (IL-1β), or the Interferon γ (IFNγ) have been identified by several studies as major ARDS-inducing factors [7][8][7,8]. Several therapeutic strategies have tried to reduce the cytokine storm burden with a limited impact (e.g., Remdesivir [9], Ivermectin [10], hydroxychloroquine [11]). Currently, corticosteroids are the most effective anti-inflammatory drugs, reducing the mortality of ventilated patients by one-third, and of patients requiring oxygen therapy by one-fifth [12]. Nonetheless, long term use of corticosteroids during Severe Acute Respiratory Syndrome CoronaVirus 2 (SARS-CoV2) infection may also be deleterious [13]. For all these reasons, dissecting the mechanisms triggering the cytokine storm and identifying new pharmacological targets remains a burning question in COVID-19 management.
The aldo/keto reductases (AKR) are part of a super-family of NADPH-dependent enzymes (15 members in humans) which were first identified as catalysers of redox transformations, mainly involved in biosynthesis, metabolism, and detoxification [14]. In the year 2000, AKR1B10 was identified as a regulator of inflammation [15] and several publications have reported that it is required for the nuclear translocation of the Nuclear Factor kappa B (NF-κB) and phosphorylation/degradation of IκB-α, stimulating the expression of pro-inflammatory cytokines. This pro-inflammatory role of AKR1B10 makes it a potential drug target in the medical care of many chronic diseases associated with inflammation [16][17][16,17]. Inhibitors of AKR1B10 have successfully been tested in animal and cellular models to block the inflammation response induced by various stresses, including hyperglycaemia, Lipopolysaccharides (LPS), TNFα, and oxidative stress [18][19][20][21][22][18,19,20,21,22]. AKR1B10 is upregulated in several chronic diseases associated with low-grade inflammation, known to increase the risk of severe forms of COVID-19. Indeed, Chronic Obstructive Pulmonary Disease (COPD) [17], various types of cancer [16], diabetes [23], and Non-Alcoholic Fatty Liver Disease (NAFLD) [24][25][24,25], strongly associated with type II diabetes [26][27][26,27], are conditions associated with both high AKR1B10 expression and a high proportion of severe COVID-19 forms.
2. AKR1B10 Is Overexpressed in the Lung of Deceased COVID-19 Patients and Correlated with an Enrichment of Pro-Inflammatory and Cytokine Genes
The analysis of transcriptomic data of lung samples from patients who died from COVID-19 shows a significant increase of AKR1B10 (Fold Change (FC): 8.58; adjusted p-value: 1.07 × 10⁻⁶), ranking it as the 13th most over-expressed gene (Figure 1A).
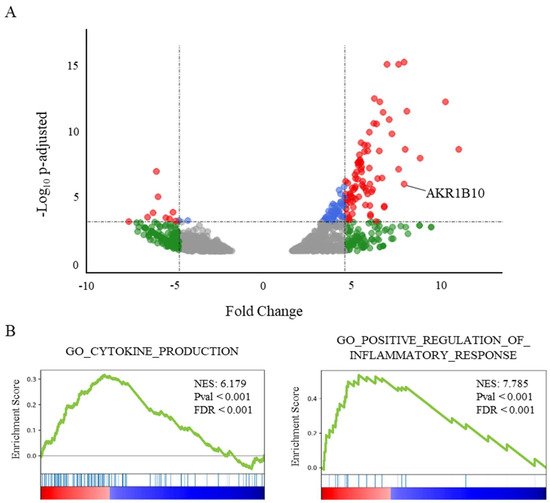
Figure 1. AKR1B10 is among the most frequently overexpressed genes in post-mortem lungs from severe COVID-19 patients. (A) Volcano plot showing the differential gene expression in lung tissue from deceased COVID-19 patients vs. healthy donors, reduced to genes over- or under-expressed with an FDR < 0.02 (from available transcriptomic data [28]). ● corresponds to an adjusted p-value < 0.001; ● corresponds to a fold change > 5; and ● corresponds to both. (B) GeneSet Enrichment Analysis (GSEA) plots of two genesets associated with the respective Gene Ontology terms CYTOKINE_PRODUCTION (NES: 6.18; FDR < 0.001) and POSITIVE_REGULATION_OF_INFLAMMATORY_RESPONSE (NES: 7.79; FDR < 0.001) illustrating two major components of the transcriptomic signature in lungs from severe COVID-19 patients.
Interestingly, AKR1B10 is the only overexpressed gene of the AKR1B gene family, since the over-expressions of AKR1B1 and AKR1B15 do not reach significance (FDR over the threshold value fixed at 0.02). A GeneSet Enrichment Analysis (GSEA, [29]) of the genes differentially expressed in the post-mortem lungs of COVID-19 patients (Figure 1B) highlights a major role for an inflammatory process involving the over-expression of cytokines or their receptors. Indeed, the genesets associated with the Gene Ontology terms “cytokine production” (NES: 6.18; FDR < 0.001), as well as the “positive regulation of inflammatory response” (NES: 7.79; p < 0.001), were found among the most significantly enriched genesets.
3. AKR1B10 Levels Are Increased in the Blood of COVID-19 Patients with Severe or Critical Forms of the Disease Compared to Moderate Forms
AKR1B10 presents the particularity of circulating in the human blood stream upon its expression. Indeed, a previously published work reported that AKR1B10 could be detected in the blood of patients suffering from different forms of cancers [30][31][30,31]. Based on these data, rwesearchers hypothesised that sera from COVID-19 patients could be used to evaluate the extent of AKR1B10 expression and to link sera levels to the severity of the disease. Consequently, a dosage of AKR1B10 was performed in the blood samples from a cohort of 104 patients, and the results were analysed considering their disease severity and various biological and physiological parameters (detailed in Table 1).
Table 1.
Characteristics of two groups of COVID-19 patients defined according to their hospitalisation either in a respiratory ward (
n
= 61) or in an intensive care unit (
n
= 43). (
n
= 104; mean ± SEM); ICU: Intensive Care Unit, BMI: Body Mass Index; PaO
2: arterial pressure in oxygen; CT-Scan: percentage of lung ground glass opacity and area with more condensed aspect. HT: Hypertension; COPD: Chronic Obstructive Pulmonary Disease.
| ICU | Adjusted p-Value |
||||||
|---|---|---|---|---|---|---|---|
| Mean | ± | SEM | Mean | ± | SEM | ||
| Sex (F/M) | 26/35 | 18/25 | |||||
| Survival (% [Surv-deceased]) | 98.4% [60/1] | 37.2% [16/27] | <0.001 | ||||
| Nb. of comorbidities: | |||||||
| 0 (n (%)) | 39 (63.9%) | 15 (34.9%) | <0.01 | ||||
| 1 (n (%)) | 12 (19.7%) | 16 (37.2%) | <0.05 | ||||
| >=2 (n (%)) | 10 (16.4%) | 12 (27.9%) | 0.16 | ||||
| Nature of comorbidities: | |||||||
| Diabetes (n (%)) | 9 (15%) | 13 (30%) | 0.06 | ||||
| HT (n (%)) | 16 (26%) | 15 (35%) | 0.35 | ||||
| COPD (n (%)) | 2 (3%) | 4 (9%) | 0.20 | ||||
| Renal disease (n (%)) | 1 (2%) | 2 (5%) | 0.37 | ||||
| Cancer (n (%)) | 4 (7%) | 7 (16%) | 0.11 | ||||
| Age (year) | 66.1 | ± | 8.51 | 71.6 | ± | 10.68 | 0.31 |
| BMI (kg/m²) | 26.4 | ± | 3.66 | 26.8 | ± | 4.12 | 0.31 |
| PaO2 (mmHg) | 59.9 | ± | 7.84 | 53.3 | ± | 8.21 | <0.01 |
| CRP (mg/L) | 92.3 | ± | 10.58 | 138.1 | ± | 20.98 | 0.09 |
| CT-Scan (%) | 33.3 | ± | 4.68 | 55.3 | ± | 8.22 | <0.01 |
| Lymphocytes (abs. x10/µL) | 1.57 | ± | 0.17 | 0.86 | ± | 0.13 | <0.001 |
| Fibrinogen (mg/dL) | 570.4 | ± | 73.54 | 588.5 | ± | 87.59 | 0.99 |
| D.Dimer (ng/mL) | 2192 | ± | 286.02 | 3860 | ± | 560.52 | 0.31 |
| Creatinine (mg/dL) | 1.41 | ± | 0.18 | 1.38 | ± | 0.21 | 0.64 |
| Ferritin (ng/mL) | 546.0 | ± | 55.65 | 917.1 | ± | 152.55 | <0.05 |
| LDH (UI/I) | 421.9 | ± | 54.75 | 528.6 | ± | 79.23 | 0.06 |
| Procalcitonin (ng/mL) | 0.32 | ± | 0.04 | 1.01 | ± | 0.63 | 0.31 |
| Non-ICU | ICU | Adjusted p-Value |
|||||
|---|---|---|---|---|---|---|---|
| Mean | ± | SEM | Mean | ± | SEM | ||
| Sex (F/M) | 26/35 | 18/25 | |||||
| Survival (% [Surv-deceased]) | 98.4% [60/1] | 37.2% [16/27] | <0.001 | ||||
| Nb. of comorbidities: | |||||||
| 0 (n (%)) | 39 (63.9%) | 15 (34.9%) | <0.01 | ||||
| 1 (n (%)) | 12 (19.7%) | 16 (37.2%) | <0.05 | ||||
| >=2 (n (%)) | 10 (16.4%) | 12 (27.9%) | 0.16 | ||||
| Nature of comorbidities: | |||||||
| Diabetes (n (%)) | 9 (15%) | 13 (30%) | 0.06 | ||||
| HT (n (%)) | 16 (26%) | 15 (35%) | 0.35 | ||||
| COPD (n (%)) | 2 (3%) | 4 (9%) | 0.20 | ||||
| Renal disease (n (%)) | 1 (2%) | 2 (5%) | 0.37 | ||||
| Cancer (n (%)) | 4 (7%) | 7 (16%) | 0.11 | ||||
| Age (year) | 66.1 | ± | 8.51 | 71.6 | ± | 10.68 | 0.31 |
| BMI (kg/m²) | 26.4 | ± | 3.66 | 26.8 | ± | 4.12 | 0.31 |
| PaO2 (mmHg) | 59.9 | ± | 7.84 | 53.3 | ± | 8.21 | <0.01 |
| CRP (mg/L) | 92.3 | ± | 10.58 | 138.1 | ± | 20.98 | 0.09 |
| CT-Scan (%) | 33.3 | ± | 4.68 | 55.3 | ± | 8.22 | <0.01 |
| Lymphocytes (abs. x10/µL) | 1.57 | ± | 0.17 | 0.86 | ± | 0.13 | <0.001 |
| Fibrinogen (mg/dL) | 570.4 | ± | 73.54 | 588.5 | ± | 87.59 | 0.99 |
| D.Dimer (ng/mL) | 2192 | ± | 286.02 | 3860 | ± | 560.52 | 0.31 |
| Creatinine (mg/dL) | 1.41 | ± | 0.18 | 1.38 | ± | 0.21 | 0.64 |
| Ferritin (ng/mL) | 546.0 | ± | 55.65 | 917.1 | ± | 152.55 | <0.05 |
| LDH (UI/I) | 421.9 | ± | 54.75 | 528.6 | ± | 79.23 | 0.06 |
| Procalcitonin (ng/mL) | 0.32 | ± | 0.04 | 1.01 | ± | 0.63 | 0.31 |
: arterial pressure in oxygen; CT-Scan: percentage of lung ground glass opacity and area with more condensed aspect. HT: Hypertension; COPD: Chronic Obstructive Pulmonary Disease.
| Non-ICU |
|---|
As expected, a comparison between the groups of patients respectively admitted in an intensive care unit (ICU) or a non-ICU respiratory ward shows a significant difference in survival rates (respectively, 37.2% and 98.4%; p < 0.001), a lower number of ICU patients without any comorbidity (−29%, p < 0.01) and a higher number of ICU patients with one comorbidity (+22%, p < 0.05). The physiological and biological data show that the patients with a severe COVID-19 form have lower PaO2 measurements (measured without supplemental O2 at hospital admission, −6.6 mmHg; p < 0.01), decreased lymphocyte counts (−0.71 abs. ×10/µL; p < 0.001), higher Ferritin concentrations (+371.1 ng/mL, p < 0.05), and higher CT-Scan scores (+32%; p < 0.001, based on the lung areas showing ground glass opacity and patchy consolidations). All these parameters are known to be associated with COVID-19 severity and poor outcomes.
The AKR1B10 protein concentrations measured in the sera of COVID-19 patients presented in Figure 2 shows a relationship between the concentration of the protein and the severity of the disease.
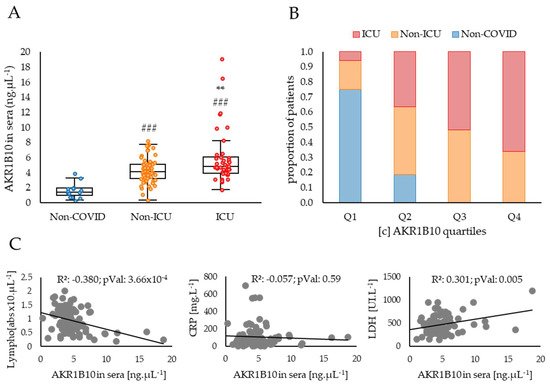
Figure 2. AKR1B10 concentration in sera is tightly associated with COVID-19 severity and correlated with other biological parameters known to be related to cytokine storm. (A) ELISA dosages of AKR1B10 in the blood of COVID-19 patients stratified into three groups corresponding to: “Non-COVID” (patients without COVID-19; n = 16, including 6 healthy individuals, 4 COPD and 6 cancer patients); “Non-ICU” (patients hospitalised in a non-ICU respiratory ward; n = 61), and “ICU” (patients admitted in an Intensive Care Unit; n = 43); (B) respective balanced proportions of patients of the non-COVID, non-ICU and ICU groups in each of the four quartiles (from Q1, the lowest, to Q4 the highest) of AKR1B10 sera concentrations; (C) correlations between AKR1B10 concentrations and Lymphocyte counts, CRP or LDH levels in the blood of COVID-19 patients. LDH: Lactate Dehydrogenase; Lympho: Lymphocyte counts; #: difference compared to Non-COVID individuals (###: p < 0.001); *: difference compared to non-ICU patients (**: p < 0.01).
Indeed, the patients included in the study, who developed a COVID-19 disease requiring hospitalisation in a non-ICU respiratory ward or in an ICU, have significantly higher levels of AKR1B10 when compared to non-COVID control subjects (respectively, +2.8 ng·µL−1, p < 0.05; and +4.3 ng·µL−1, p < 0.001). Patients developing a severe form of the disease (ICU) have higher concentrations of AKR1B10 when compared to non-ICU patients (+1.5 ng·µL−1, p < 0.01), and all patients with a concentration over 8.1 ng·µL−1 were hospitalised in the ICU. These data strongly suggest a positive correlation between AKR1B10 levels and the severity of COVID-19. The hypothesis of this association is further reinforced by comparing the respective balanced proportions of the non-COVID, non-ICU and ICU COVID patients within each of the four quartiles, Q1 (lowest) to Q4 (highest), of AKR1B10 concentrations in sera (Figure 2B). Indeed, the proportion of non-COVID subjects decreases from 75% in Q1 to 0% in Q4, whereas the proportion of ICU patients increases from 6% in Q1 to 66% in Q4. No significant change is detected for non-ICU patients whose percentage is maintained around 37 ± 0.07% between quartiles.
An analysis of the correlations between AKR1B10 concentrations in the sera of COVID-19 patients and other parameters known to be associated with inflammation and available for this cohort highlights two significant associations. Indeed, AKR1B10 concentration is negatively correlated with the lymphocyte counts (R²: 0.38; p < 0.001; Figure 2B) and positively correlated with the lactate dehydrogenase (LDH) levels (R²: 0.30; p < 0.01; Figure 2B). However, no significant correlation with the C-reactive protein (CRP) concentration is observed (R²: 0.06; ns; Figure 2B), although CRP is one of the most widely used blood markers of inflammation.
The analyses of lung transcriptomic data and blood sera from COVID-19 patients, respectively measuring AKR1B10 mRNA and protein expression, highlight a potential relationship between this factor and the severity of COVID-19. Since most severe forms of COVID-19 are associated to an intense production of cytokines related to the pro-inflammatory process (see Figure 1B), rwesearchers used cell models to modulate the AKR1B10 expression or activity, in order to test its involvement in the increased expression of cytokines.
4. AKR1B10 Drives Cytokine Production in Cellular Models
To investigate the role of AKR1B10 on inflammatory processes and particularly on the induction of the cytokine storm, reswearchers overexpressed AKR1B10GFP in a murine macrophage cancerous cell line and in a human non-small cell lung carcinoma cell line (respectively, RAW264.7 and H1299) and tested the inflammatory response of the cells by monitoring the mRNA expression of three different cytokines (IL-6, TNFα and IL-1β) known to be involved in the cytokine storm. Several inhibitors of the AKR1B10 enzyme activity already exist and have been successfully tested in different contexts of inflammation. ThWey chose one of them, Zopolrestat, and tested its effect at different concentrations on RAW264.7 cells in the context of a 0.5 µg·mL−1 lipopolysaccharides (LPS)-induced stress (Figure 3).
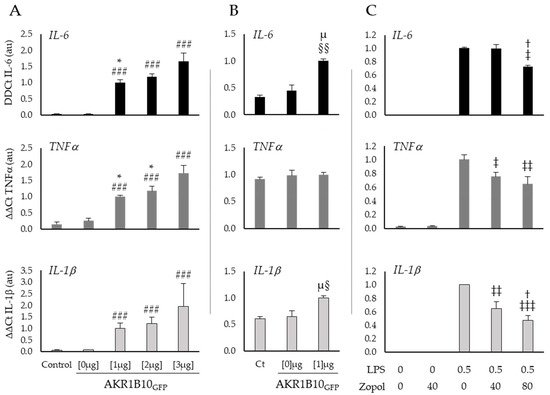
Figure 3. AKR1B10 is a key regulator of the cytokines production in RAW264.7 and H1299 cells, whose activity may be counteracted by pharmacological inhibitors. (A) Expression of the cytokines IL-6, TNFα and IL-1β, measured by RT-PCR in RAW264.7 macrophage cells after 12 h of 0 µg (Lipofectamine), 1 µg, 2 µg or 3 µg of peGFP-AKR1B10GFP plasmid transfection; (B) expression of the cytokines IL-6, TNFα and IL-1β, measured by RT-PCR in lung cancer cells H1299 after 12 h of 0 (Lipofectamine) or 1 µg of peGFP-AKR1B10GFP plasmid transfection; (C) effect of an AKR1B10 inhibitor (Zopolrestat at the indicated concentrations in mM) on cytokines expression in RAW264.7 cells stressed for 6 h by LPS, at the concentration of 0.5 µg·mL−1; LPS: Lipopolysaccharides; Zopol: Zopolrestat; (n = 3–5; mean ± SEM). #: difference compared to Control and pEGFP-AKR1B10GFP [0 µg] ( ###: p < 0.001); *: difference compared to pEGFP-AKR1B10GFP [3 µg] (*: p < 0.05); †: difference compared to LPS [0.5 µg·mL−1] and Zopolrestat [40 mM] (†: p < 0.05); §: difference compared to Control (§: p < 0.05; §§: p < 0.01); µ: difference compared to pEGFP-AKR1B10GFP [0 µg] (µ: p < 0.05); ‡: difference compared to LPS [0.5 µg·mL−1] and Zopolrestat [0 mM] (‡: p < 0.05; ‡‡: p < 0.01; ‡‡‡: p < 0.001).
Figure 3A shows a clear induction of cytokines mRNA expression by AKR1B10GFP overexpression in RAW264.7 macrophages. Indeed, when compared to the control group the transfection with 3 µg of pEGFP-AKR1B10GFP plasmid induces a 54-fold change of IL-6 (p < 0.001), a 12-fold change of TNFα (p < 0.001), and a 30-fold change of IL-1β (p < 0.001). Interestingly, these results suggest a dose–response relationship between AKR1B10GFP plasmid concentration and the cytokines production for IL-6 at 1 µg versus 3 µg (respectively, 33- and 54-fold change from the control; p < 0.05) and TNFα at 1 µg and 2 µg versus 3 µg (respectively, 7-, 8-, and 12-fold change from control, p < 0.05). Over expression of AKR1B10GFP [1 µg] in H1299 lung cancer cells (Figure 3B) induces similar effects but with a lower order of magnitude for IL-6 and IL-1β (respectively, 3-fold change from control, p < 0.01 and 1.5-fold change from control, p < 0.05) than those observed in macrophages, and no significant modification of TNFα expression (1.1-fold change from control, ns).
In order to further explore this hypothesis, rwesearchers treated RAW264.7 cells, after 6 h exposure to a well-known pro-inflammatory inducer, the lipopolysaccharides (LPS), with different concentrations of Zopolrestat to inhibit the AKR1B10 activity (Figure 3C). The mRNA measurements of the cytokines in macrophages stimulated by LPS show an increase in TNFα and IL-1β expression, which is significantly reduced by 40 mM of Zopolrestat when compared to untreated cells (respectively, −25%; p < 0.05 and −36%; p < 0.01). With a higher concentration of Zopolrestat (80 mM), the mRNA expression of all three cytokines is significantly decreased when compared to LPS exposure without Zopolrestat (IL-6: −27% p < 0.05; TNFα: −36% p < 0.01 and IL-1β: −53% p < 0.001).