A heterogeneous group of tumors can affect the posteromedial chest wall. They form diverse groups of benign and malignant (primary or secondary) pathologies that can arise from different chest wall structures, i.e., fat, muscular, vascular, osseous, or neurogenic tissues. Chest radiography is very nonspecific for the characterization of chest wall lesions. The modality of choice for the initial assessment of the chest wall lesions is computed tomography (CT). More advanced cross-sectional modalities such as magnetic resonance imaging (MRI) and positron emission tomography (PET) with fluorodeoxyglucose are usually used for further characterization, staging, treatment response, and assessment of recurrence. A systematic approach based on age, clinical history, and radiologic findings is required for correct diagnosis. It is essential for radiologists to be familiar with the spectrum of lesions that might affect the posteromedial chest wall and their characteristic imaging features. Although the imaging findings of these tumors can be nonspecific, cross-sectional imaging helps to limit the differential diagnosis and determine the further diagnostic investigation (e.g., image-guided biopsy). Specific imaging findings, e.g., location, mineralization, enhancement pattern, and local invasion, occasionally allow a particular diagnosis.
- chest wall
- posteromedial
- lesion
- imaging
- benign
- malignant
1. Introduction
2. Spondylodiskitis
Spondylodiskitis is an infectious process that initially affects the anterior portion of the vertebral bodies and then spreads to the adjacent intervertebral disk via medullary spaces [9][39]. Staphylococcus aureus is the most common cause of pyogenic spondylodiskitis, which commonly presents as a single-level lumbar involvement of two vertebral bodies and intervertebral disk. Tuberculosis spondylodiskitis, the most common non-pyogenic spine infection, more commonly involves the thoracic spine [9][10][39,40].2.1. Pyogenic Spondylodiskitis
Pyogenic spondylodiskitis presents with loss of vertebral end plate definition and marrow edema. It displays hypointensity on T1-weighted images and hyperintensity on T2-weighted and STIR images. Various types of disk post-contrast enhancement (e.g., homogenous, patchy, and peripheral) may be detected [9][39]. Abscess or phlegmons demonstrate heterogeneous mixed signal intensity on both T1-weighted and T2-weighted images, with probable spinal cord compression. Rim-like or diffuse post-contrast enhancement are usually seen within these soft tissues. Diffusion weighted imaging (DWI) is valuable for differentiating the abscess from other paravertebral lesions (Figure 1) [9][11][39,41].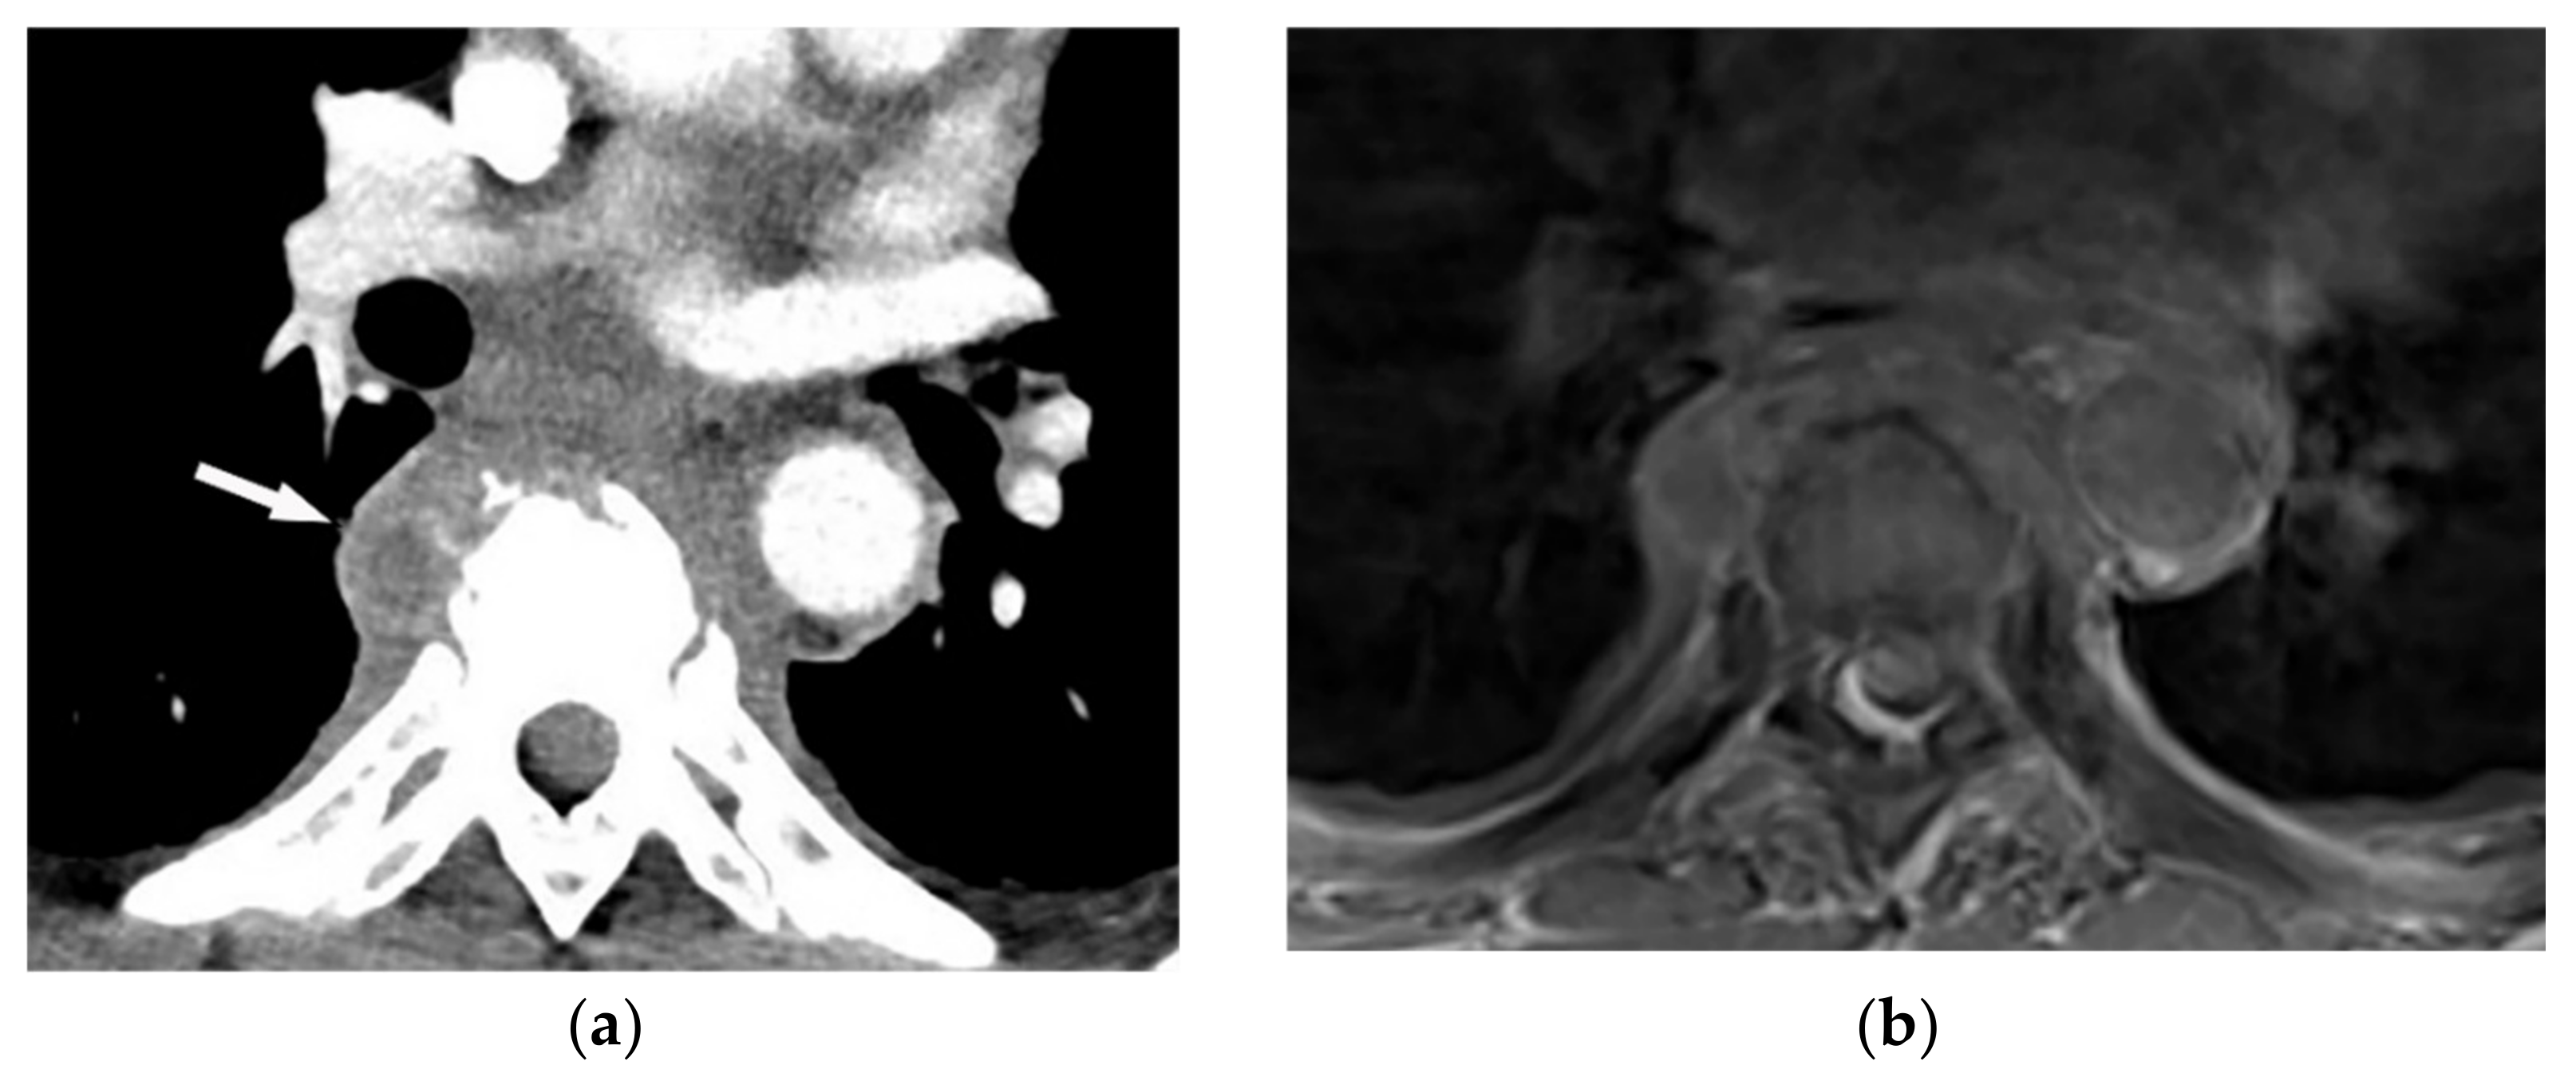
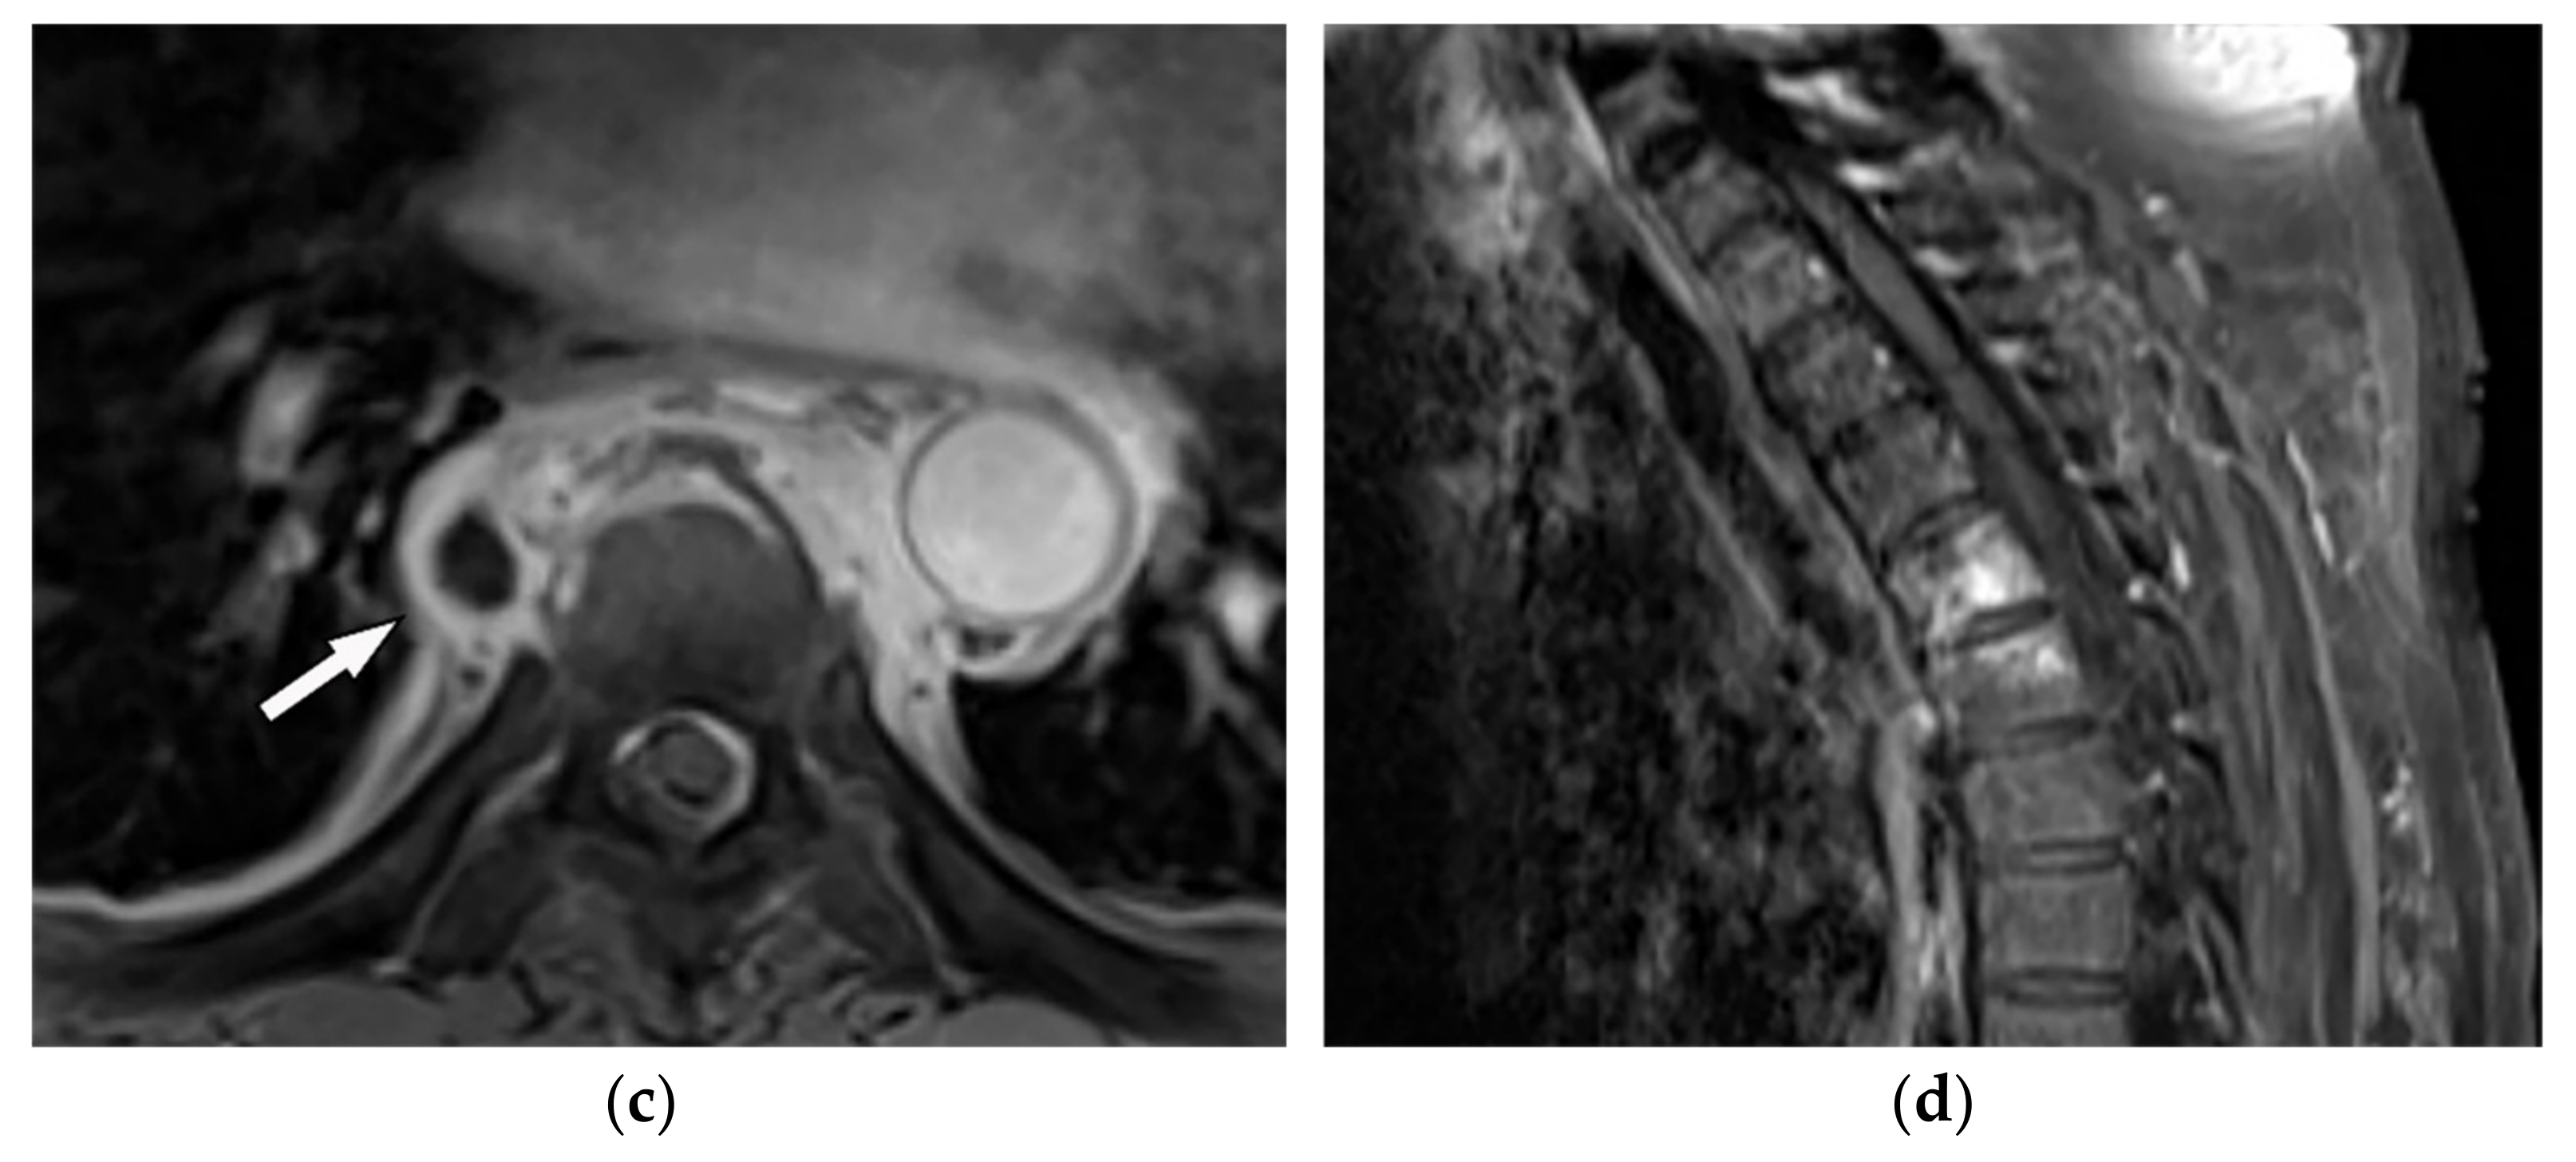 Figure 1. A 71-year-old man with back pain and fever. The contrast-enhanced CT in axial plane (a) demonstrates para-spinal soft tissue mass (arrow) with adjacent vertebral body cortical destruction. Axial pre-contrast (b) and post-contrast T1WFS (c) images at the level of T6-T7 show hypo to isointense paravertebral soft tissue mass with peripheral rim enhancement (arrow) after injection of gadolinium suggestive for paravertebral abscess formation. Sagittal STIR (d) image shows adjacent subchondral bone marrow edema as hypersignal intensity. Posterior elements are spared with normal signal intensity. Aspiration was performed and culture was compatible for brucellosis.
2.2. Tuberculosis Spondylodiskitis
Tuberculosis spondylodiskitis has a more gradual and chronic clinical course, which leads to multi-level involvement and paravertebral cold abscess formation with well-circumscribed thin wall. Subligamentous spread of infection to adjacent vertebral levels, relative preservation of intervertebral disk, and kyphotic angulation (gibbous deformity) are other imaging findings. CT scan is more sensitive in delineating calcification within paravertebral cold abscess, end plate erosion, and bony fragment visualization (Figure 2) [9][12][39,42].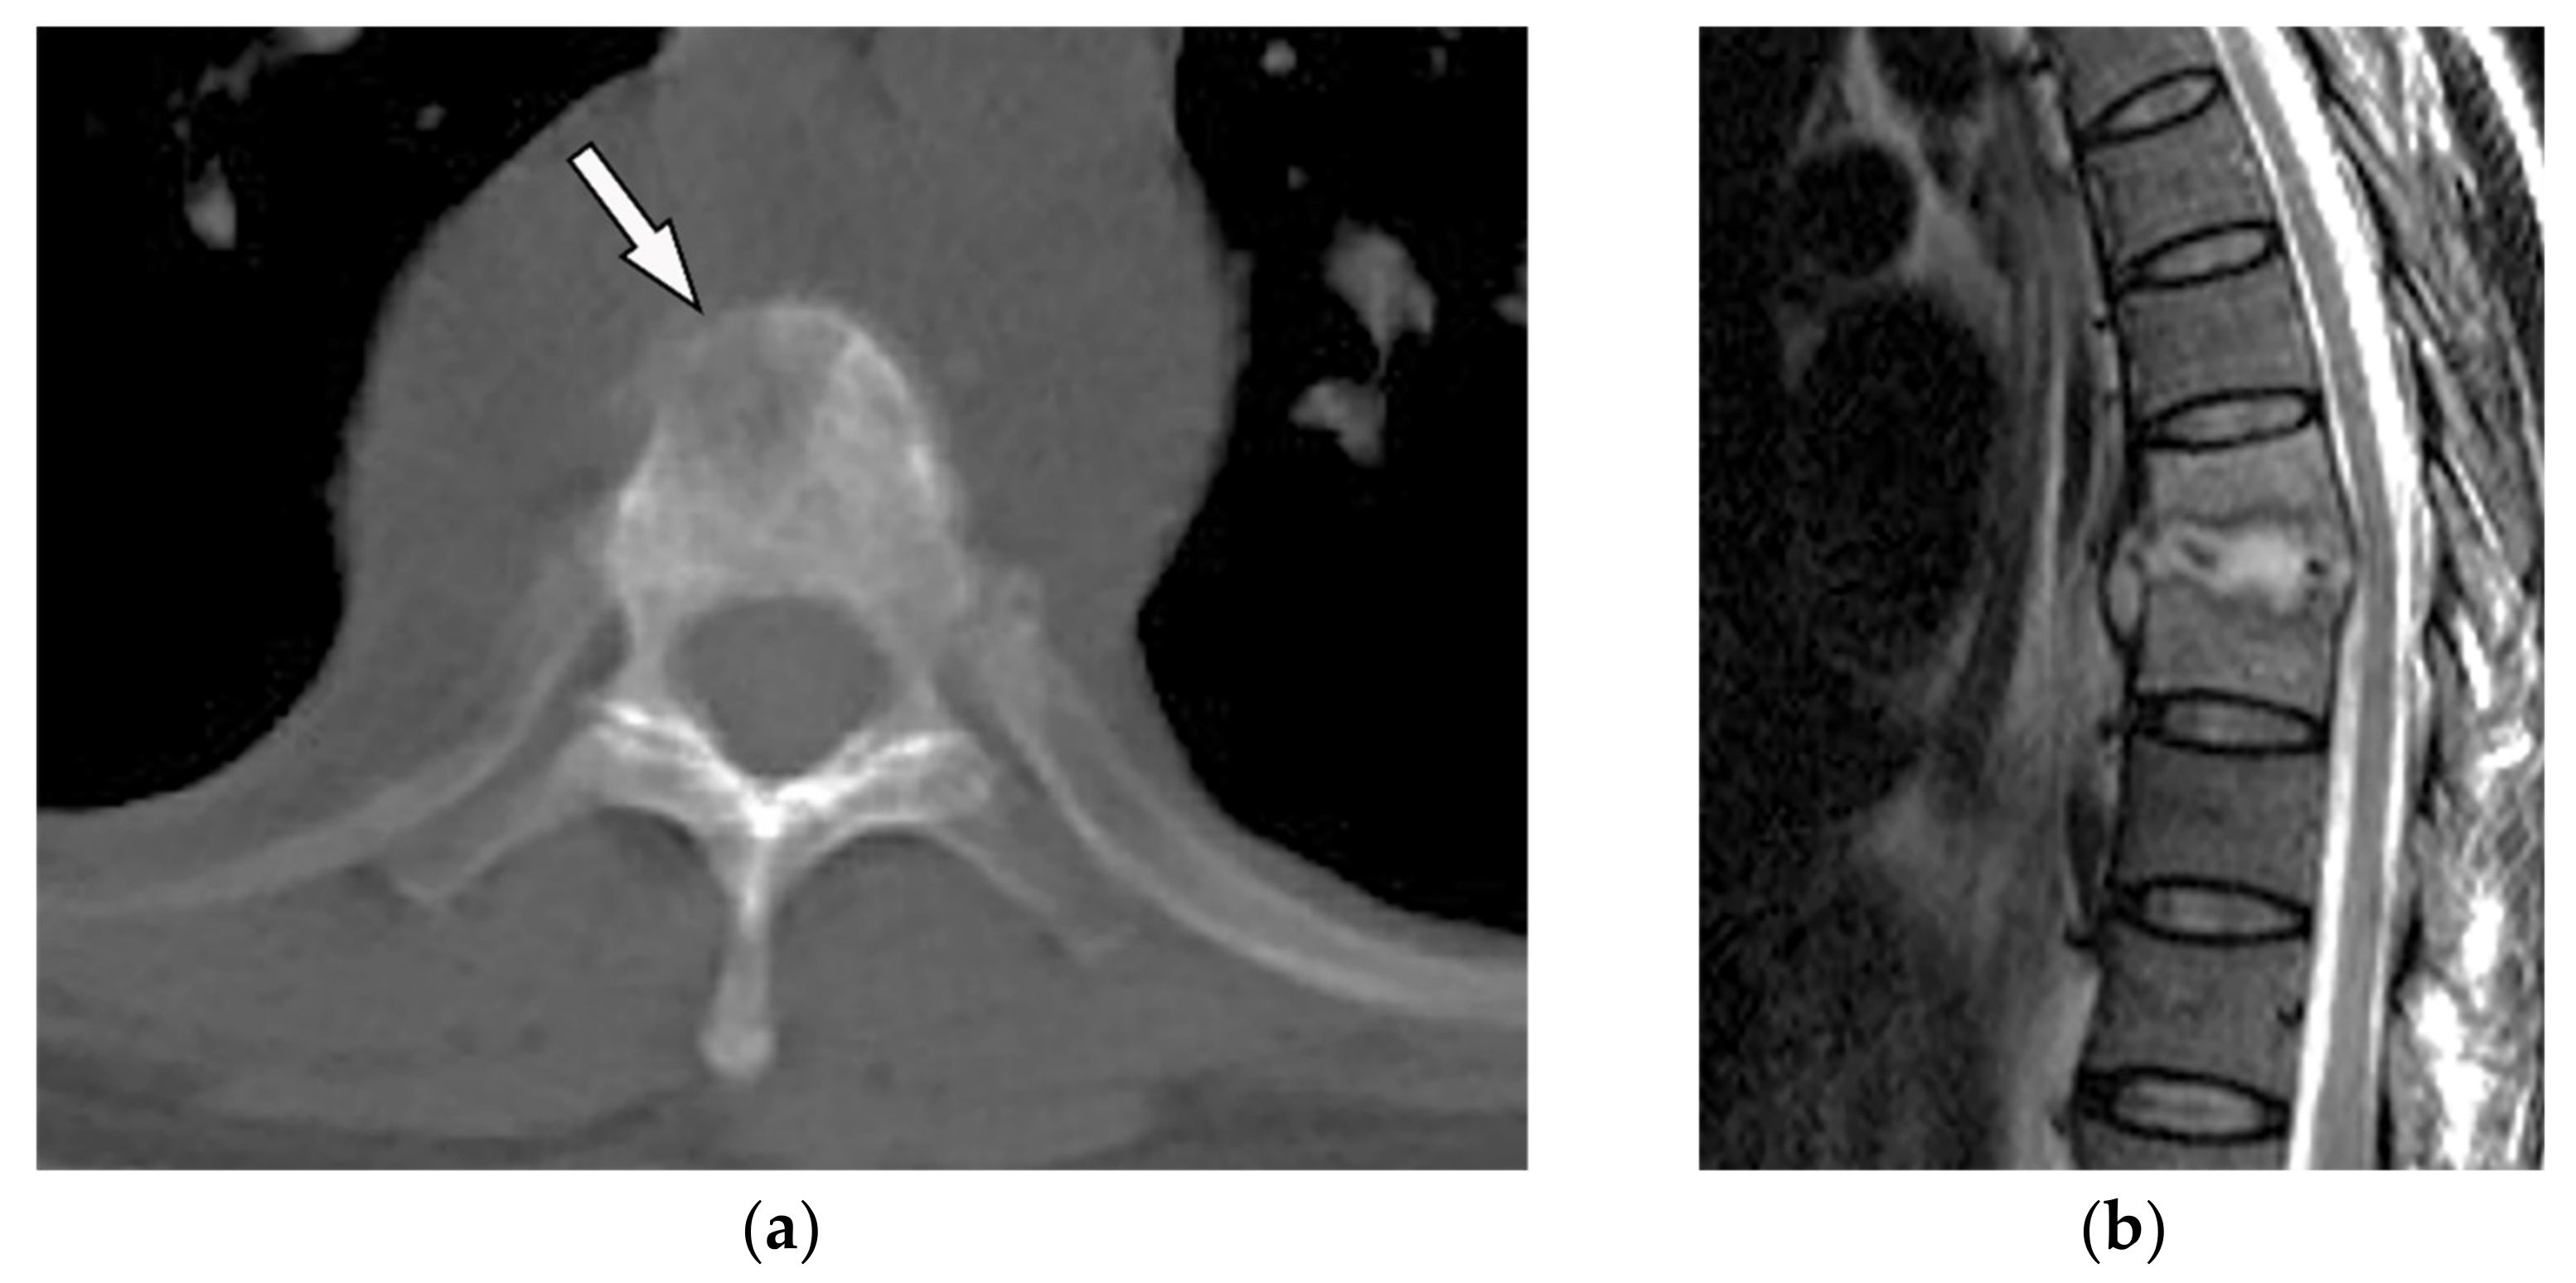
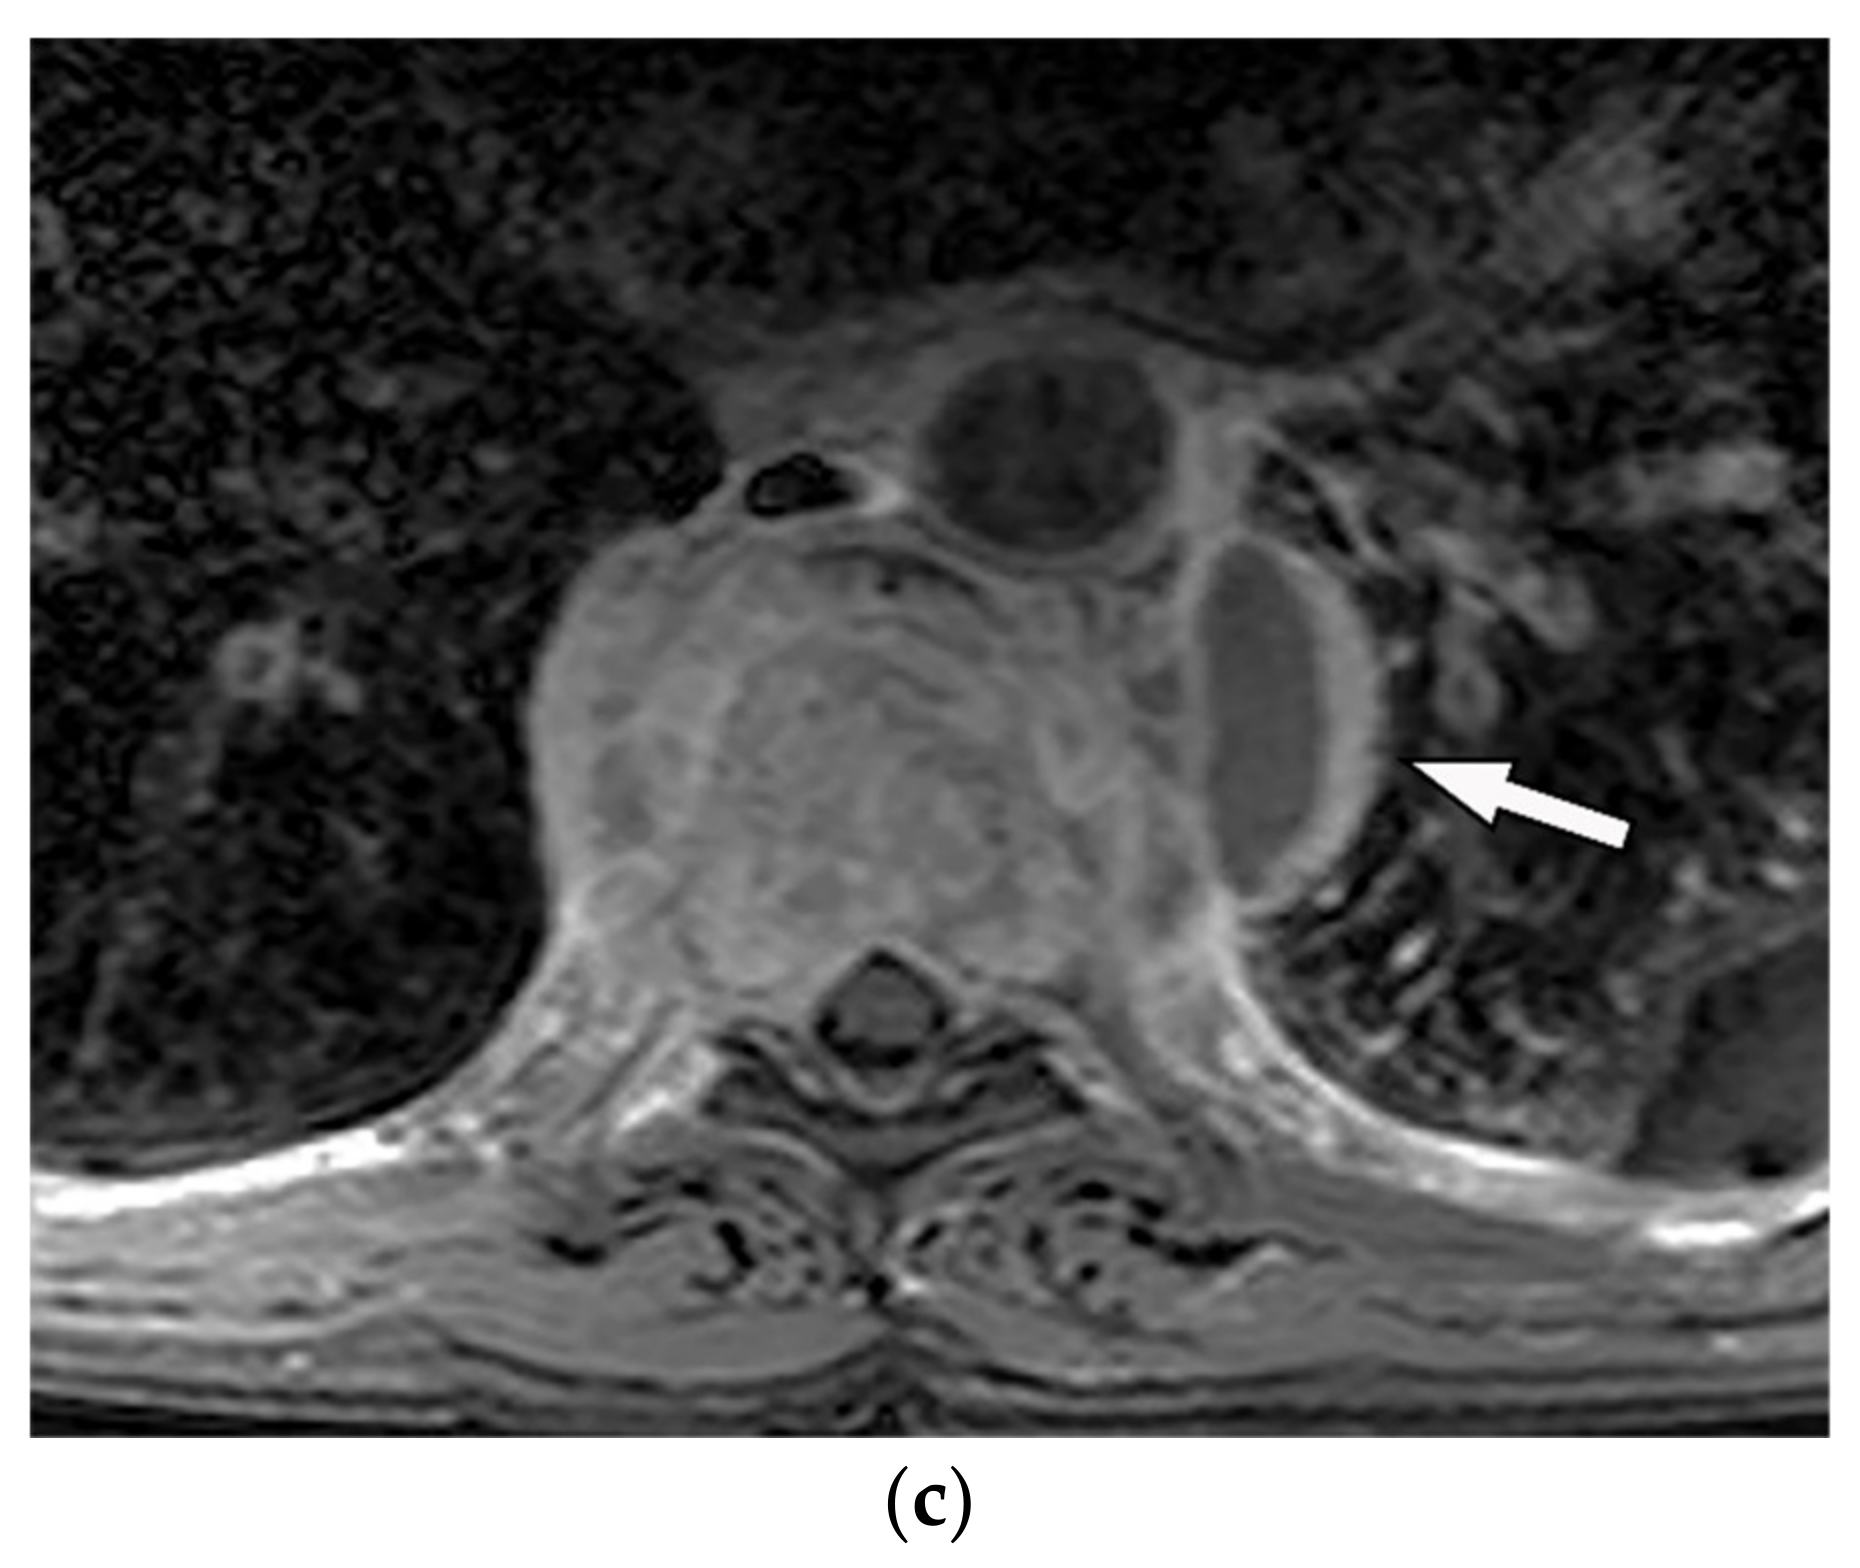 Figure 2. A 65-year-old man with fever, weight loss, and night sweeting. The non-contrast-enhanced CT (bone window) in axial plane (a) shows paraspinal soft tissue mass with erosion of right lateral aspect of adjacent vertebral body. Sagittal T2W image of another patient with the same pathology (b) shows hypersignal intensity within T8-T9 vertebral bodies with also intervertebral disc destruction and narrowing of spinal canal pushing the spinal cord posteriorly. Axial T1WFS + C (c) identified the enhancing paraspinal mass with peripheral rim enhancement (arrow) in its left posteromedial side, which is suggestive of abscess formation. Culture of aspirated pus under guide of CT was compatible with tuberculosis infection.
3. Soft-Tissue Tumors and Tumor-Like Lesions
3.1. Primary Neurogenic Lesions
Neurogenic tumors of the chest wall can arise from the intercostal nerve, spinal nerve roots, and even from the distal branch of the brachial plexus. They consist of benign and malignant groups, including Neurofibroma, Schwannoma, and malignant peripheral nerve sheet tumors (Table 1).| Tumor Type | Imaging Findings | |
|---|---|---|
| CT | MRI | |
| Primary Neurogenic Tumors | |||
| Schwannoma | Well-defined mass with homogenous attenuation, “fat-split” sign, internal calcification in long-standing schwannomas, postcontrast enhancement except for areas of necrosis. | T1W: iso or slightly hyperintense; T2W: significantly hyperintense | |
| Neurofibroma | Well-circumscribed mass with smooth margin and soft tissue attenuation, possible internal calcifications, rib erosion, neural foramina widening because of tumor extension along with the spinal nerve roots. | T2W, T1WFS + C: so-called “target sign” appearance: hyperintense rim and hypointense center | |
| Neuroblastoma [7][13][14] | Neuroblastoma [7,16,43] | Ill-defined paravertebral soft tissue mass with heterogeneous attenuation with internal calcification in at least 30% of cases (spotty calcification). | T1W: hyposignal T2W: hyperintense T1WFS + C: heterogeneous enhancement Calcification has a signal void in all sequences |
| Ganglioneuroma [7][13][14] | Ganglioneuroma [7,16,43] | Homogenous or heterogeneous attenuation with internal calcification in 25% of cases. | T1W, T2W: intermediate signal with the curvilinear or nodular low signal band making the whorled appearance |
| Lipomatosis Tumors | |||
| Lipoma | Homogenous similar attenuation to macroscopic fat with approximate HU: −100. | T1W, T2W: signal intensity identical to subcutaneous fat T1WFS + C: no enhancement (mild enhancement can be visible for septa < 2 mm thickness) |
|
| Liposarcoma | A heterogeneous mass mixture of fat and soft tissue: higher attenuation than normal fat (hypercellularity), necrosis, and calcification in myxoid subtype. Attenuation similar to fat in well-differentiated subtype. Thick septa, enhancing solid component. |
T1W: variable hyperintense (myxoid liposarcoma), hypointense (well-differentiated), and intermixed hyper and hypointense (dedifferentiated subtype) T2W: hyperintense (myxoid liposarcoma and dedifferentiated subtype) T1WFS + C: variable enhancement |
|
| Others | |||
| Rhabdomyosarcoma | Invasive, destructive homogenous mass with no mineralization and rapid growth with adjacent soft tissue and bone invasion. | T1W: isointense T2W: hyperintense with hypointense areas reflecting area of necrosis (alveolar and pleomorphic subtypes) T1WFS + C: homogenous or ring-like enhancement |
|
| Mesothelioma | Circumferential pleural thickening, bony or cartilaginous differentiation, unilateral pleural effusion, interlobular septal thickening, tumoral extension, thoracic and extrathoracic metastasis. | T1W: unilateral hyperintense pleural effusion, iso to slightly hyperintense pleural thickening T2W: moderately hyperintense T1WFS + C: typical enhancement is expected |
|
| Extramedullary Plasmacytoma | Soft tissue masses with nonspecific imaging manifestations. Larger lesions show aggressive behavior such as infiltration, destruction, and encasement. |
T1W: isointense T2W: iso to hyperintense T1WFS + C: variable enhancement (from mild to marked enhancement) |
|
3.1.1. Schwannoma
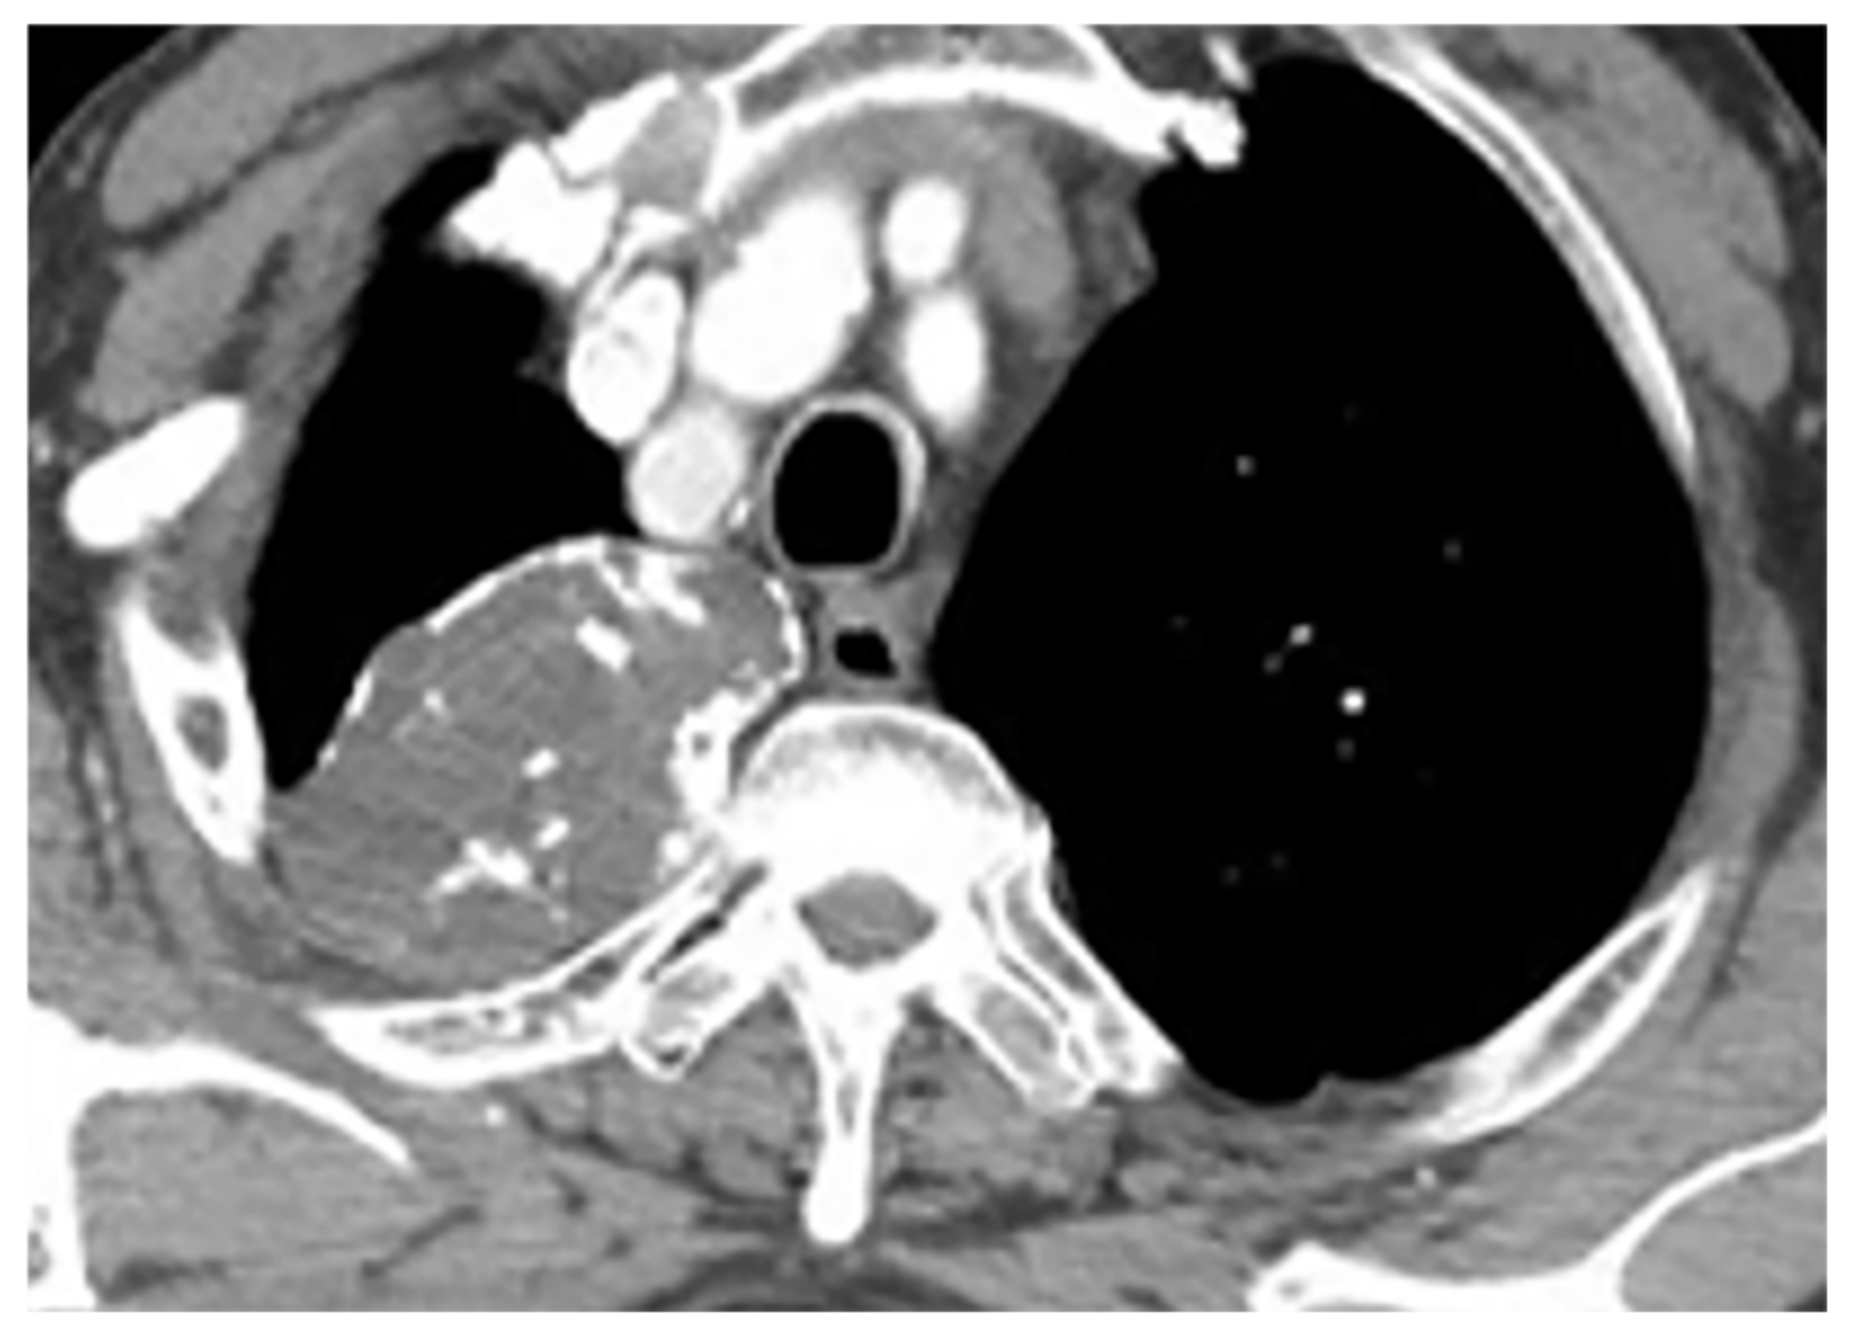 Figure 3. A 39-year-old woman with right vague chest pain. The contrast-enhanced axial CT demonstrates right-sided well-defined posterior mediastinal paraspinal mass with foci of calcifications within it. The round configuration is typical for peripheral nerve tumors. The attenuation is equal to chest wall muscles. Histopathological examination confirms Schwannoma.
3.1.2. Neurofibroma
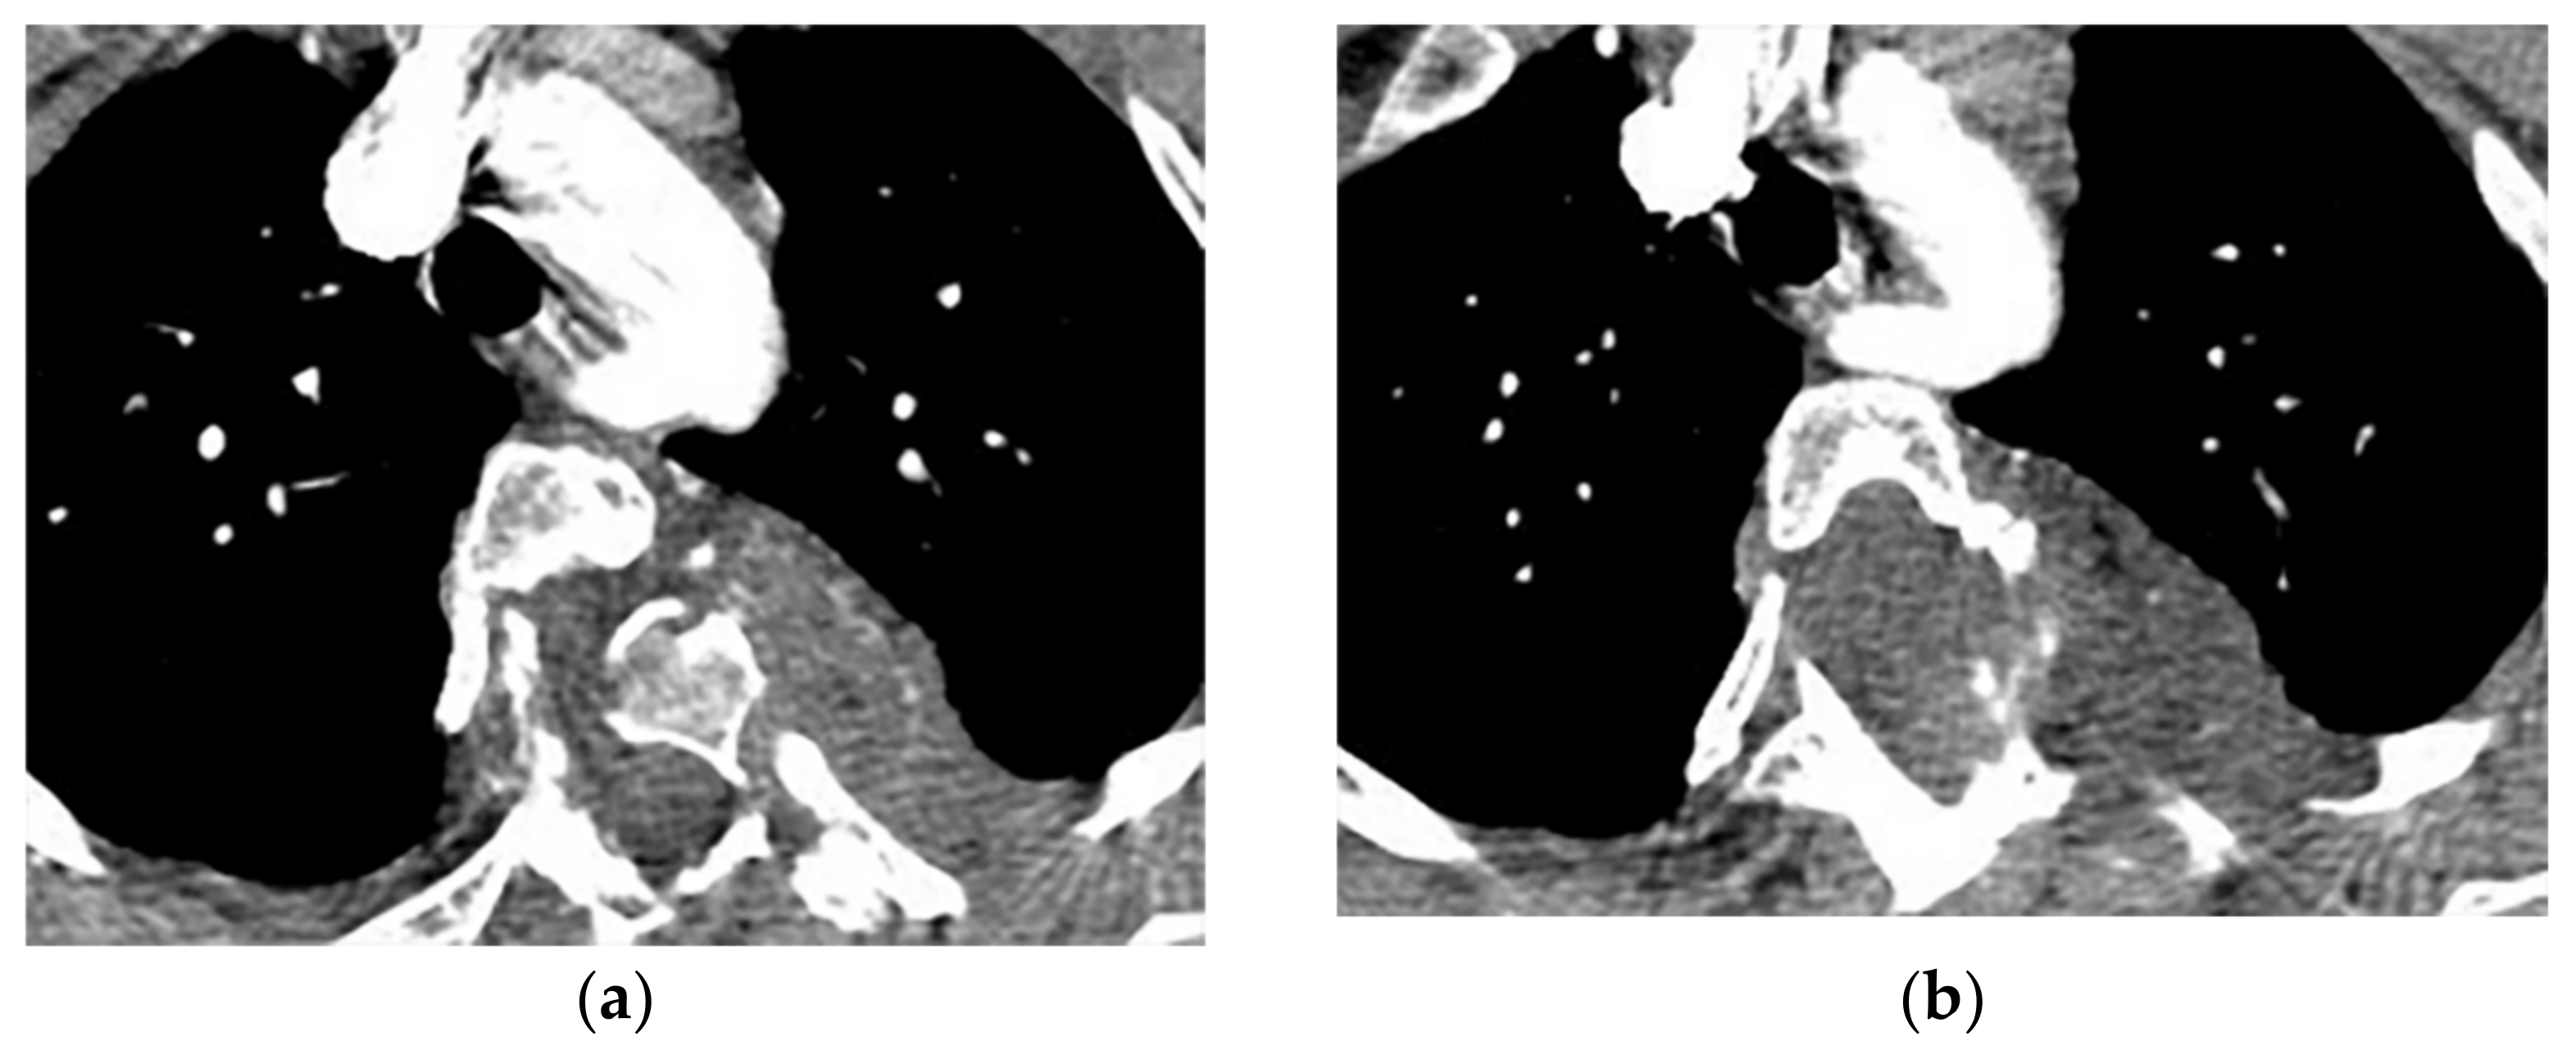
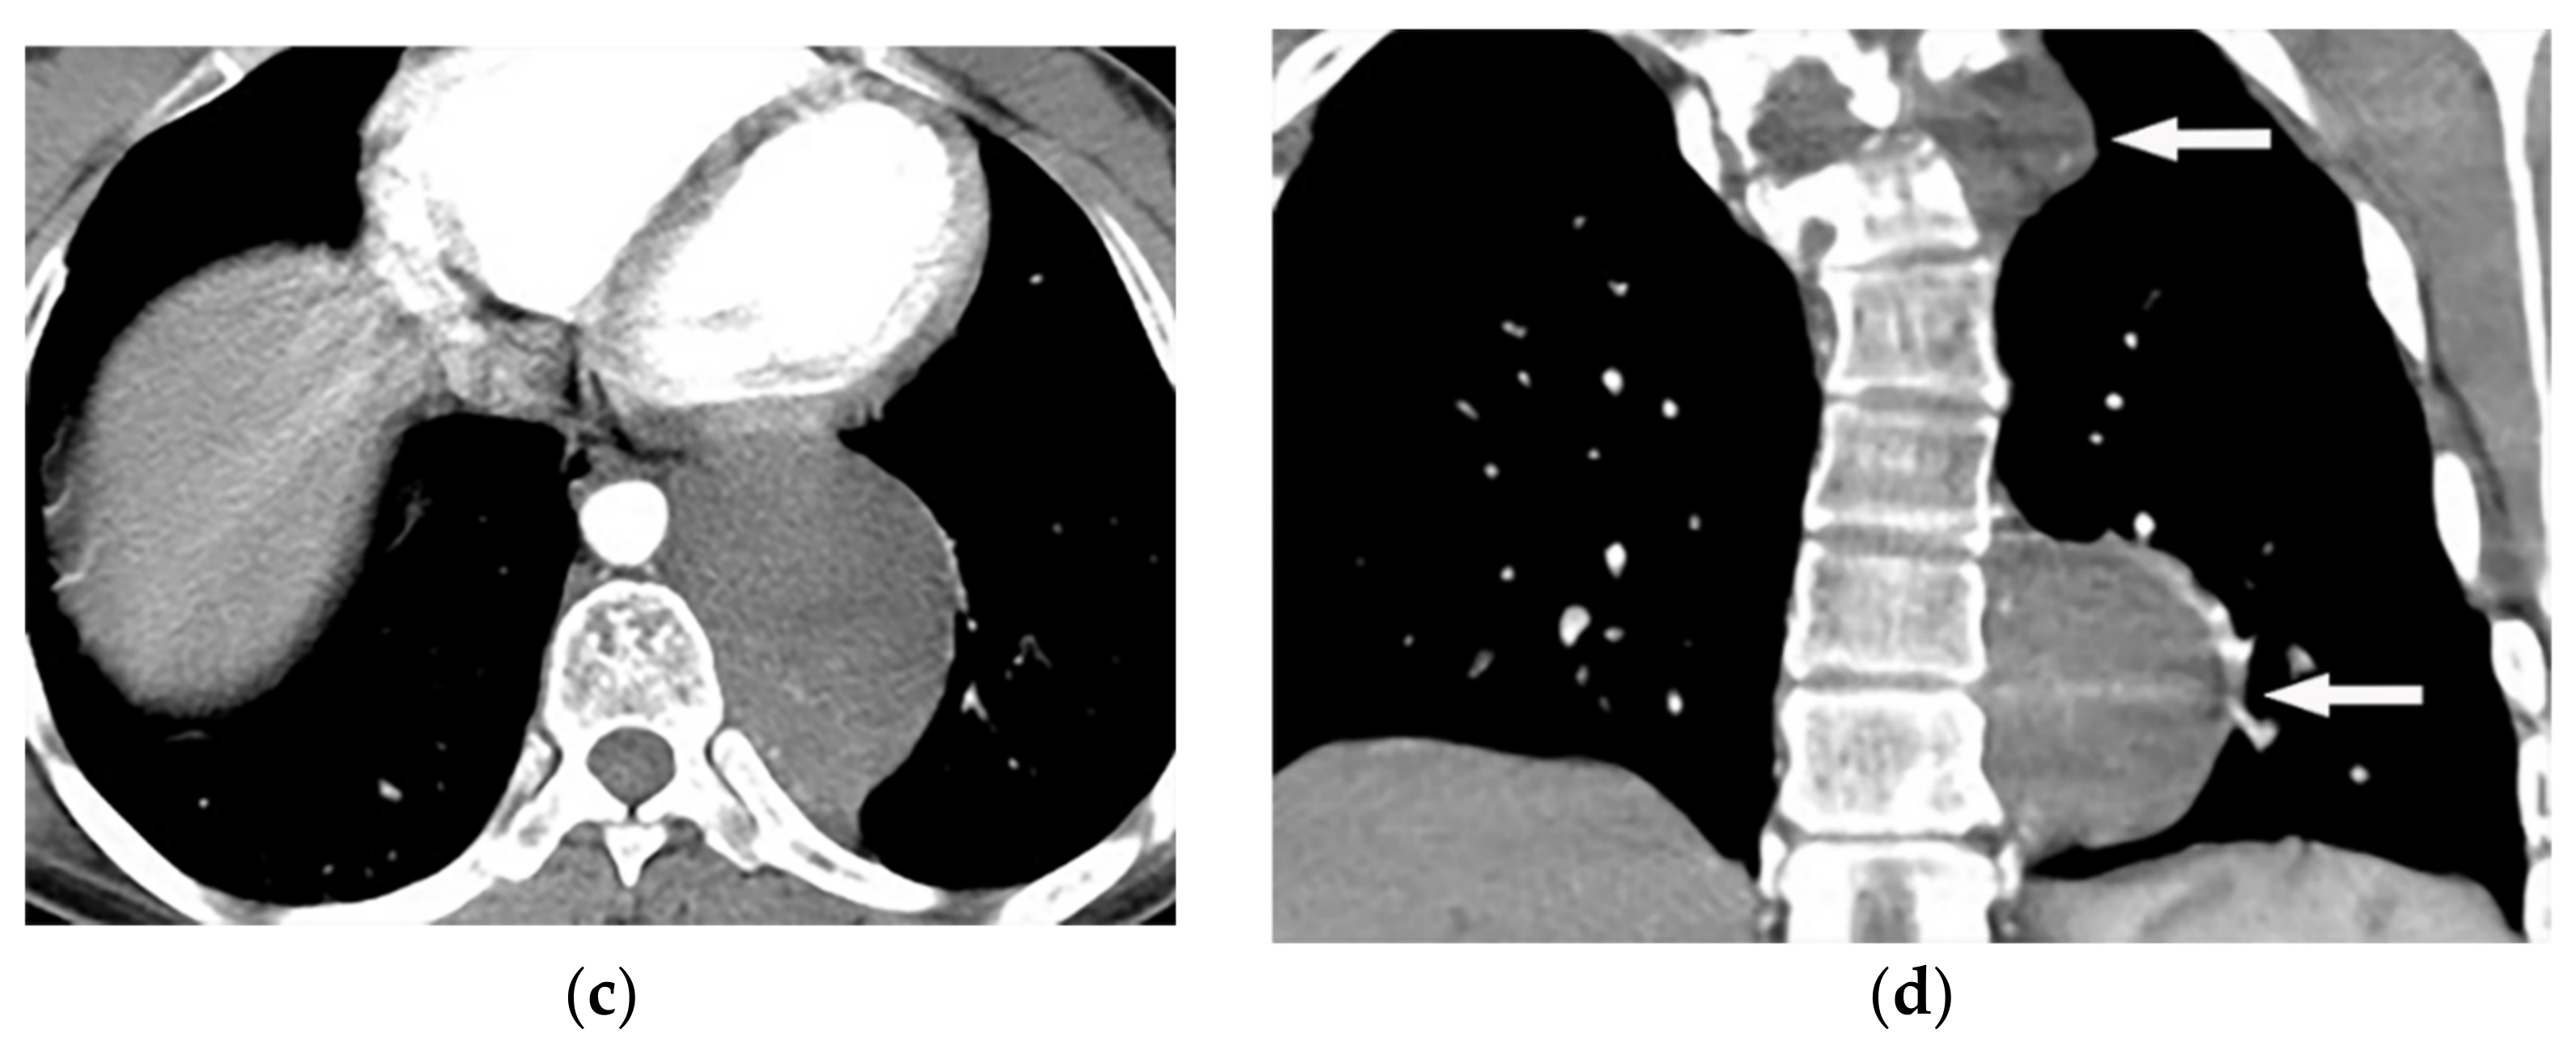 Figure 4. A 27-year-old male with scoliosis. Contrast-enhanced CT in the axial plane (soft tissue window) shows vertebral anomaly and dural ectasia. Left-sided well-defined lobular mass with the widening of adjacent neural foramen with intra- and extraspinal extension are offered (a–c), coronal CT (d) shows scoliosis in upper thoracic vertebrae, associated with two well-defined homogenous masses (arrow) with similar appearance in upper and lower posterior mediastinum.
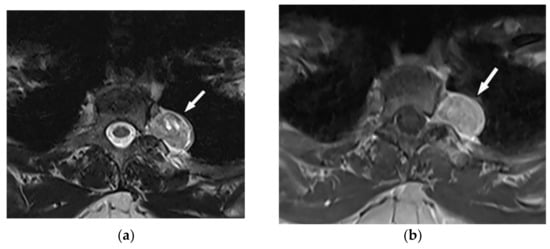
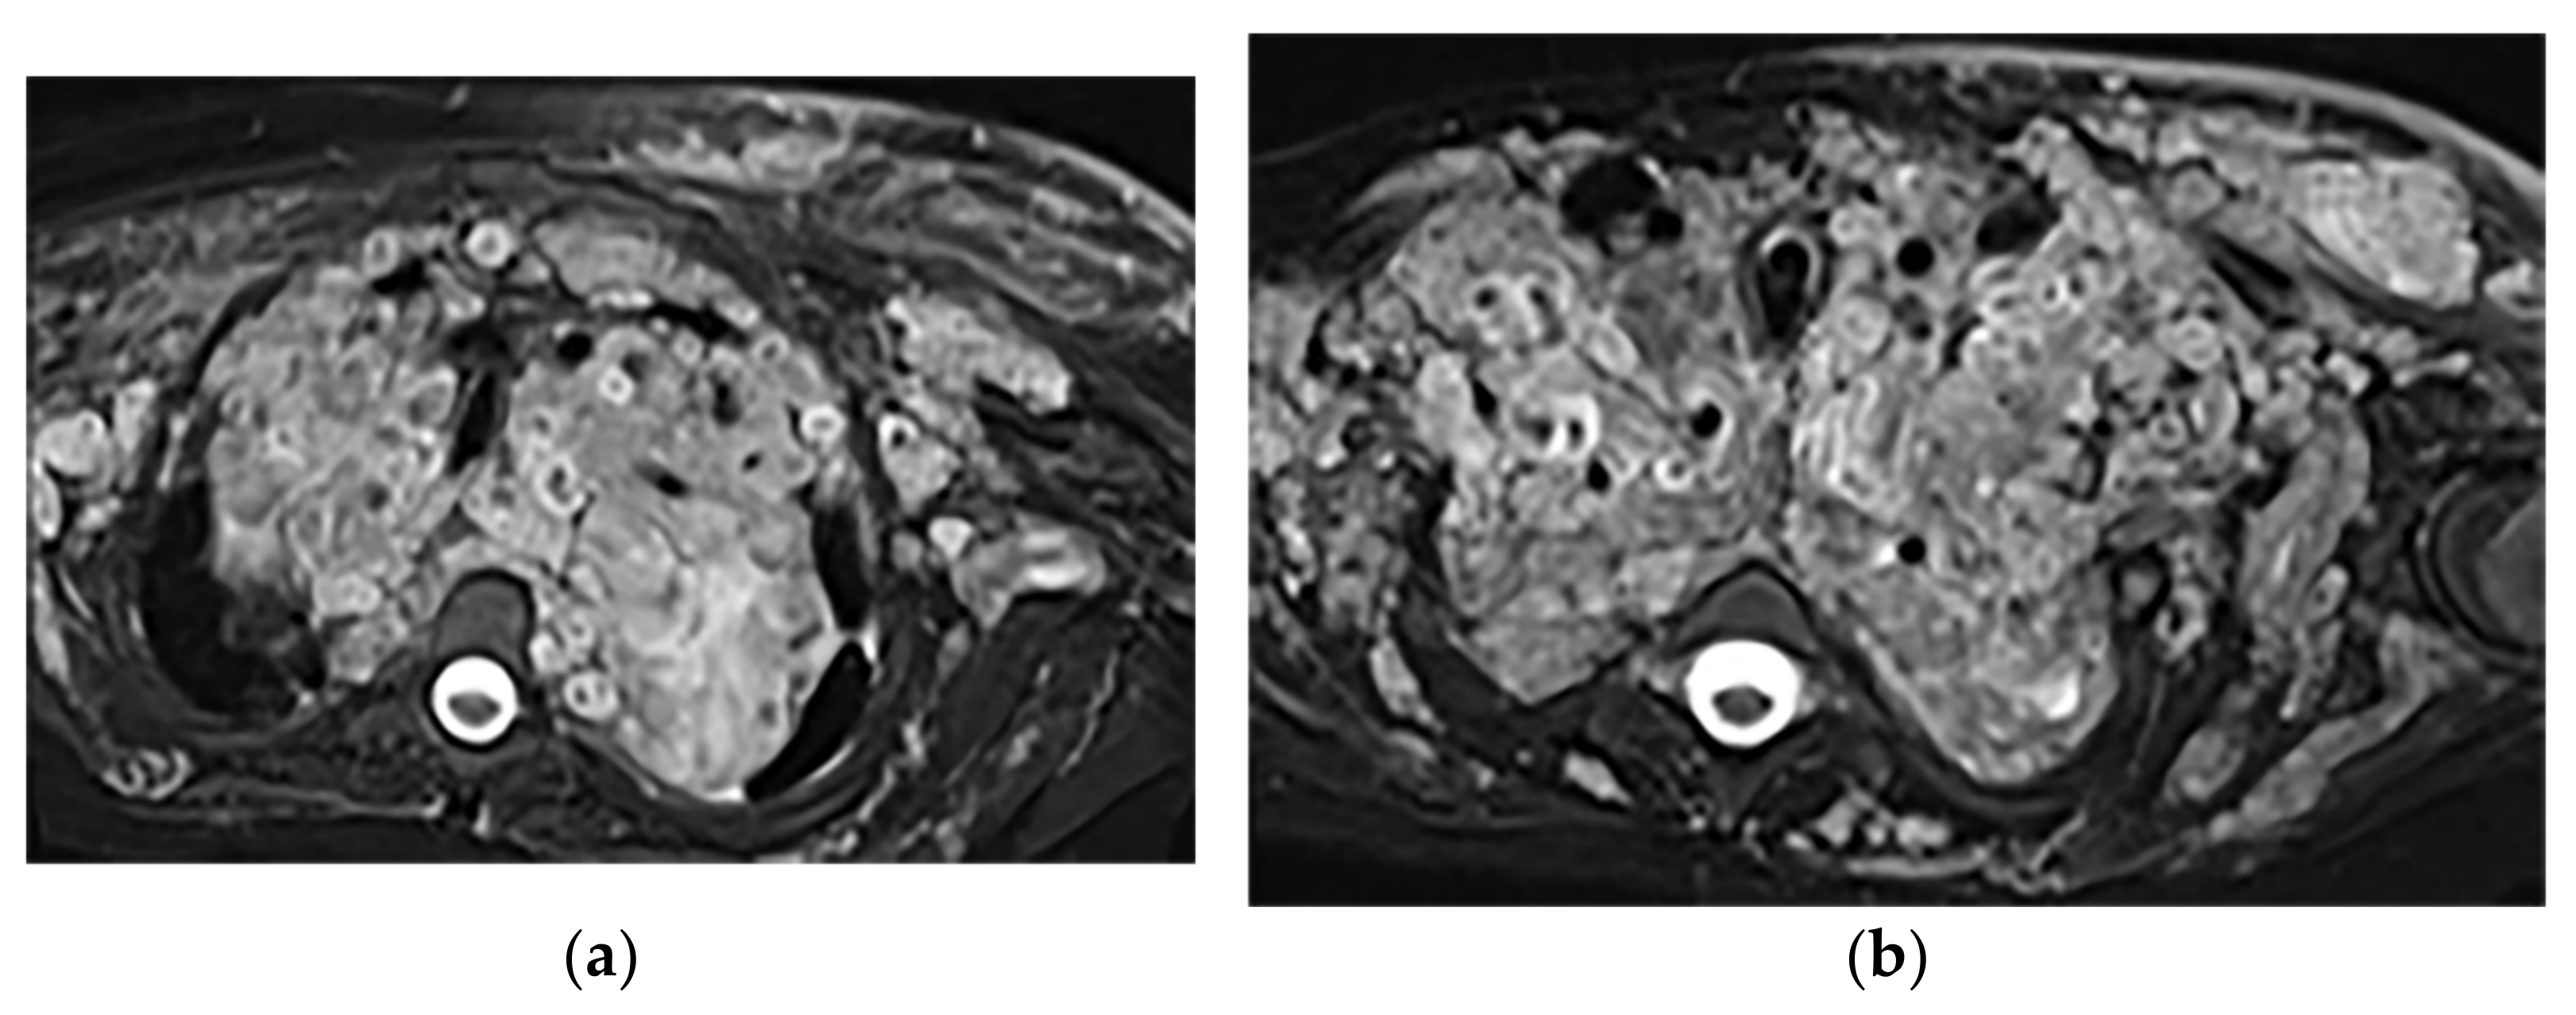
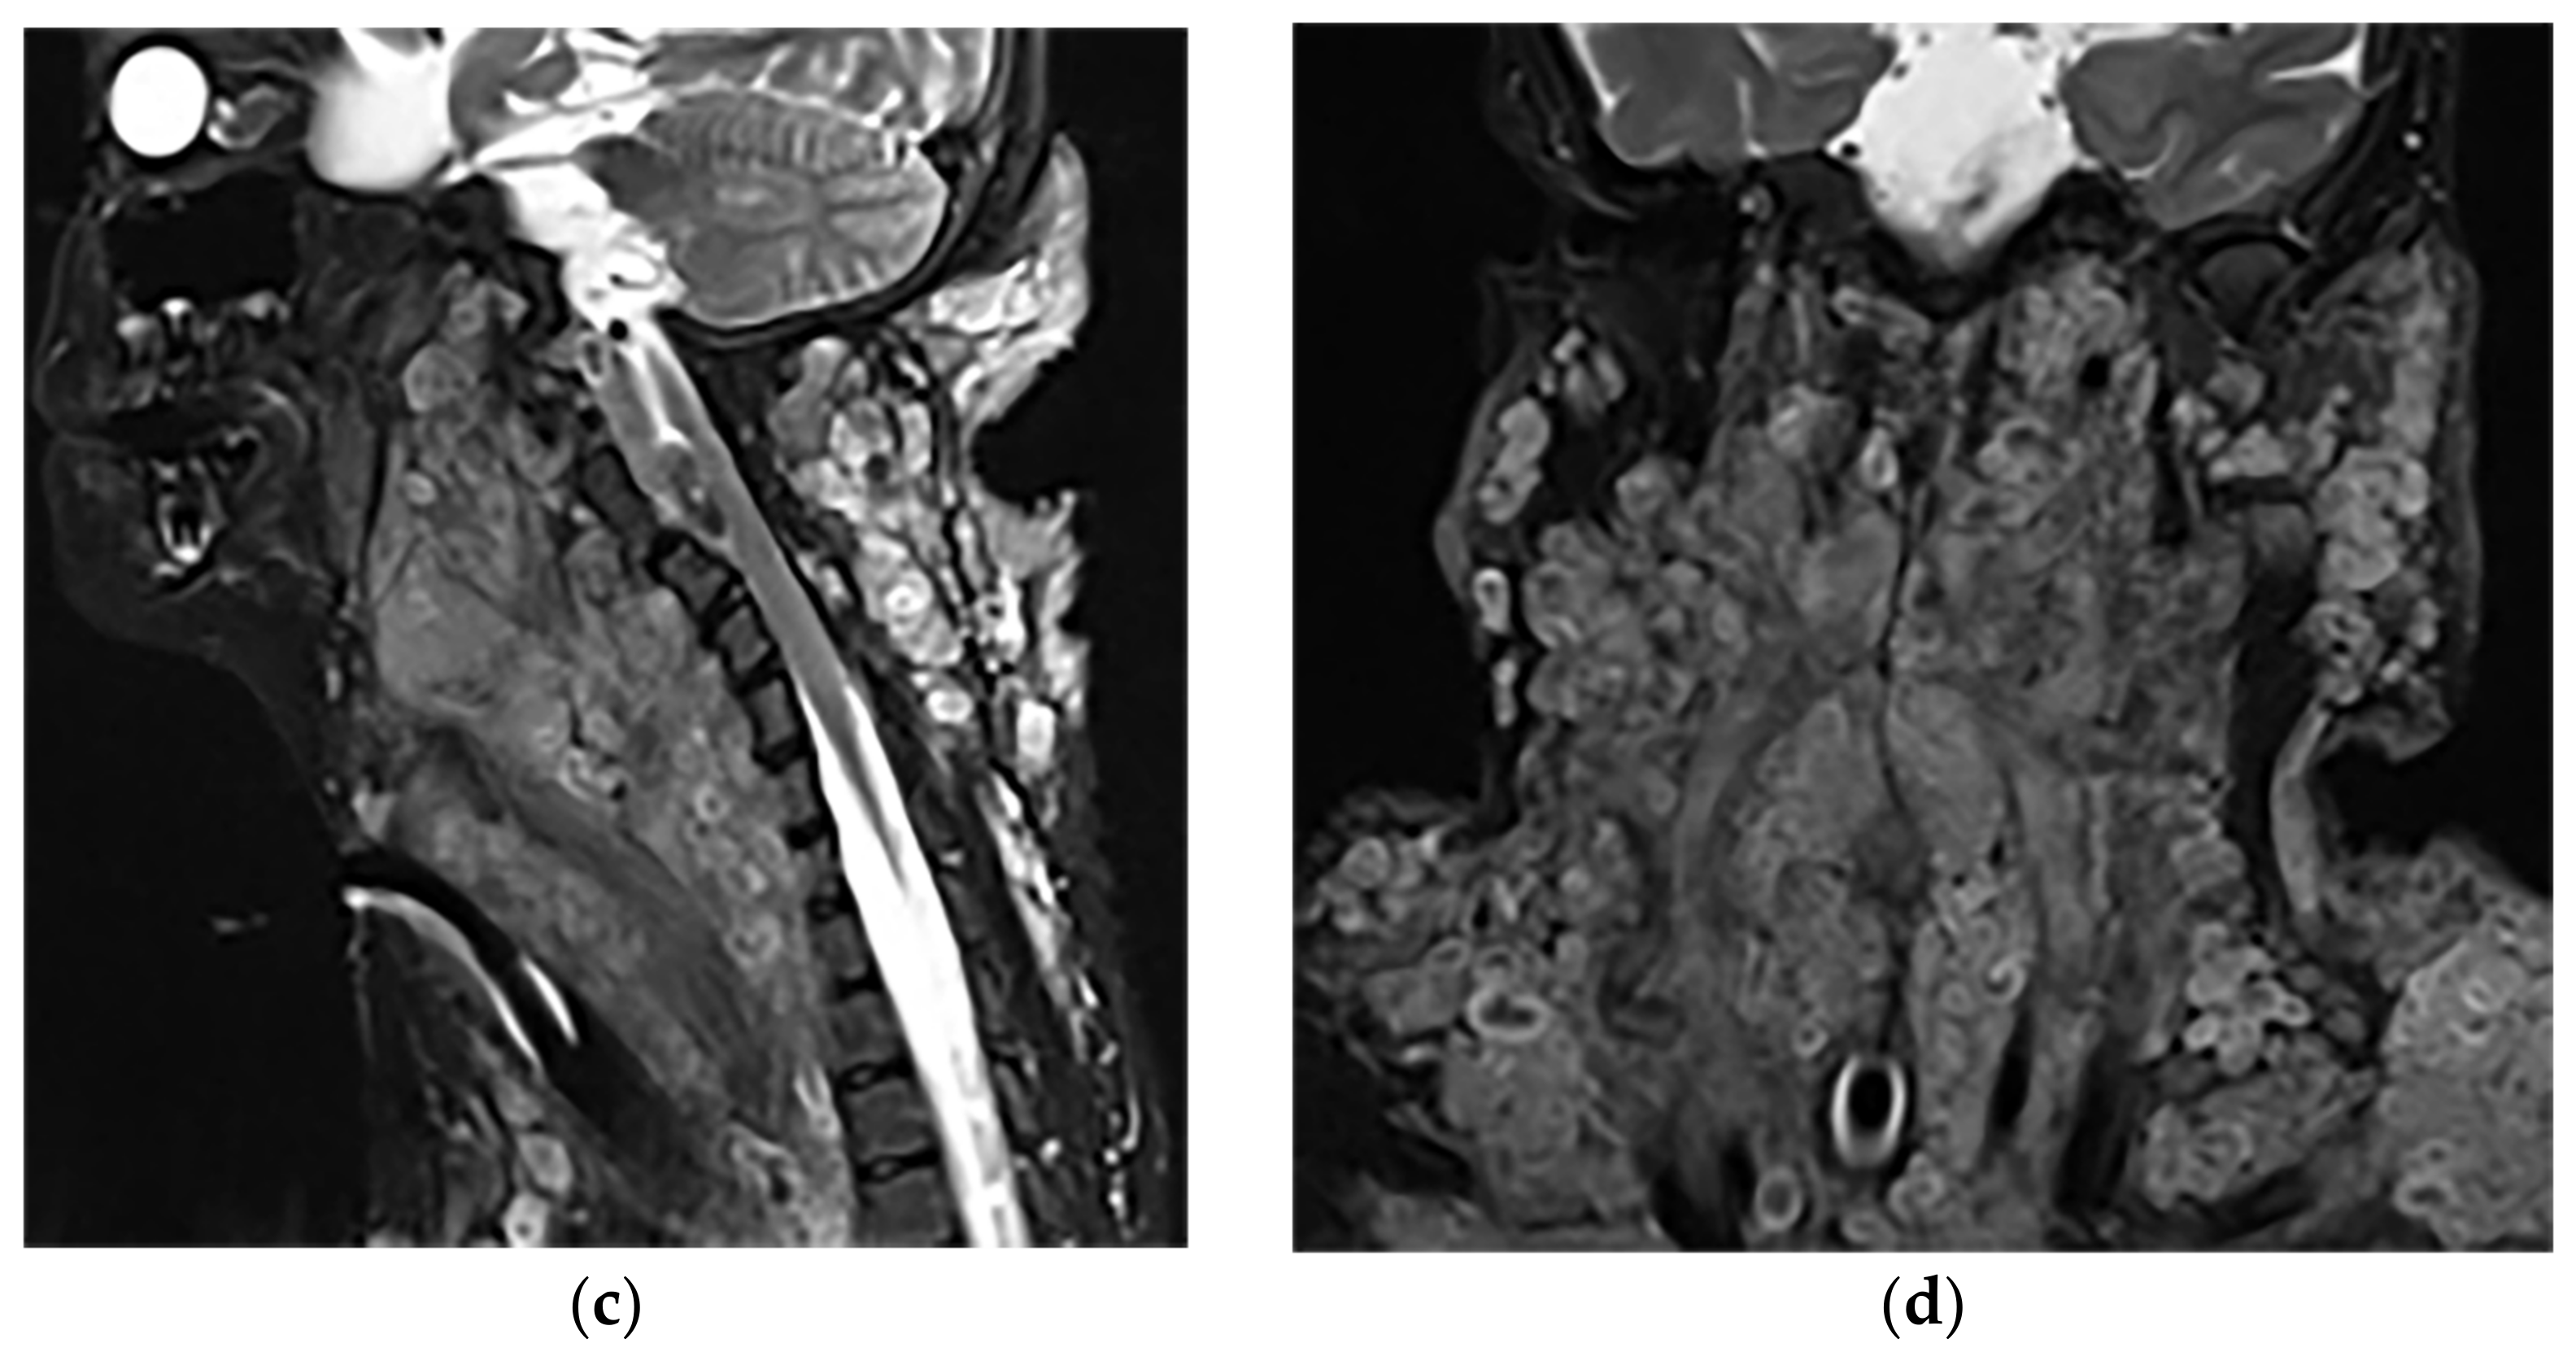 Figure 6. A 34-year-old man, with a case of neurofibromatosis type 1. The axial T2W images (a,b) show multiple confluent infiltrative paraspinal masses within the neck and upper thorax along the course of sympathetic chain and nerves with high signal intensity and central focus of hypointensity (target sign) surrounding the mediastinal vessels that are typical for plexiform Neurofibroma. Sagittal T2W (c) and coronal (d) images show the extensive infiltrative nature of this lesion with multi-compartment involvement and extension to pharyngeal space and pressure effect over cervical and thoracic vertebrae.
3.1.3. Neuroblastoma
Thoracic Neuroblastoma is a non-encapsulated tumor that arises from extra-adrenal sympathetic ganglia. The mediastinum is the second most common tumor location after the abdomen that has a better prognosis than other sites. Neuroblastoma appears as an ill-defined paravertebral soft tissue mass on a CT scan with heterogeneous attenuation caused by hemorrhage, necrosis, or cystic degeneration. Internal calcification is seen at least in 30% of cases [7][13][7,16]. MRI shows irregular margin with possible local invasion to the spinal canal, presenting T1-hypointensity and T2-hyperintensity with heterogeneous enhancement. Calcification has a signal void in all sequences (Figure 7 and Figure 8). It is reported that tumors with higher metabolic activity on 18F-FDG PET/CT have lower overall survival [15][16][44,45]. Metaiodobenzylguanidine labeled as 123I (MIBG) is highly sensitive for detecting catecholamine-producing tumors like neuroblastoma [7][13][7,16].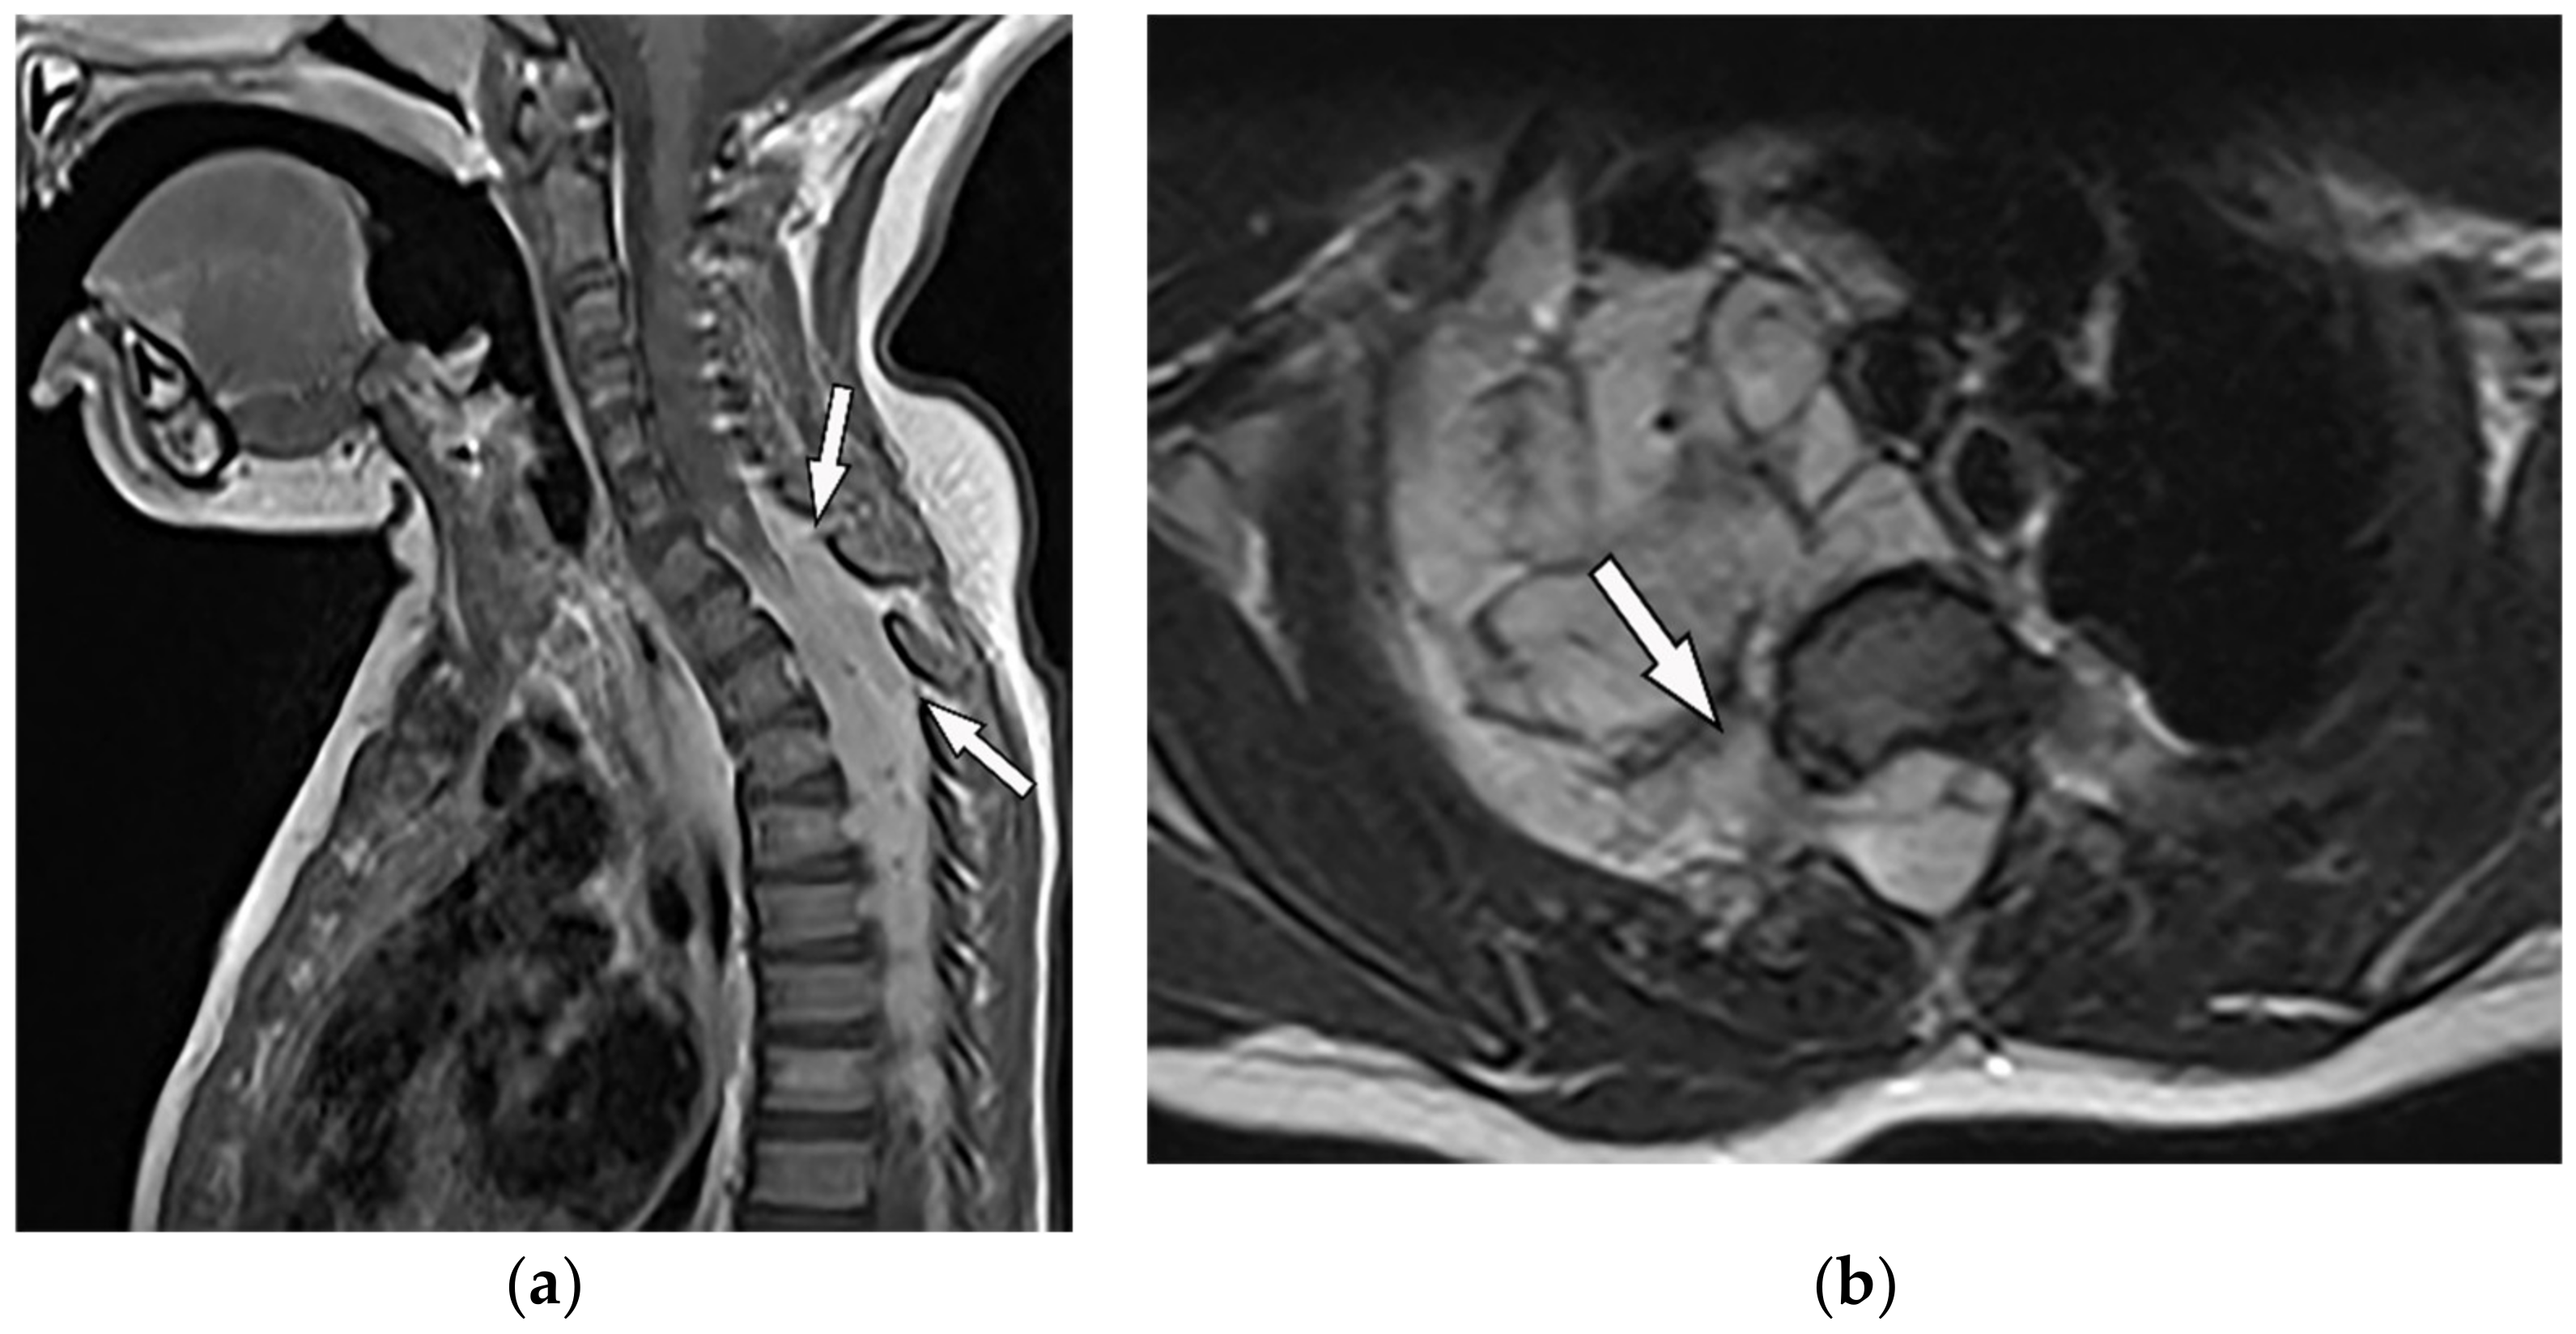 Figure 7. A 6-year-old boy with posterior mediastinal mass with histopathological confirmation for Neuroblastoma. Axial (a) T2W shows an ill-defined lobulated group (arrow) with heterogeneous and hyper-intense signal intensity and area of a signal void within the posterior mediastinum. It has intracanal extension via right-sided neural foramina and extradural components at multiple levels. It displaced the spinal cord anteriorly, as shown in sagittal T1W after gadolinium administration (arrow) (b).
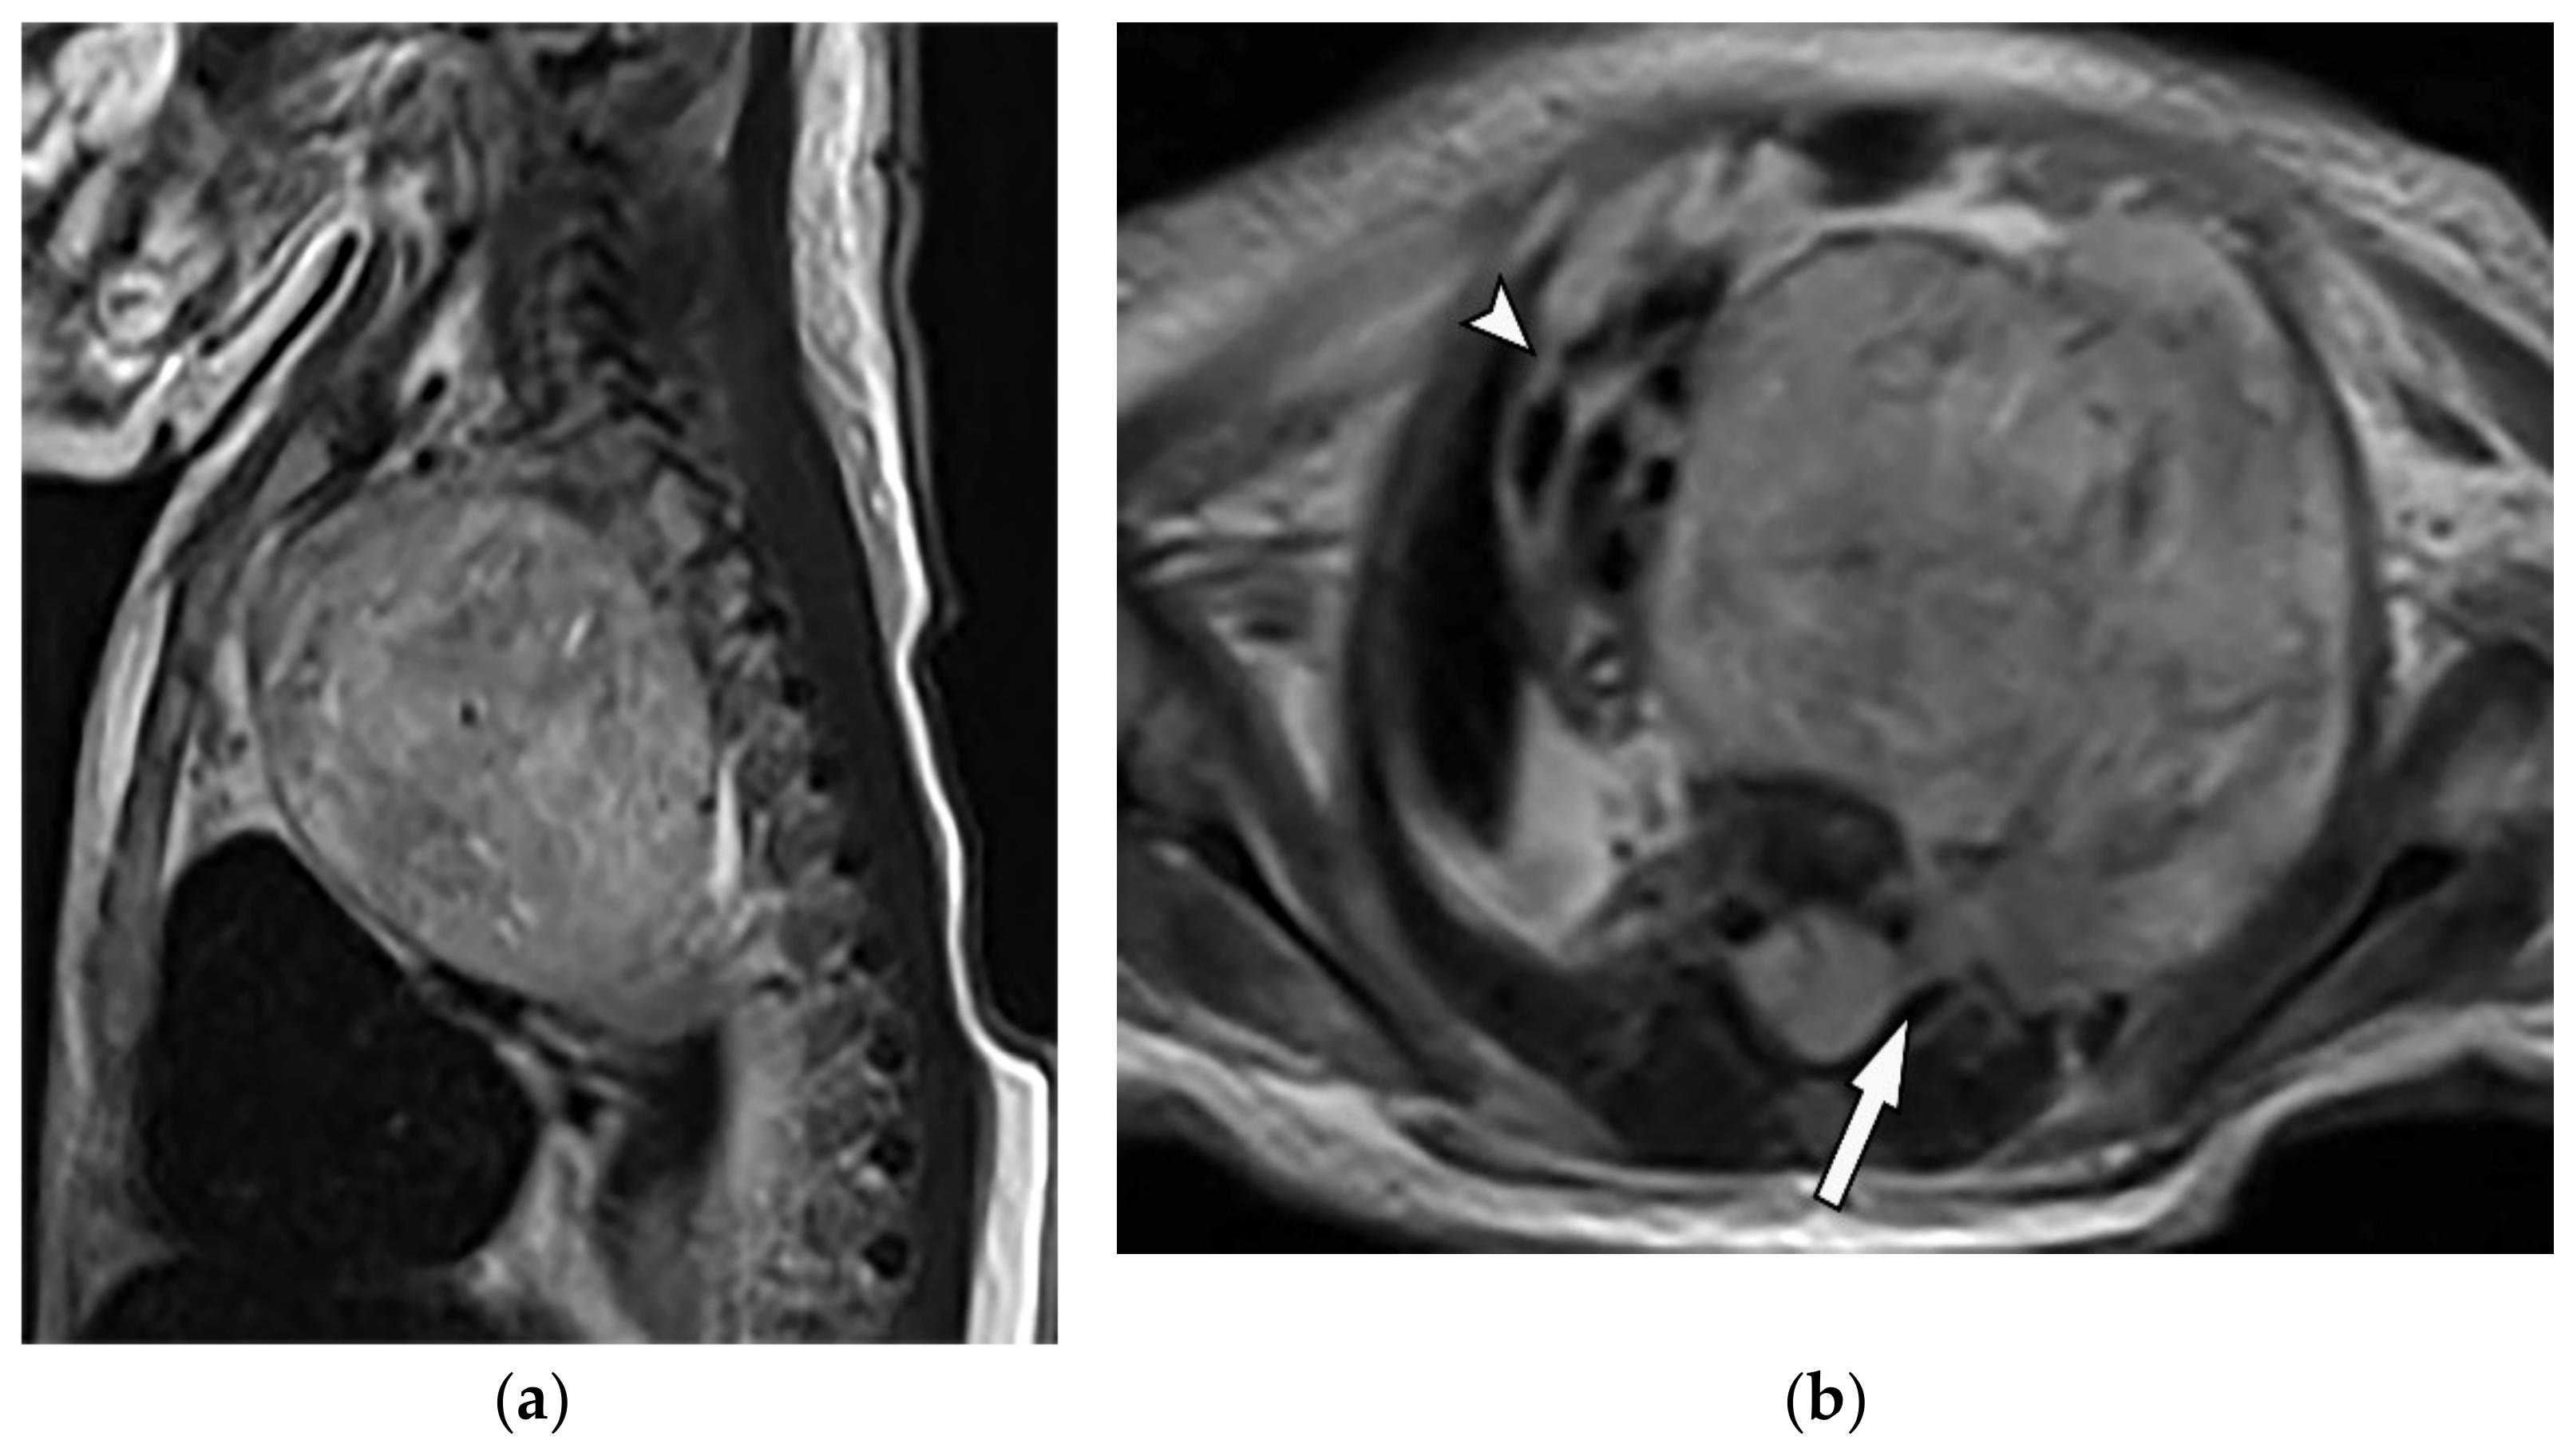 Figure 8. A 4-year-old girl with the opsomyoclonus-myoclonus syndrome. Sagittal (a) and axial (b) T2W images show large lobulated paraspinal masses (arrowhead) crossing the midline within the posterior superior mediastinum. It shows heterogeneous and hyperintense signal intensity with internal foci of the signal void caused by calcification. It extends through the spinal canal via neural foramina (arrow). Right anterolateral displacement of mediastinal great vessels is also identified.
3.1.4. Ganglioneuroma
Ganglioneuromas are differentiated slow-growing neurogenic tumors originating from sympathetic ganglia that affect young patients. They appear as a paravertebral oval mass with a smooth border and vertical orientation following the sympathetic chain direction. Posterior mediastinum is the most common site of involvement of thoracic ganglioneuroma. It has homogenous or heterogeneous attenuation on CT images with probable internal calcification (speckled, fine, or coarse). MR imaging displays lesions with intermediate signal intensity on both T1-weighted and T2-weighted images with curvilinear or nodular low signal bands, which form the whorled appearance (Figure 9) [7][13][14][7,16,43].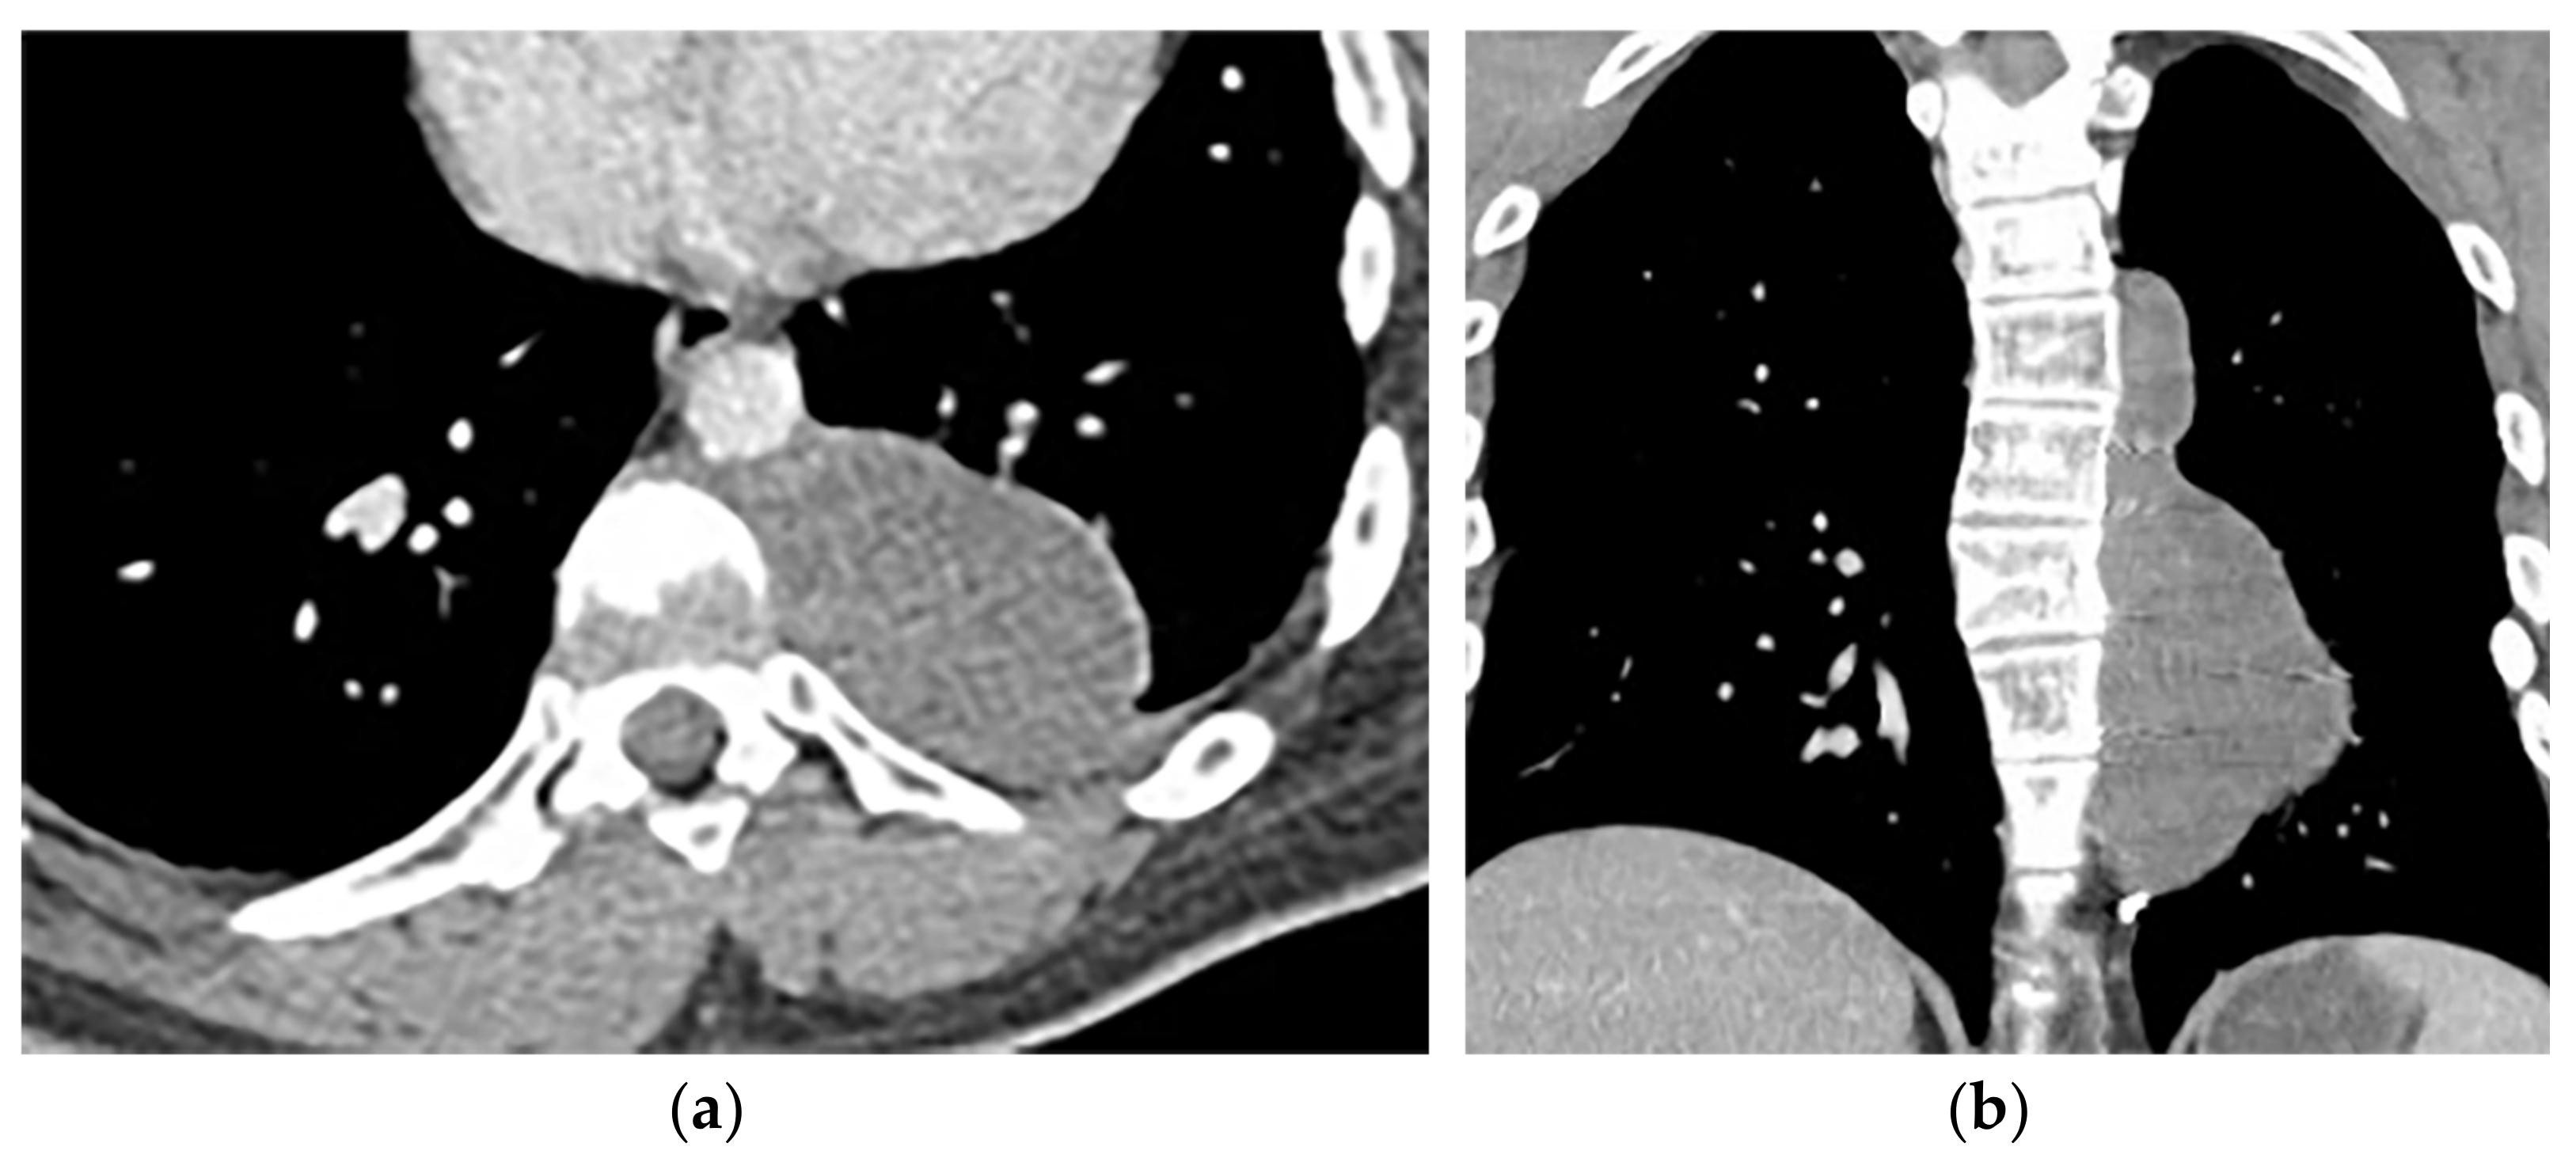
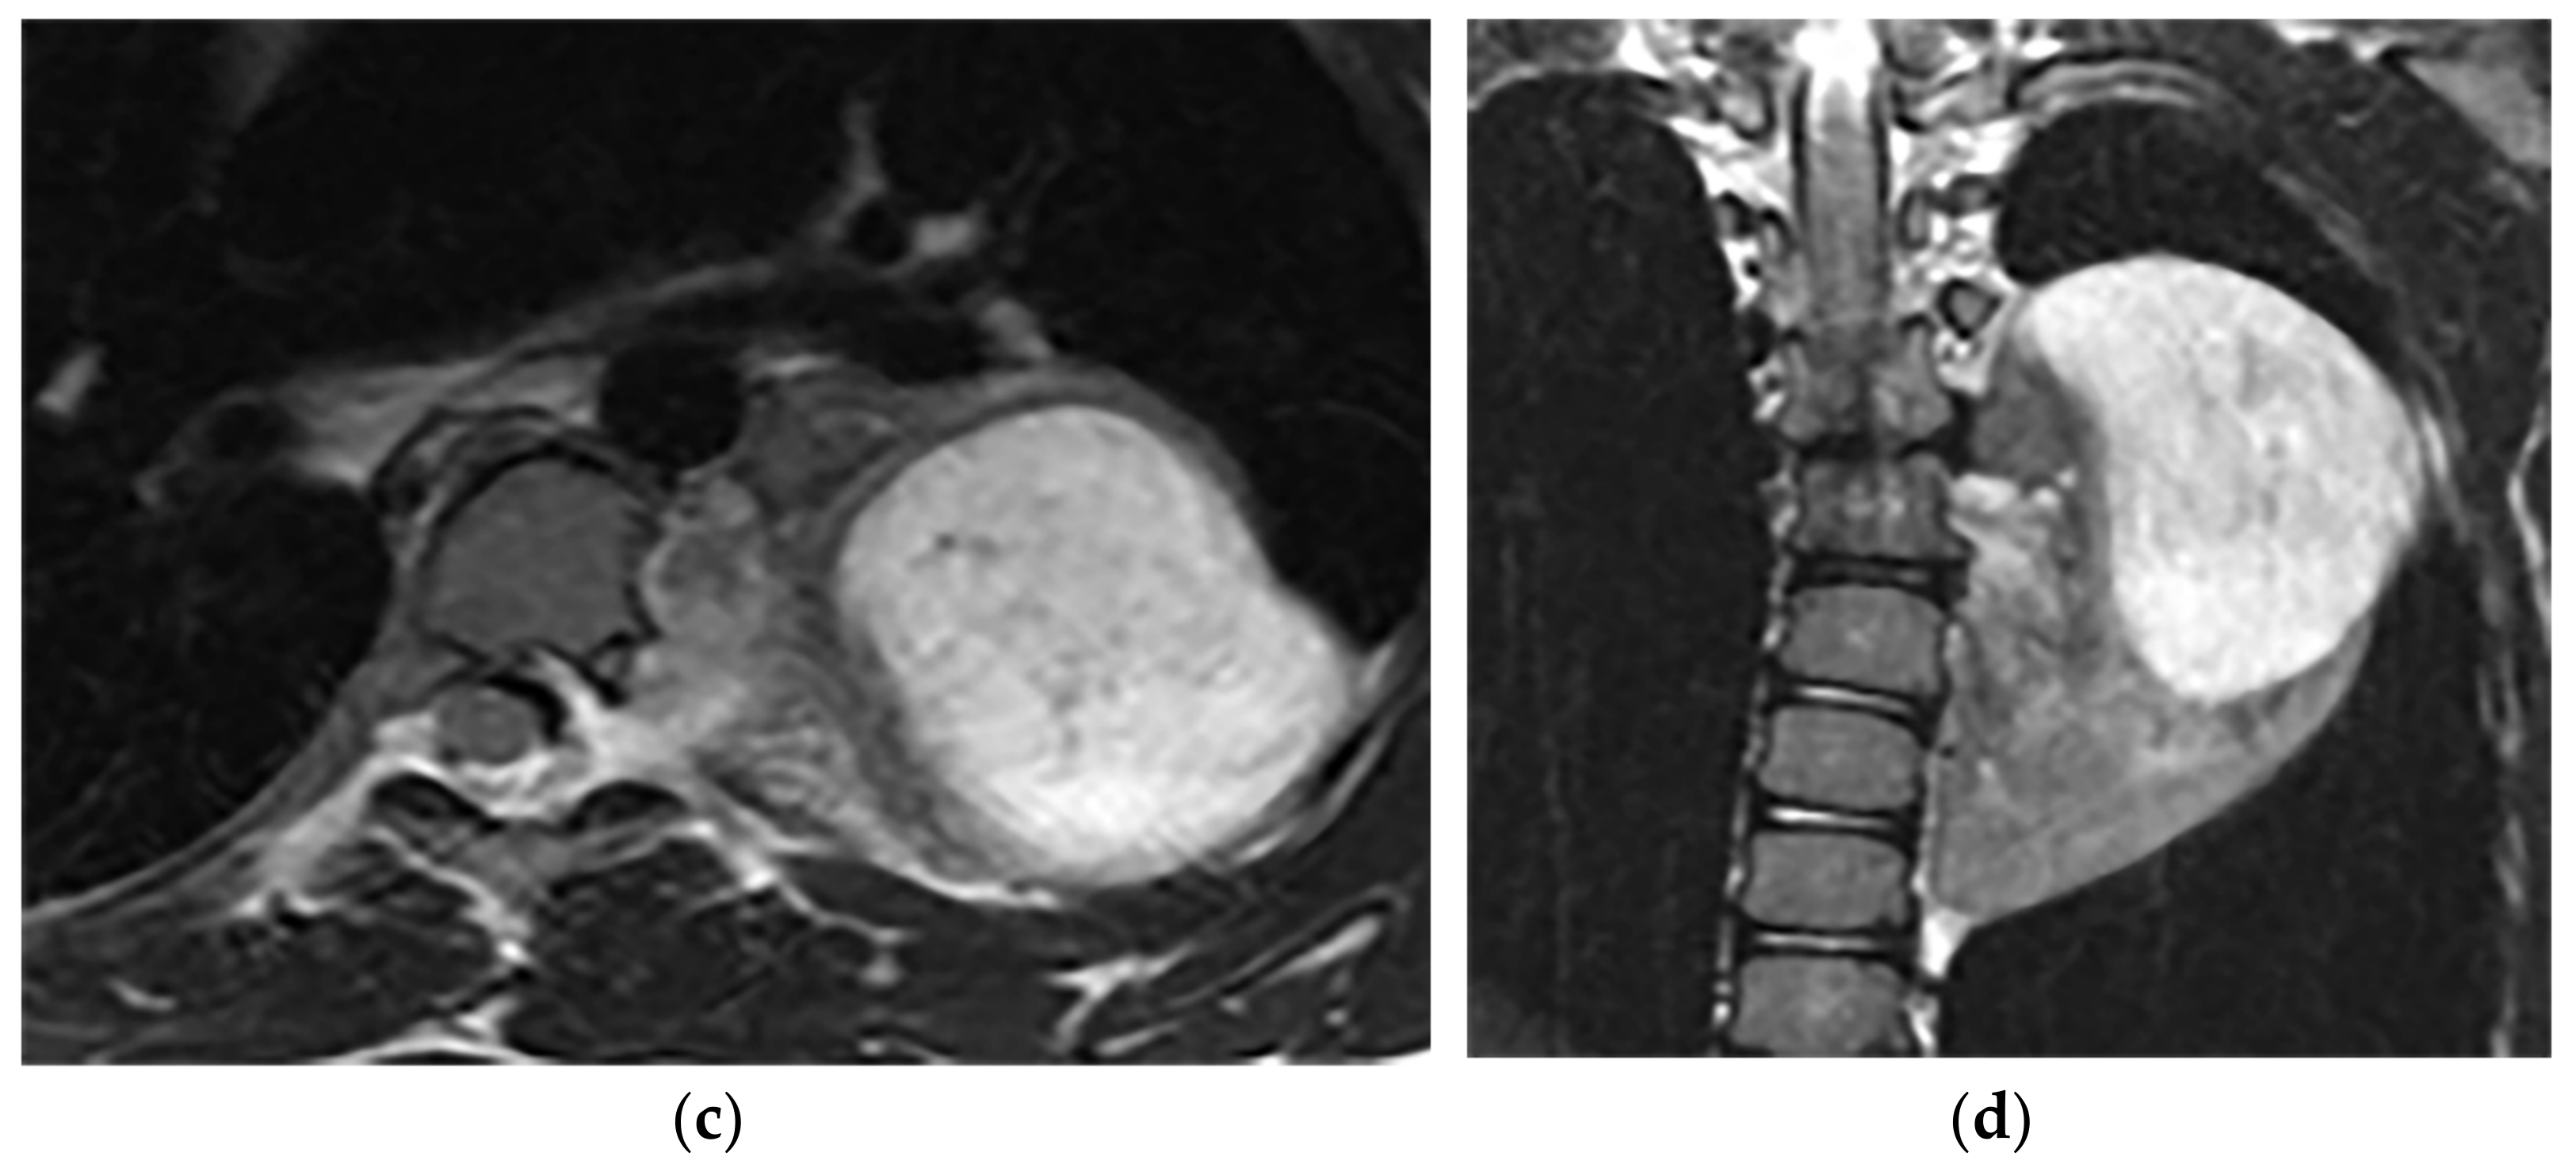 Figure 9. A 26-year-old man with incidental findings. The CT in axial and coronal views (a,b) shows a well-defined lobulated posterior mediastinal mass with homogenous attenuation and no significant enhancement after injection of contrast extending about five vertebral bodies length in the right posterior mediastinum with close contact to vertebral bodies, but with no vertebral erosion. Axial (c) and coronal T2W (d) of another patient with the same pathology show well-defined elliptical posterior mediastinal mass with heterogeneously high signal intensity intermixed with internal patchy and linear hypointensity. It also erodes the left lateral aspect of the vertebral body but with no intradural extension. Vertical orientation is typical for sympathetic chain tumors.
3.2. Lateral Meningocele
Lateral thoracic Meningocele is a rare condition defined as herniation of meninges through the vertebral column defect or enlarged neural foramina. It can be unilateral or bilateral and is usually associated with neurofibromatosis type 1 (Table 2). It is most common during the 4th to 5th decades of age, with female predominance [17][46].| Tumor Type | Imaging Findings | |
|---|---|---|
| CT | MRI | |
| Neurogenic | ||
| Lateral Meningocele | Well-circumscribed paravertebral mass with attenuation similar to CSF. CT myelography: ipsilateral neural foramina enlargement communicating with subarachnoid space. |
T1W: hypointense T2W: hyperintense (similar intensity to CSF) T1WFS + C: lack of enhancement |
| Pseudomeningocele | Differentiated from Meningocele by lack of dura wrapping. | T1W: hypointense T2W: hyperintense (similar intensity to CSF) T1WFS + C: lack of enhancement [18][47] |
| Others | ||
| Extramedullary hematopoiesis | Heterogeneous mass with internal foci of fat with lack of calcification. | T1W, T2W: heterogeneous with internal foci of hyperintensity in old lesions (representative of fat), the intermediate intensity with subtle or no enhancement in active lesions |
| Asbestos-related pleural plaques | Calcified or non-calcified focal pleural thickening, “Comet tail” appearance usually seen in lower lobes [19][48]. | T1W: hypo to isointense T2W: hypointense (due to fibrosis or calcification) [20][49] |
| Empyema necessitance | Connection of pleural collection to extrapleural mass, soft tissue inflammation, rib destruction with periosteal reaction, and fluid collection. | T1W: hypointense effusion and fluid collection T2W: hyperintense effusion, increased thickness of extrapleural fat, and chest wall muscles with hyperintense on T2WFS T1WFS + C: pleural and septal enhancement |
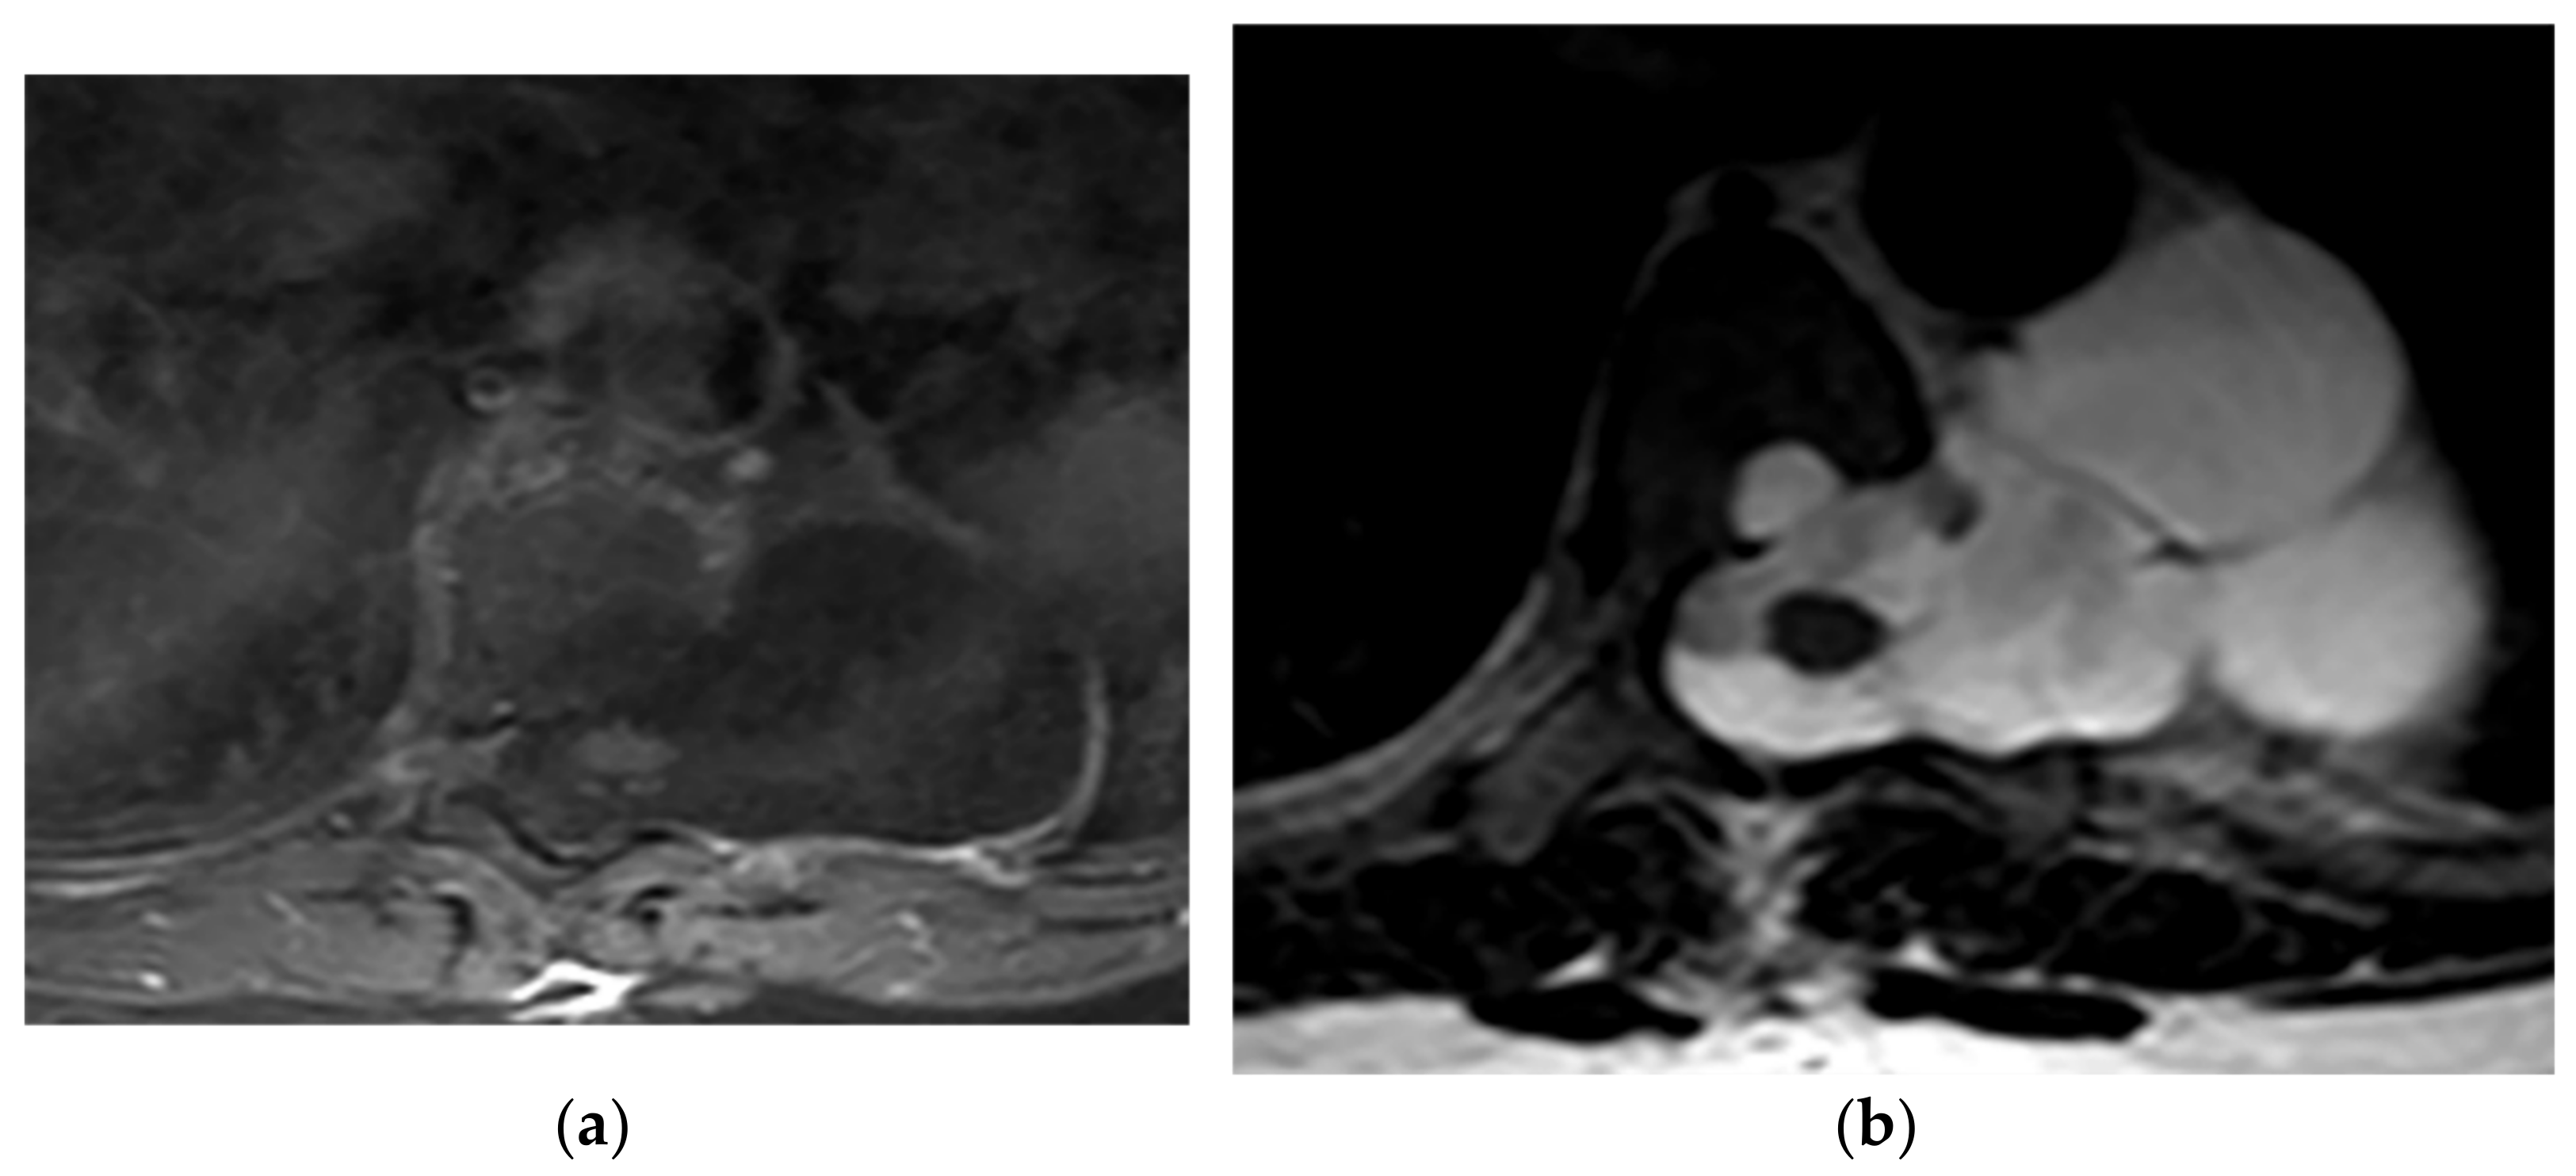 Figure 10. A 21-year-old man with Neurofibromatosis type 1. The axial T1FS (a) and T2W (b) show lateral expansion of CSF-filled sac through T6-T7 level with scalloping of the adjacent vertebral body. It has similar signal intensity to CSF in both T1W and T2W sequences and hypo and hypersignal intensity, respectively. No entrapped fat or neural elements were seen. Slightly anterior spinal cord displacement was also identified, which is compatible with lateral Meningocele.
3.3. Pseudomeningocele
) [25,47].
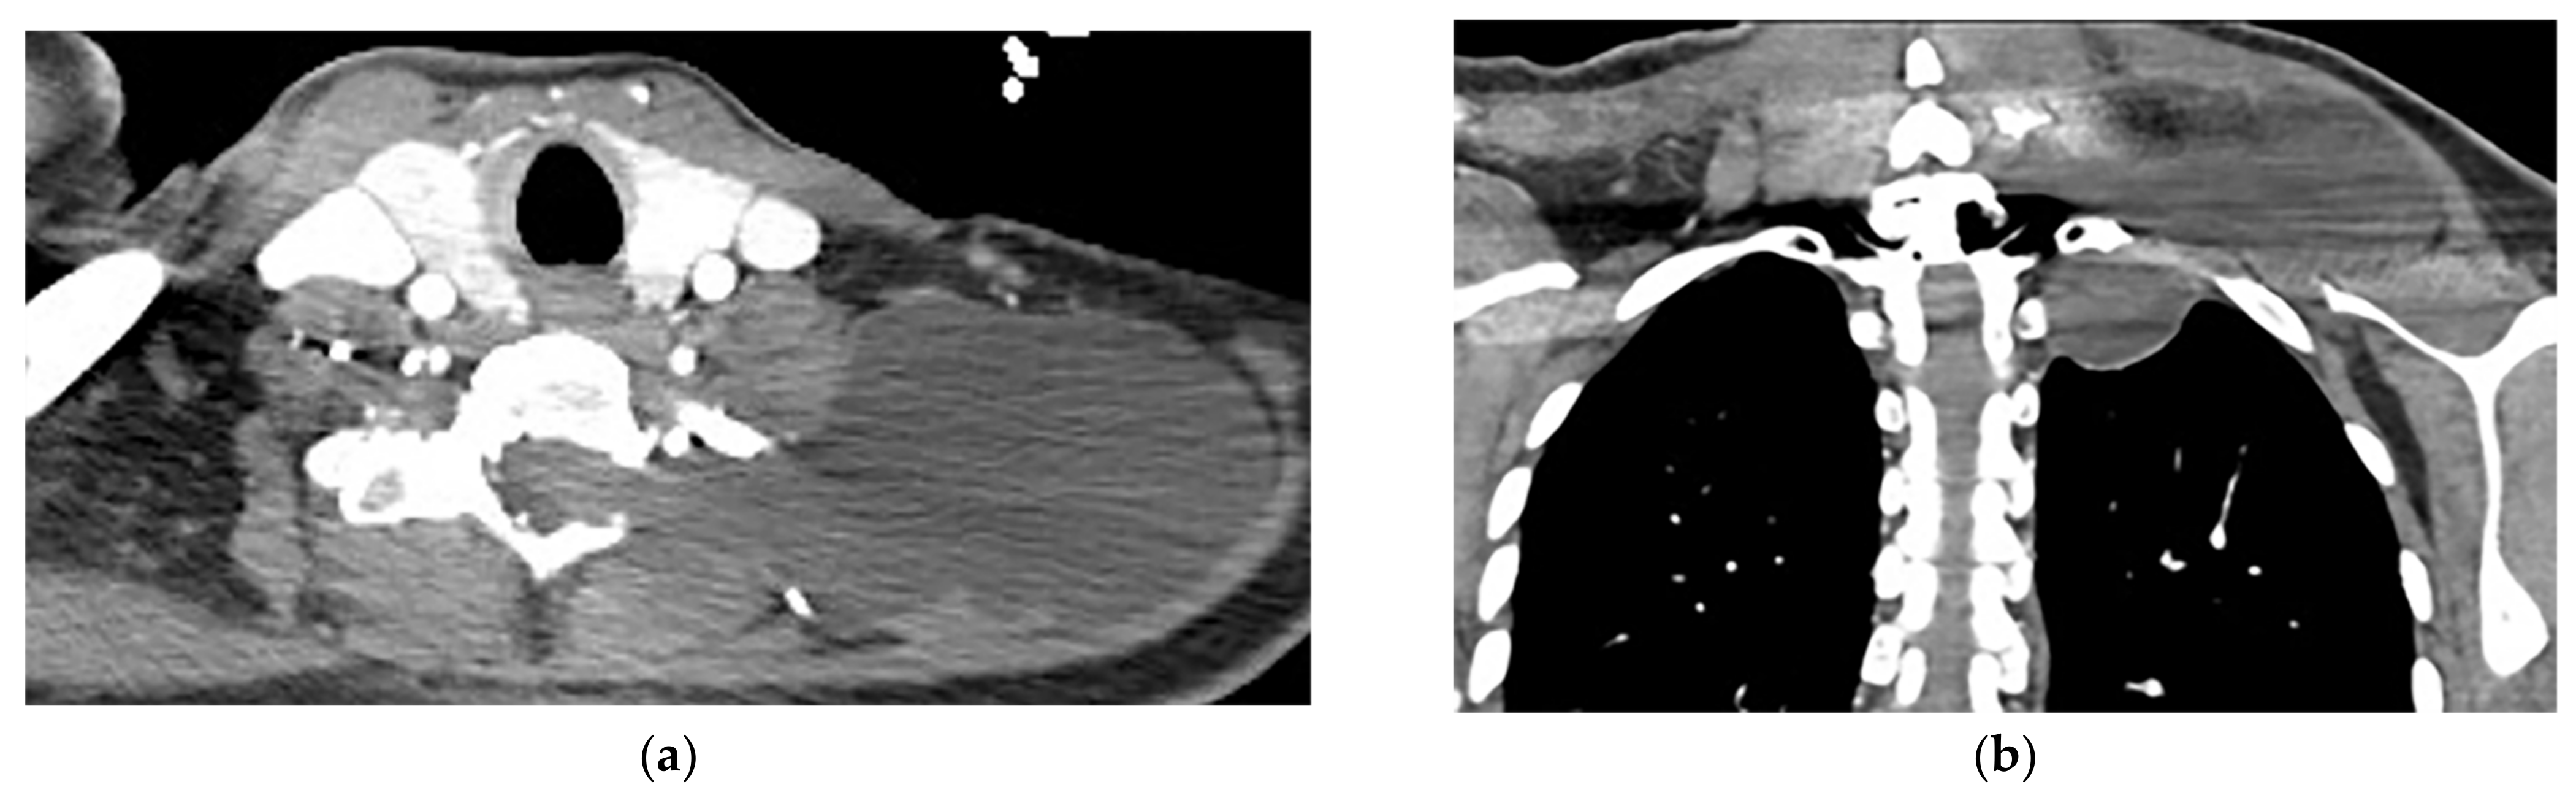 Figure 11. A 38-year-old man with a history of a remote motor vehicle collision. The axial (a) and coronal (b) contrast-enhanced CT show abnormal well-defined extraspinal fluid collection at the level C6-T1, which extends through the left neural foramina (lateral recess), communicating with CSF space. There is no edema, solid component, or abnormal enhancement within the mentioned collection or adjacent muscles. Regarding the history of trauma, a Pseudomeningocele diagnosis was made and was confirmed in MRI (not shown).
4. Lipomatosis Tumors
Radiologic characteristics of lipomatosis tumors are summarized in Table 1.4.1. Lipoma
); other non-adipose components such as calcification and septa might also be seen. On MR imaging, signal intensity is identical to subcutaneous fat on T1-weighted and T2-weighted images. It typically does not enhance gadolinium-enhanced MR images except for septa with less than 2 mm thickness [8,16,50,51].
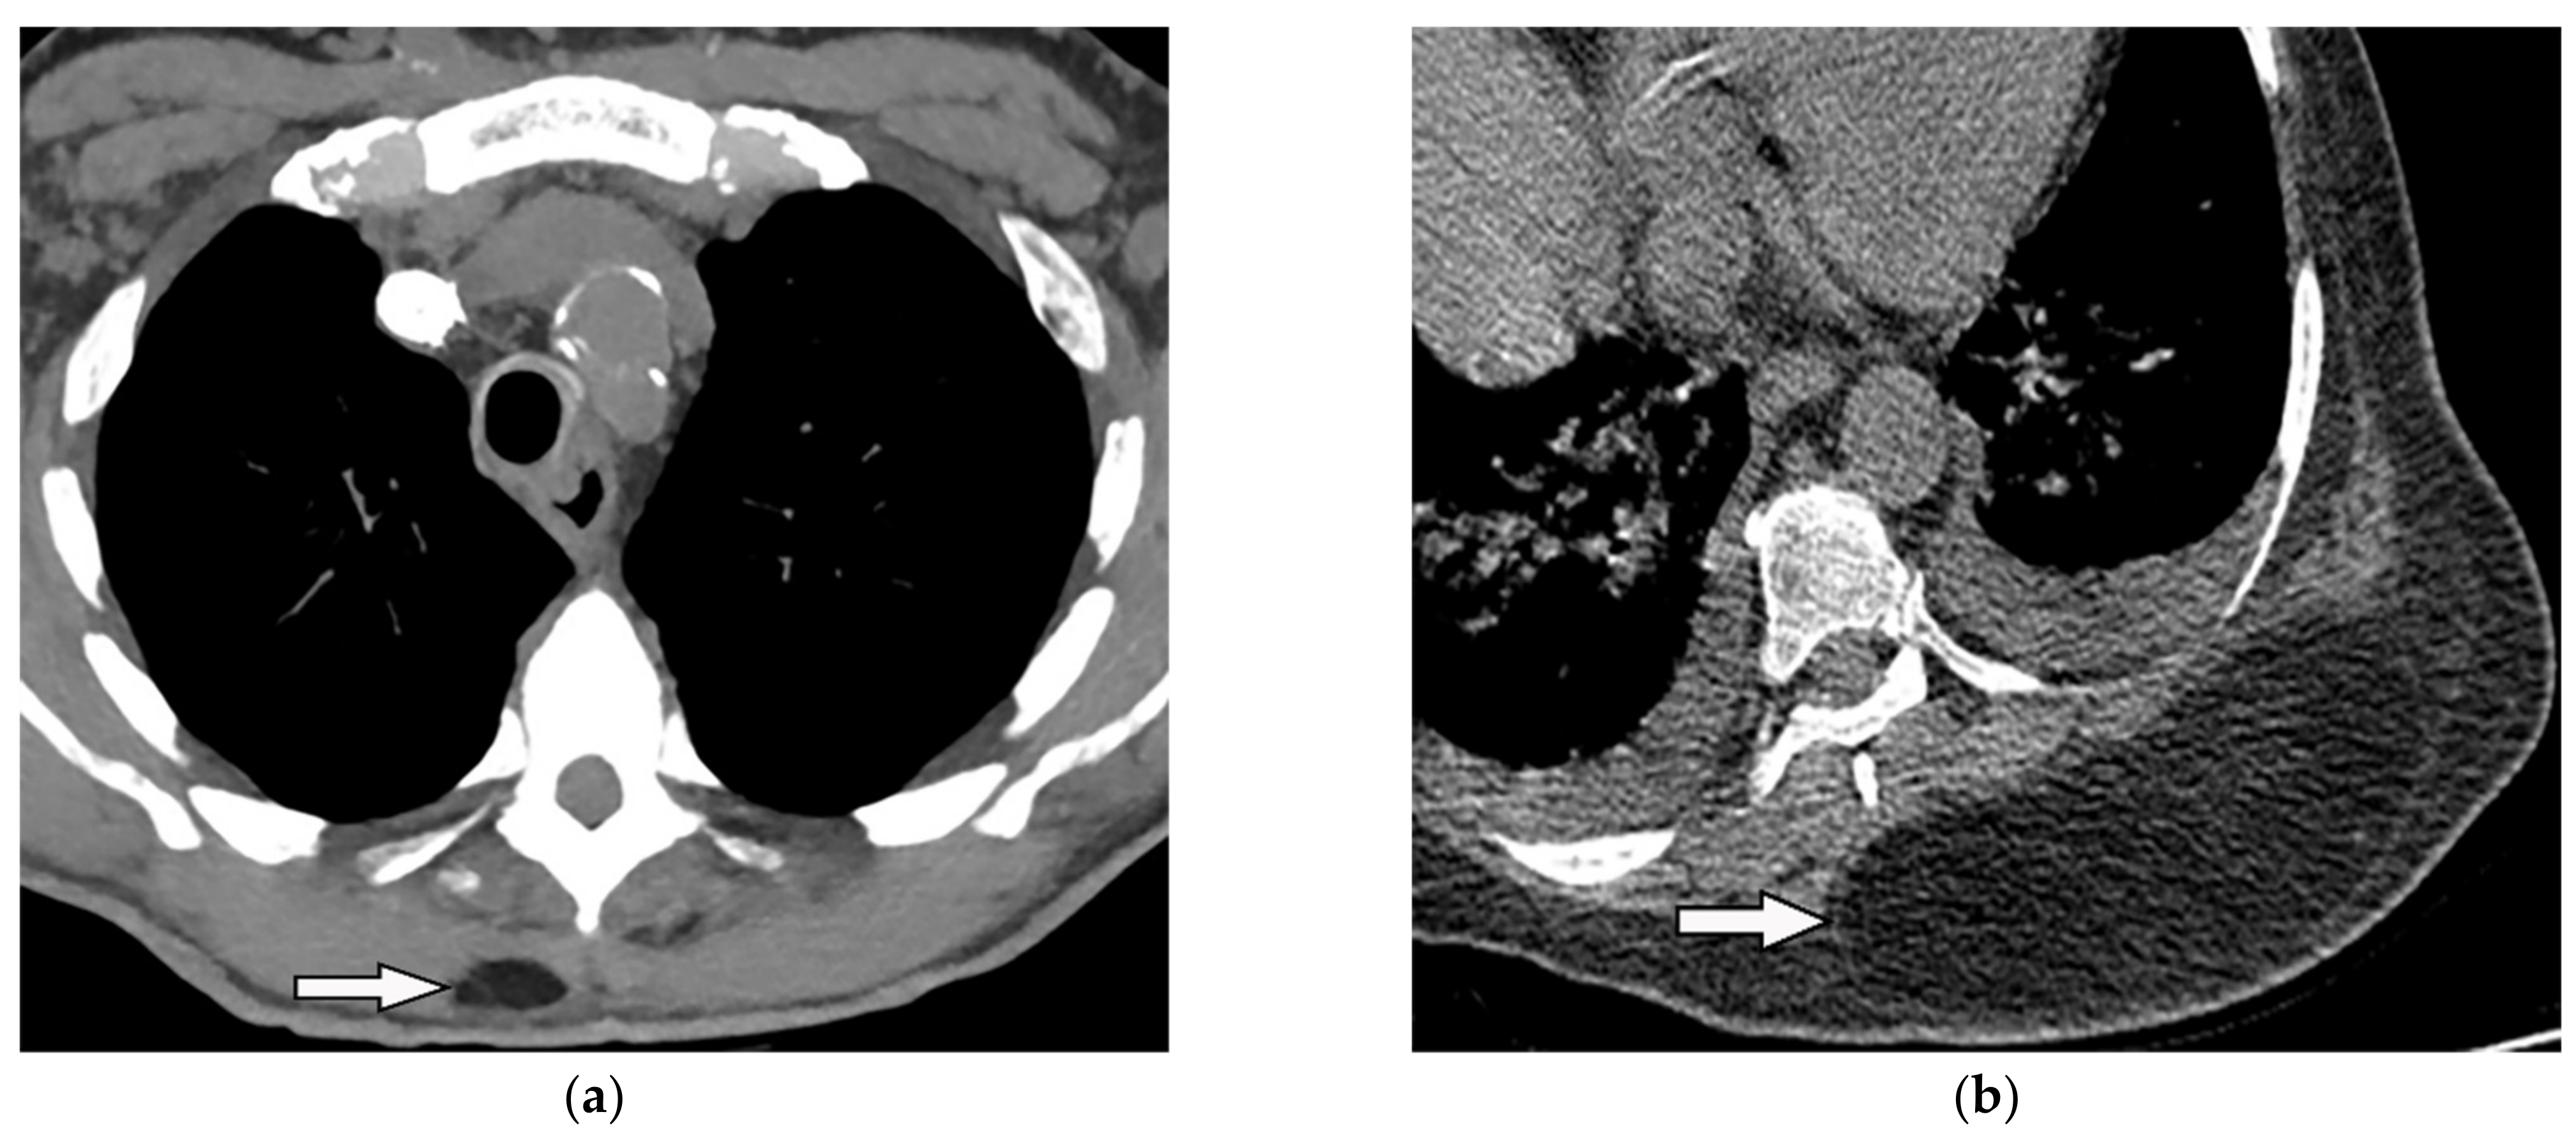 Figure 12. A 34-year-old man, with a case of SVC thrombosis with incidental finding. (a) Non-contrast-enhanced CT in axial plane demonstrates well-circumscribed lesion in the right posteromedial aspect of the chest wall with similar attenuation to subcutaneous fat with no internal septa. Multiple collaterals are also shown in the anterior aspect of the chest wall, maybe formed due to underlying SVC occlusion. (b) Axial plane CT of another patient shows large posteromedial chest wall mass with attenuation similar to adjacent subcutaneous fat compatible with lipoma.
4.2. Liposarcoma
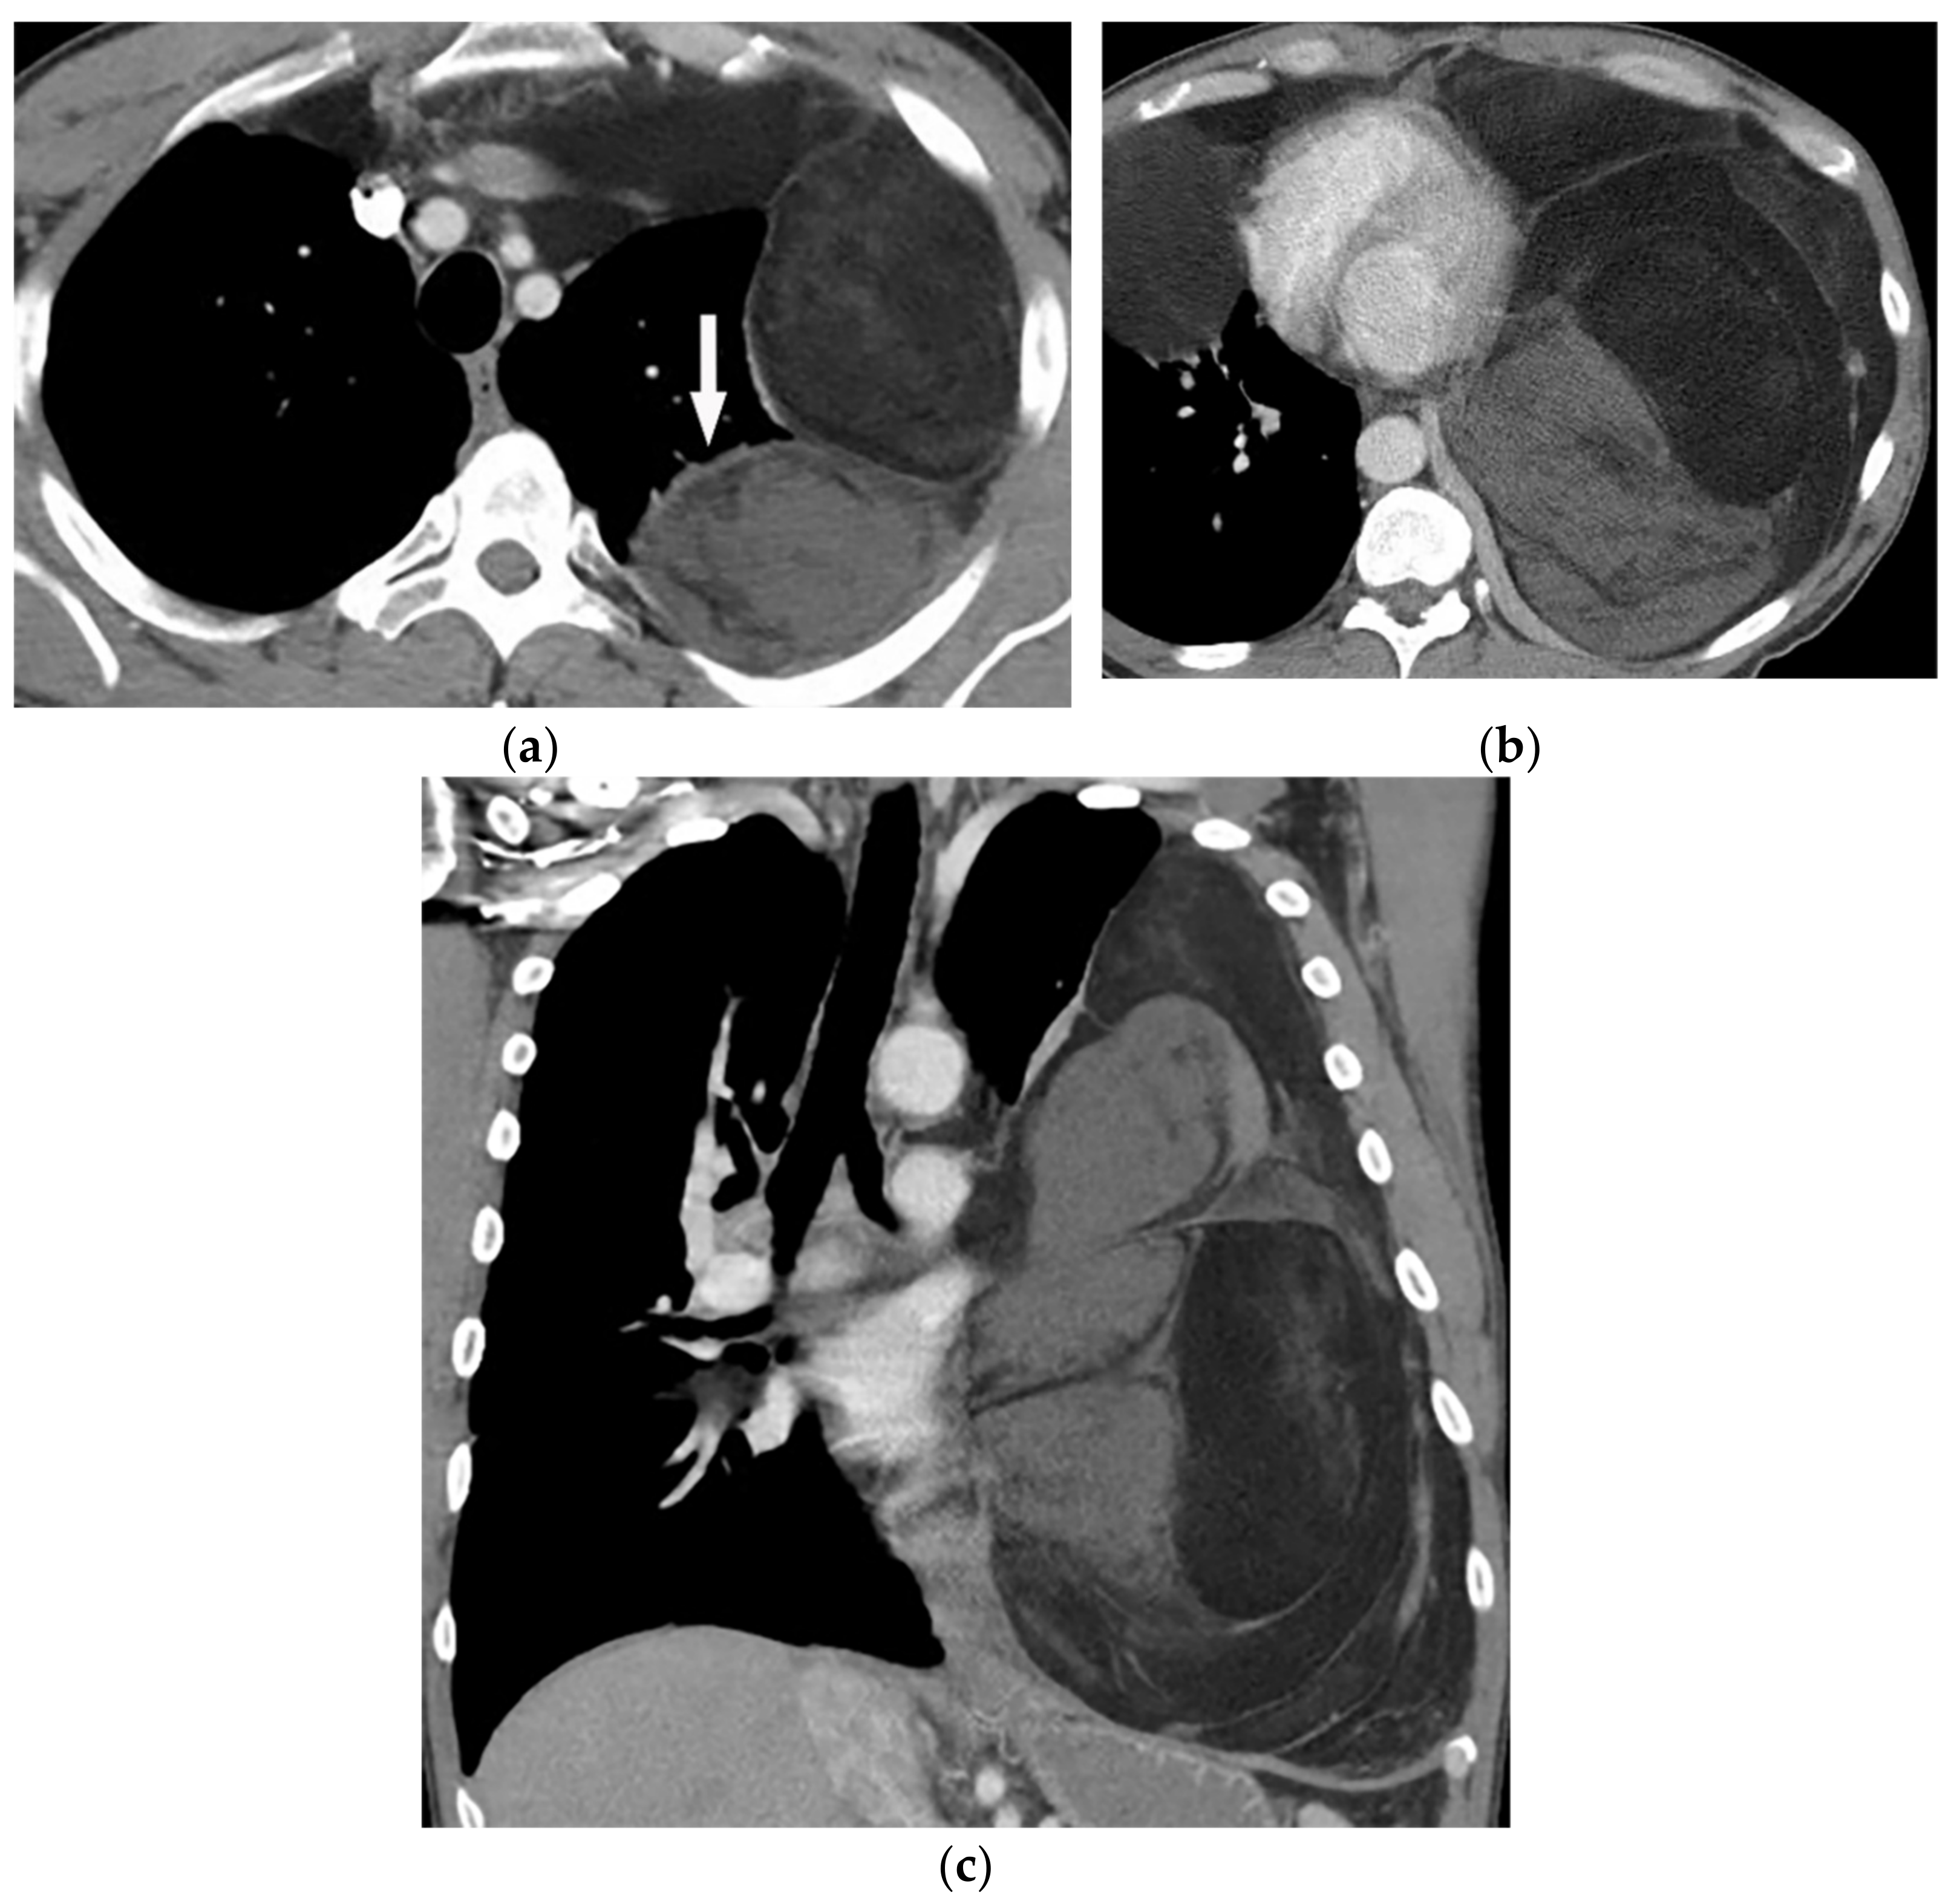 Figure 13. A 58-year-old man with dyspnea. (a,b) Axial contrast-enhanced CT shows a large heterogeneous mass with enhancing non-adipose solid components (arrow). The mass has extensive fat attenuation that is intermixed with soft tissue density. (c) Coronal image better characterizes the craniocaudal extension of the mass, which also shows a large inhomogeneous fat-containing lesion with an internal enhancing solid component.
5. Pleural Diseases
5.1. Empyema Necessitance
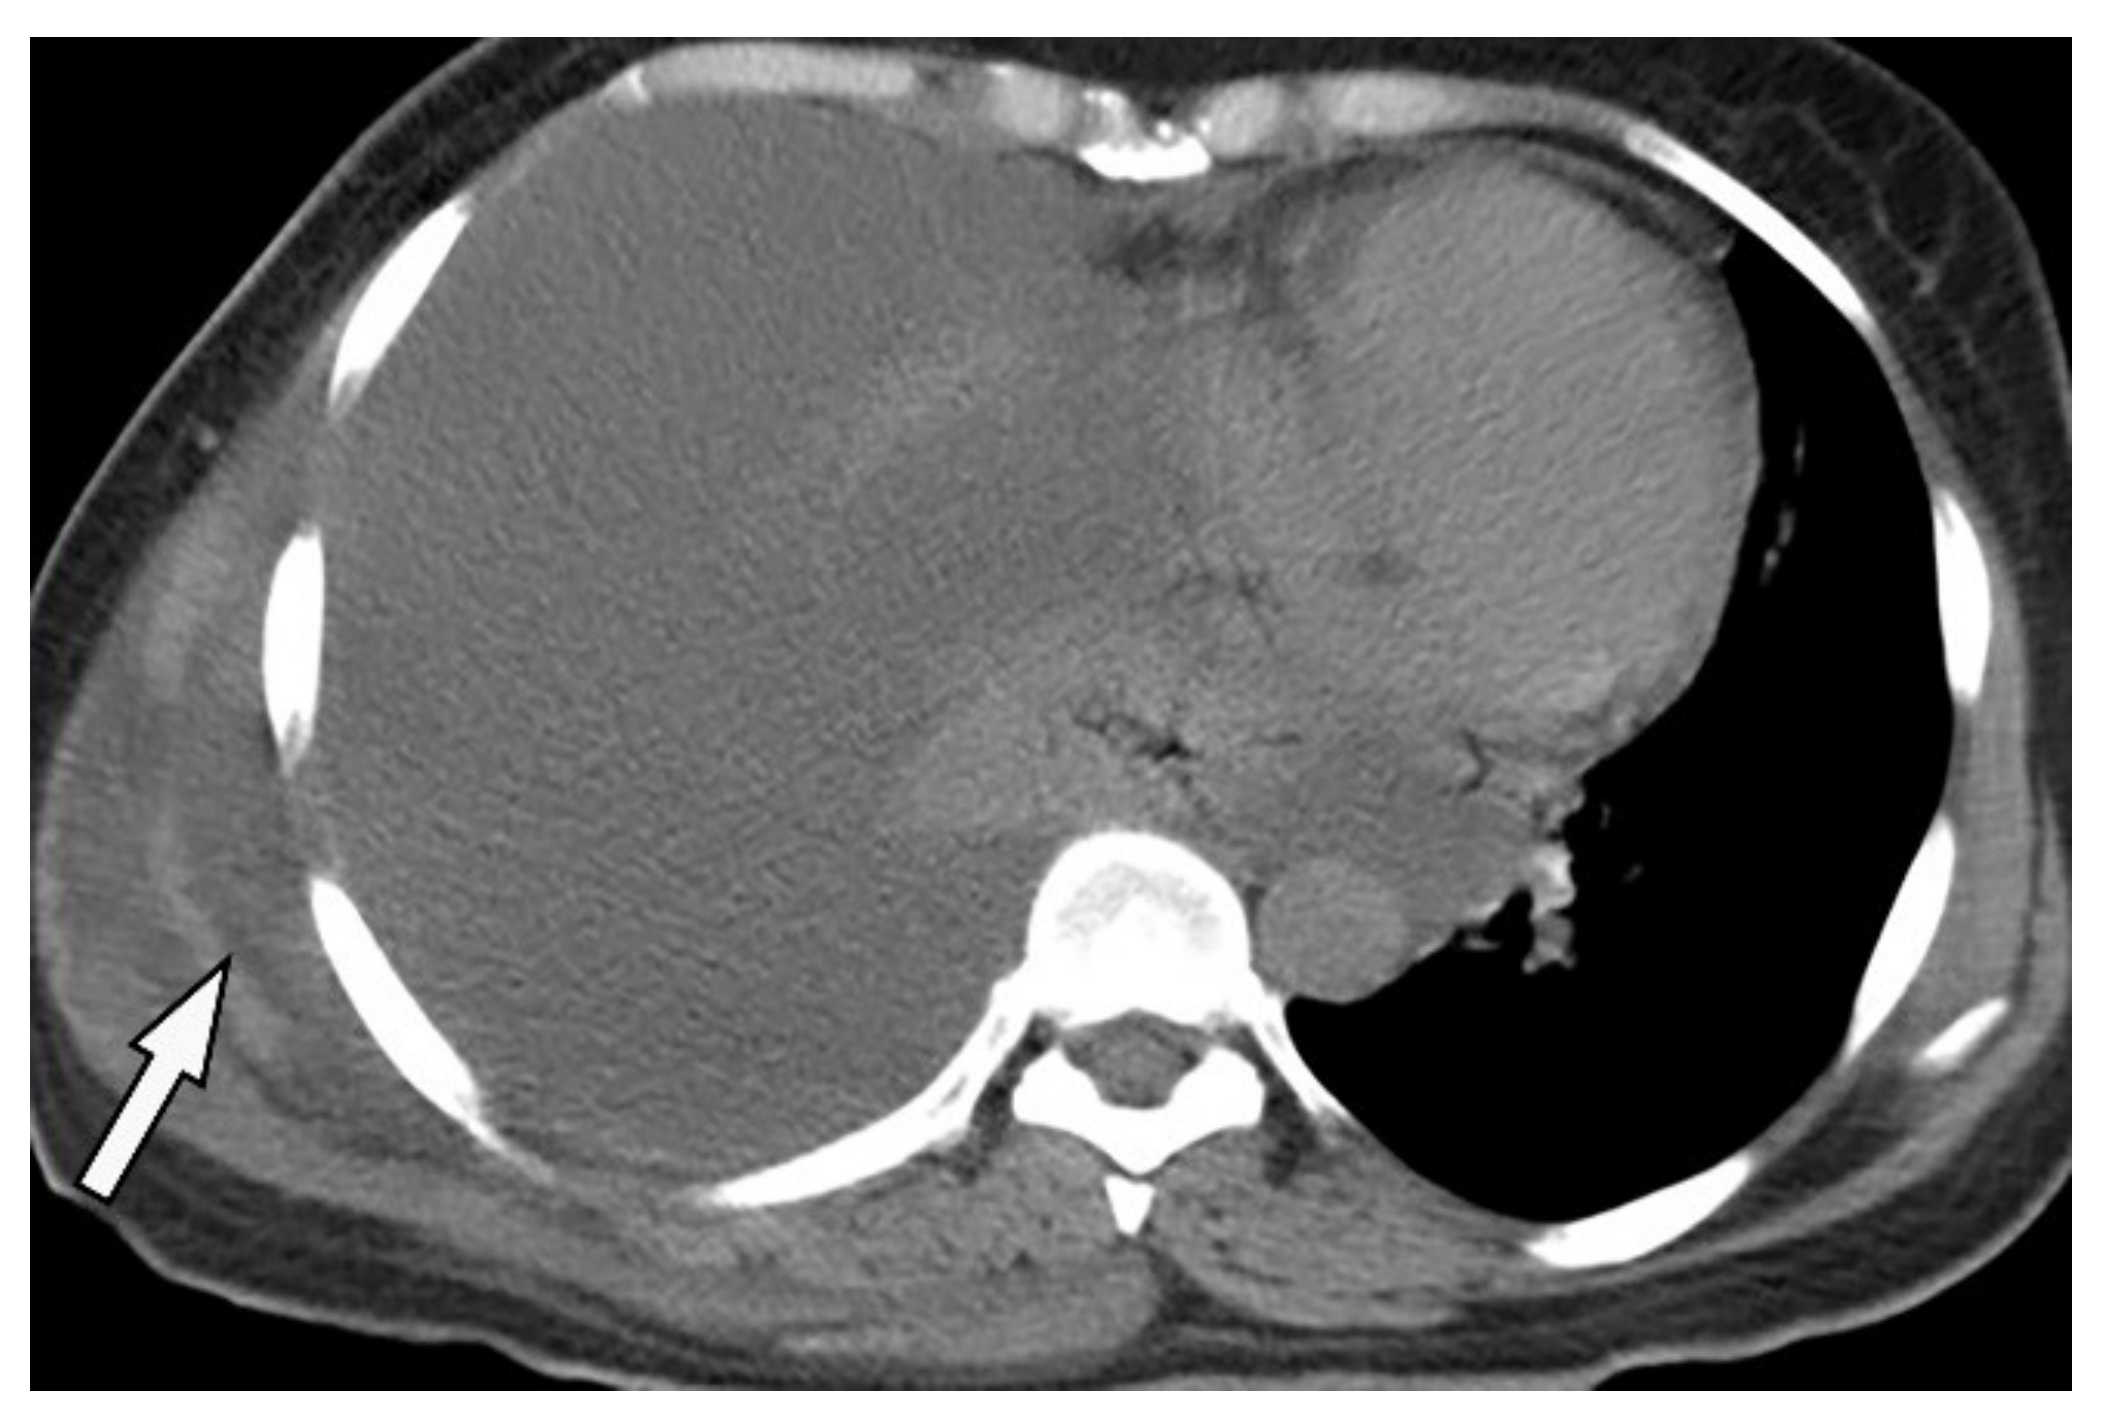 Figure 14. A 46-year-old man with high-grade fever and chills. The axial contrast-enhanced CT shows significant right-sided pleural effusion with the near complete collapse of the right lung resulting in a shift of the heart and mediastinum to the left side. There is pleural thickening and enhancement. There is an extrapleural component within the adjacent chest wall with rim enhancement (arrow). Aspiration was performed under the guidance of ultrasonography, and diagnosis of empyema necessitans was made as a complication of Actinomyces Israelii.
5.2. Asbestos-Related Pleural Diseases
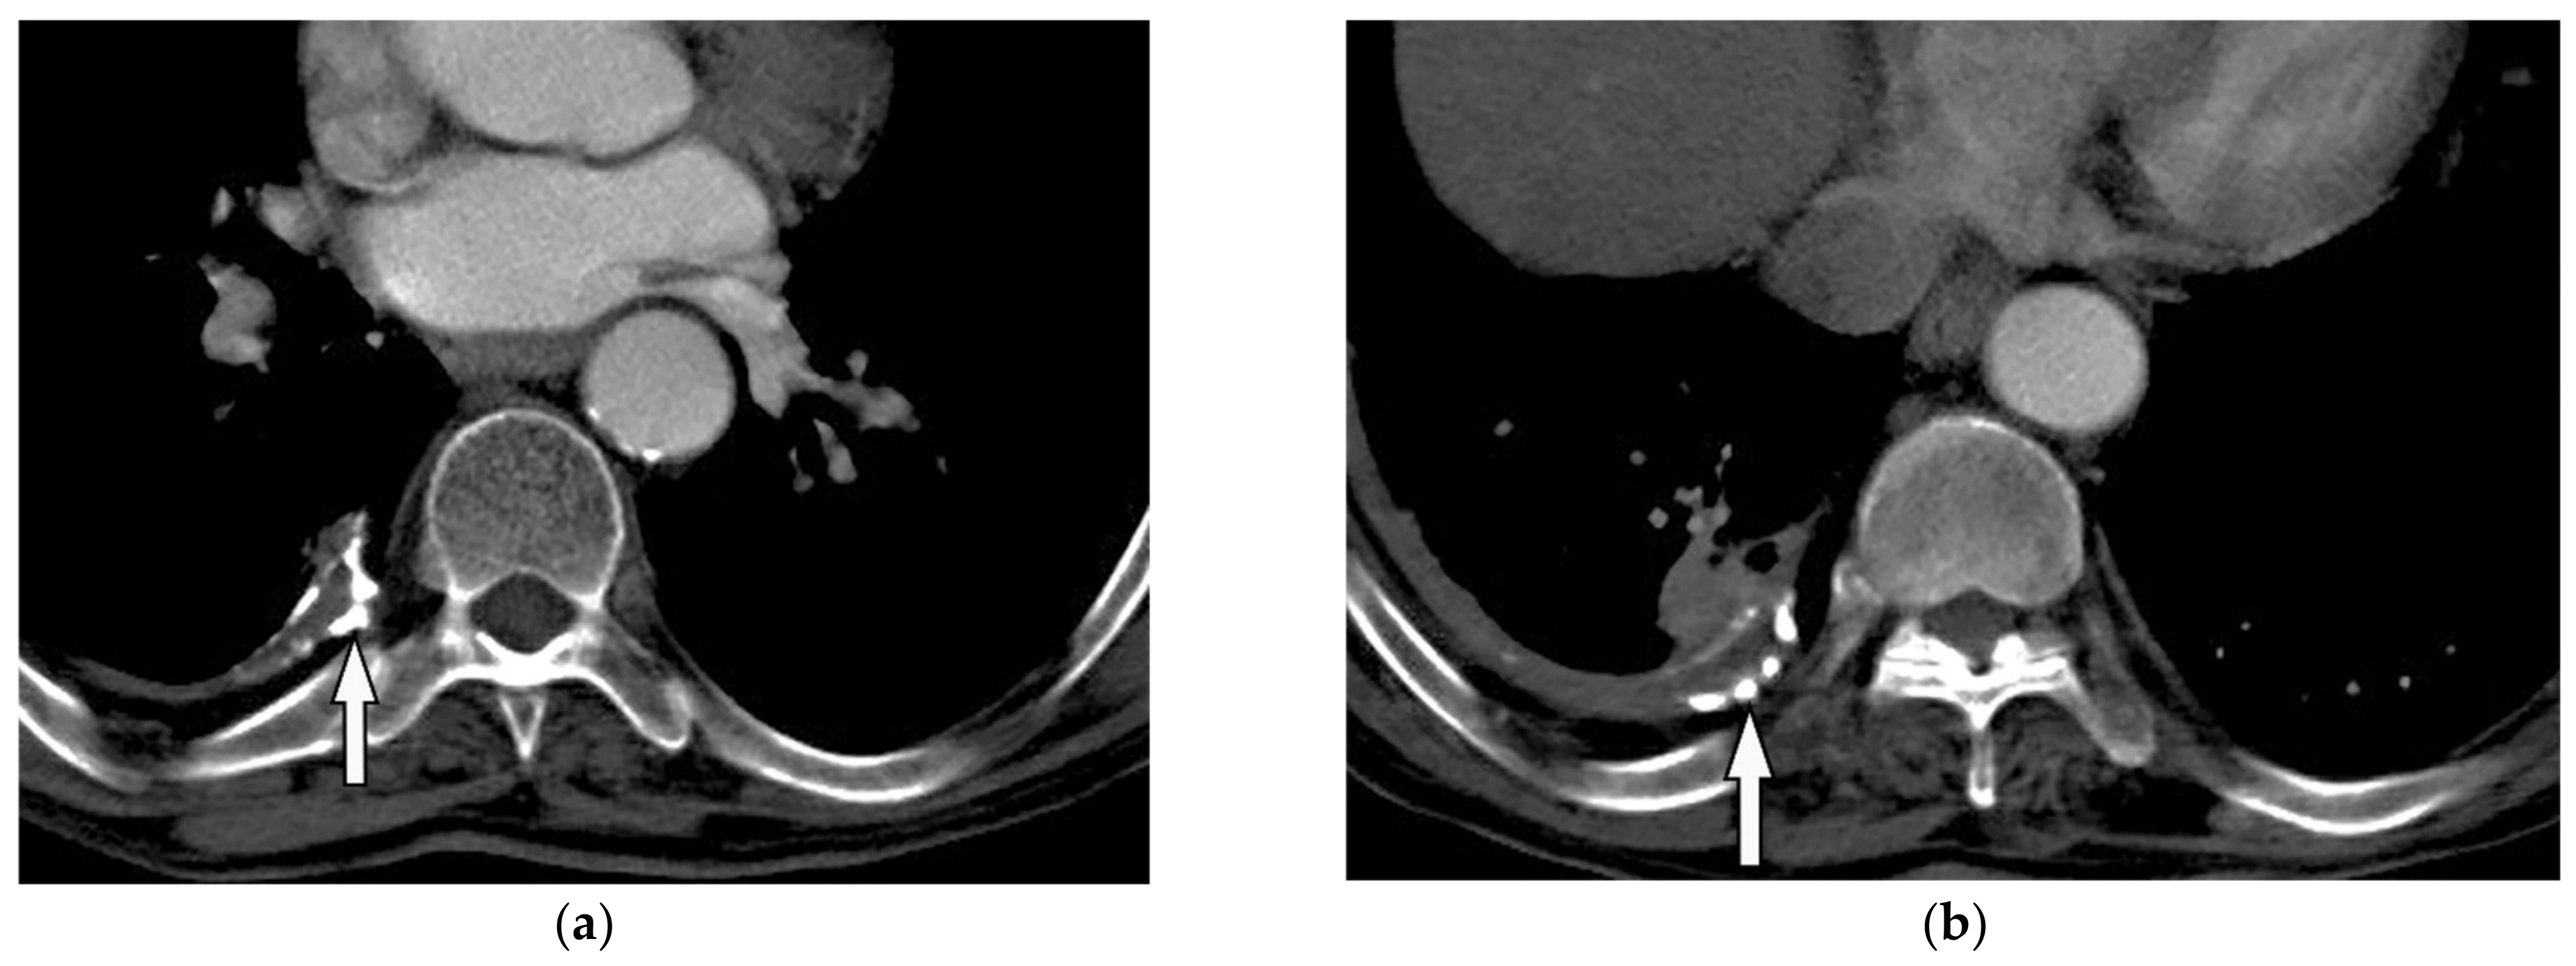 Figure 15. A 78-year-old man with dyspnea. The axial contrast-enhanced CT (a,b) demonstrates right-sided calcified pleural plaque (arrow) and small pleural effusion due to previous asbestosis exposure. Adjacent round atelectasis is also shown.
5.3. Mesothelioma
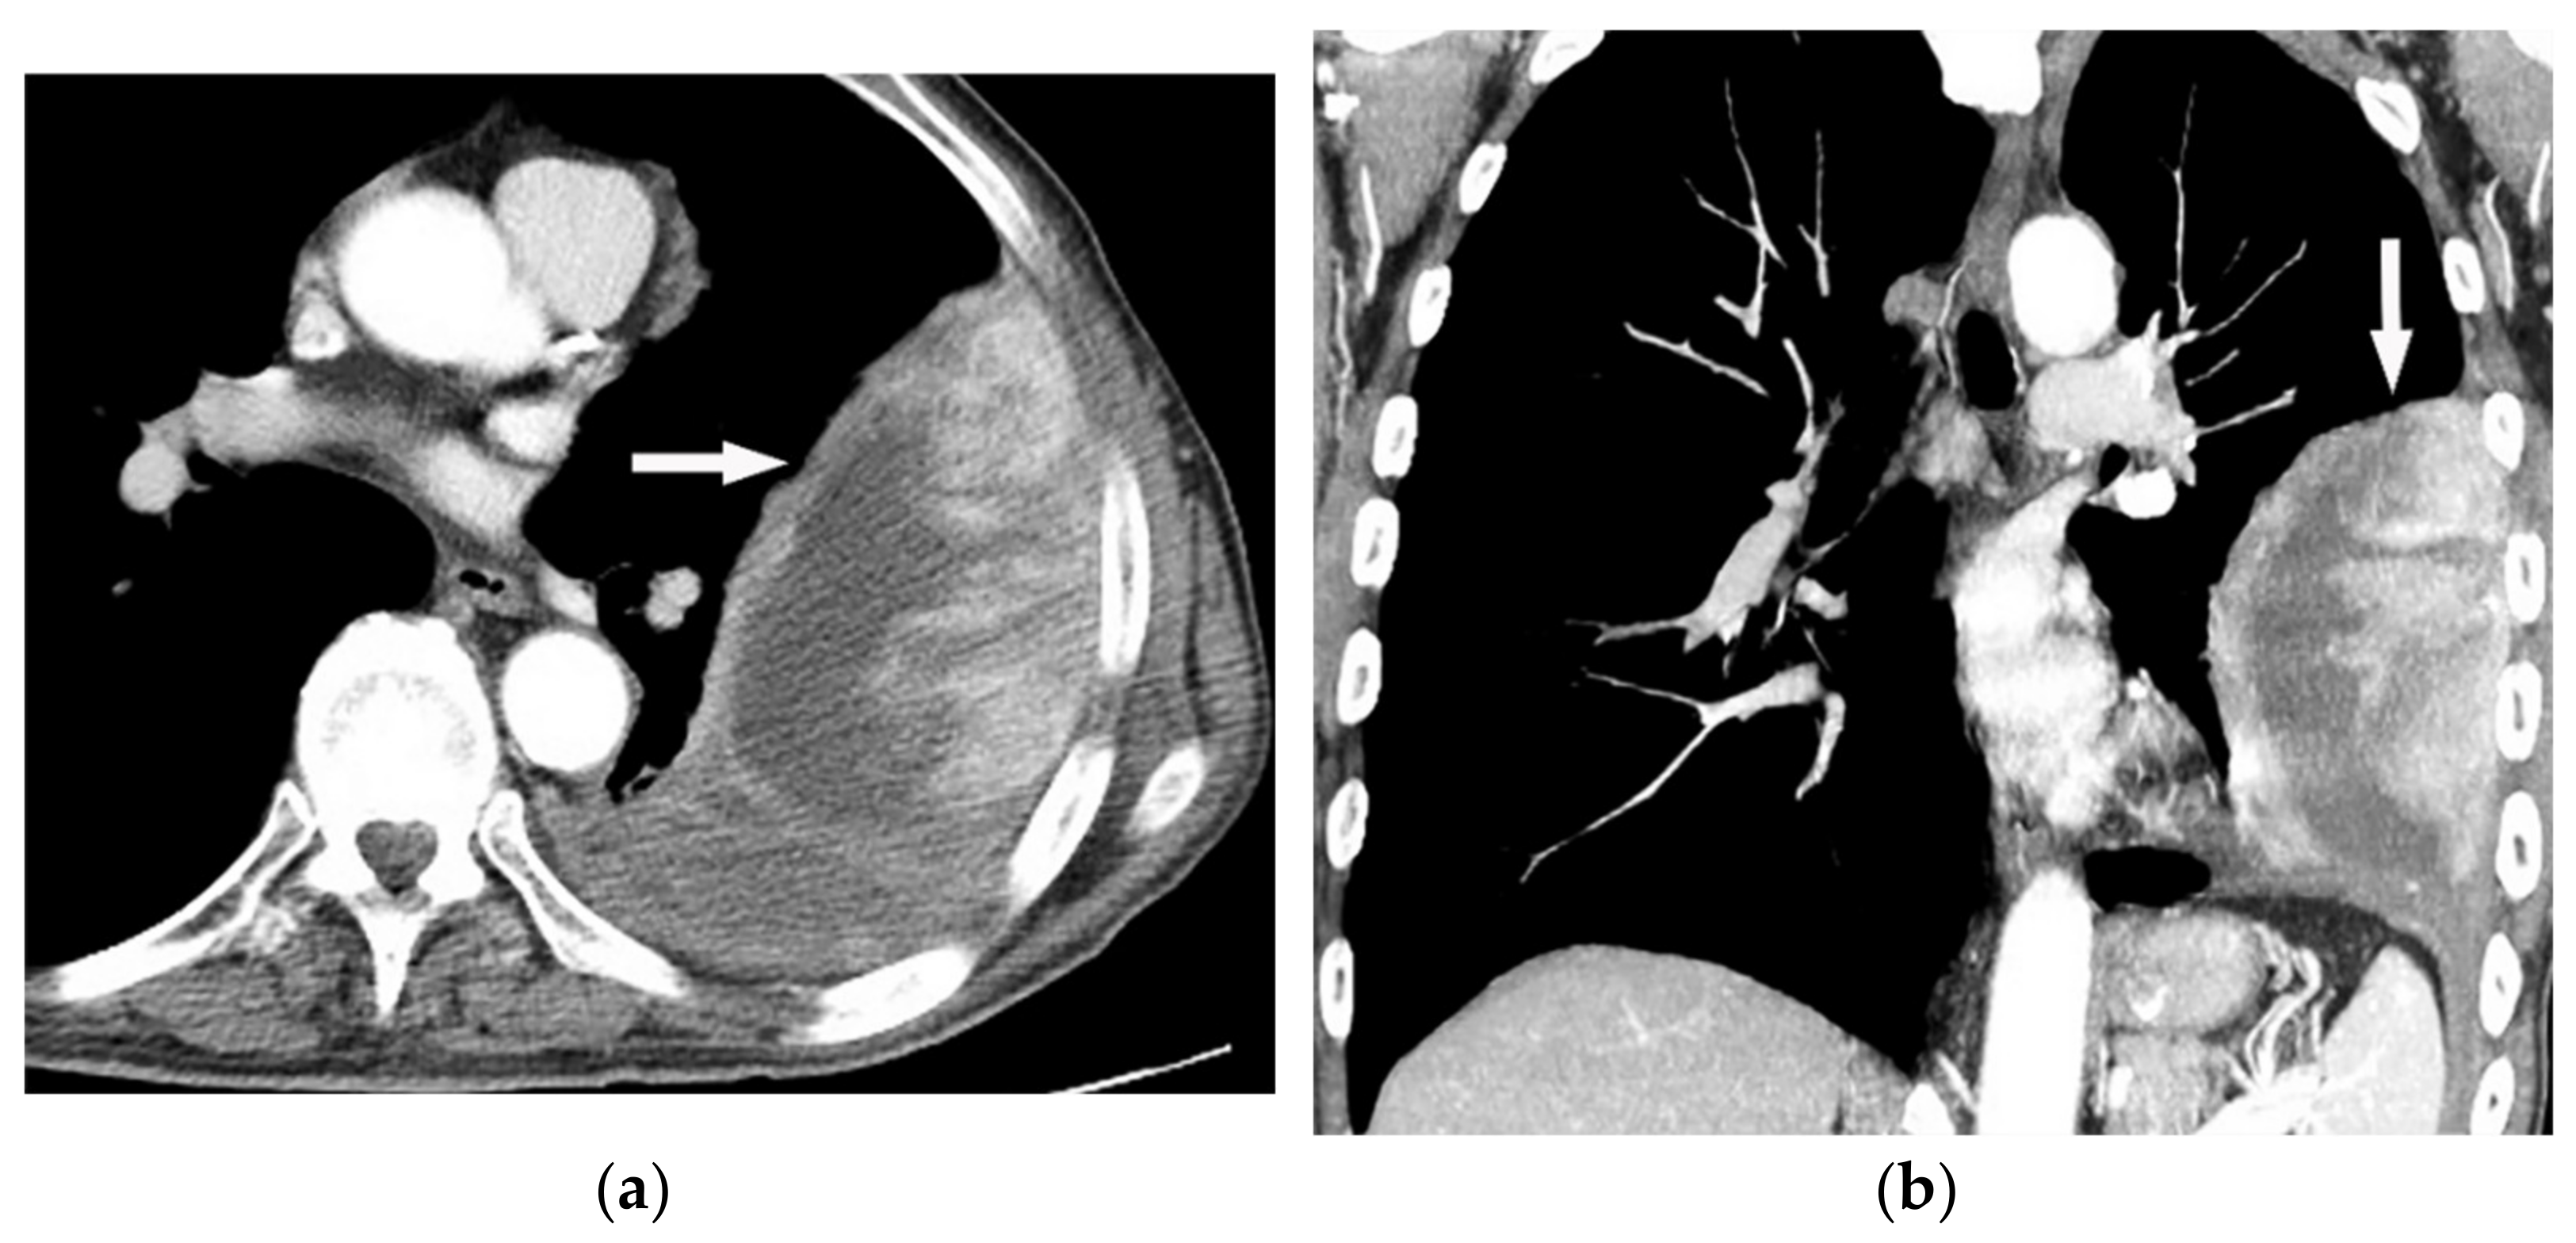 Figure 16. A 67-year-old man with dyspnea and chest pain. Contrast-enhanced CT in axial (a) and coronal (b) planes demonstrate left-sided localized enhancing pleural mass (arrow) with internal areas of necrosis that extend to the posteromedial aspect of the chest wall. Involvement of diaphragmatic pleura and elevation of left hemidiaphragm are also identified.
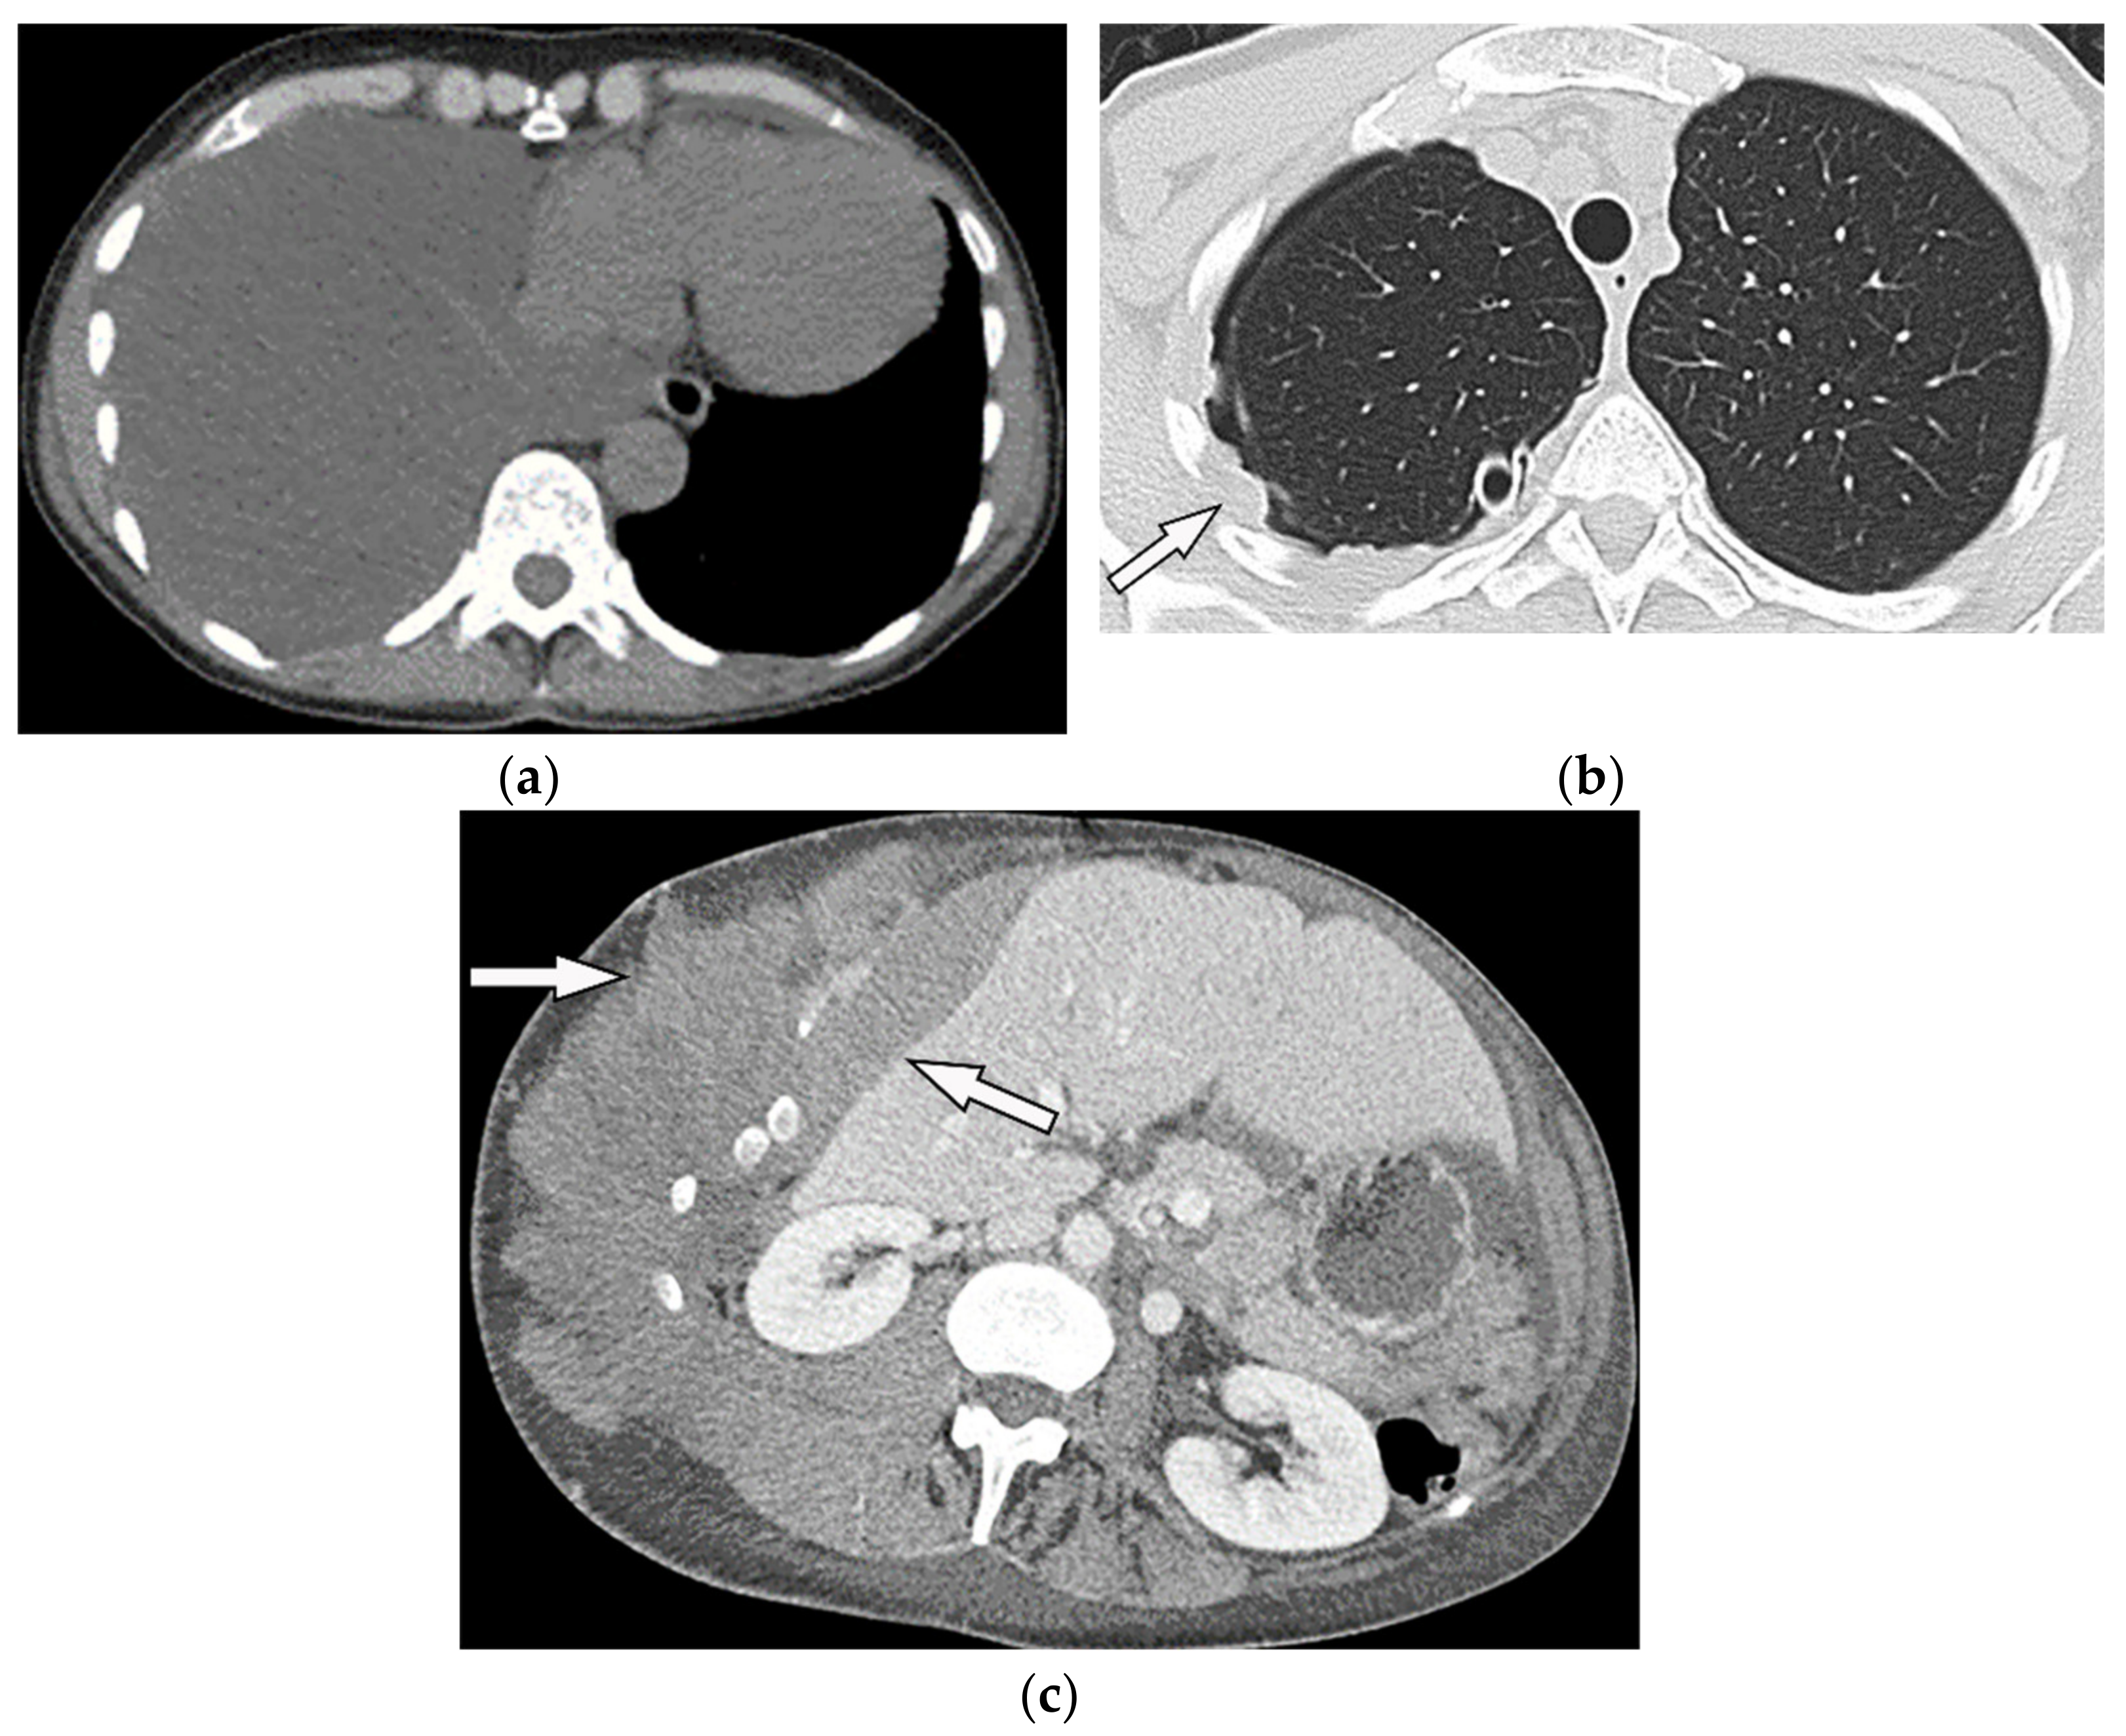 Figure 17. A 70-year-old man with dyspnea. The non-contrast CT in the axial plane demonstrates right-sided large pleural effusion, near complete collapse of the right lung (a) after the chest tube insertion; thick circumferential nodular pleural thickening of parietal pleura was shown (arrow) (b). Contrast-enhanced CT of the upper abdomen shows the extension of mesothelioma through the abdominal cavity and wall with indentation over adjacent liver parenchyma (arrow) (c).
MR imaging and 18F-FDG PET/CT are useful in further evaluation of chest wall, diaphragm, and mediastinal invasion [28][29][30][31][56,57,58,59]. Malignant mesothelioma appears as unilateral hyperintense pleural effusion and pleural thickening with iso to slight hyperintensity to chest wall muscles on T1-weighted and moderate hyperintensity on T2-weighted images. Post-contrast enhancement is expected (Table 1). It is believed that higher metabolic activity on 18F-FDG PET/CT is associated with poor prognosis and shorter survival time [21][28][29][30][25,56,57,58].
Figure 17. A 70-year-old man with dyspnea. The non-contrast CT in the axial plane demonstrates right-sided large pleural effusion, near complete collapse of the right lung (a) after the chest tube insertion; thick circumferential nodular pleural thickening of parietal pleura was shown (arrow) (b). Contrast-enhanced CT of the upper abdomen shows the extension of mesothelioma through the abdominal cavity and wall with indentation over adjacent liver parenchyma (arrow) (c).
MR imaging and 18F-FDG PET/CT are useful in further evaluation of chest wall, diaphragm, and mediastinal invasion [28][29][30][31][56,57,58,59]. Malignant mesothelioma appears as unilateral hyperintense pleural effusion and pleural thickening with iso to slight hyperintensity to chest wall muscles on T1-weighted and moderate hyperintensity on T2-weighted images. Post-contrast enhancement is expected (Table 1). It is believed that higher metabolic activity on 18F-FDG PET/CT is associated with poor prognosis and shorter survival time [21][28][29][30][25,56,57,58].