The International Energy Agency (IEA, 2013) believes that energy efficiency should be taken as the first fuel rather than a hidden fuel and regards it as “a key tool for boosting economic and social development. From an economic perspective, efficiency is defined as the full and most efficient use of limited and scarce resources to satisfy people’s wants and needs given the technology, that is, produce more with less. If there is no way to make someone better off and nobody worse off, then the situation is Pareto efficient. Extending this concept to production economics, a 100% Pareto–Koopmans efficiency is achieved if and only if no inputs or outputs of any decision-making unit (DMU) can be improved without worsening the other inputs or outputs. However, in most management and social science applications, the theoretically possible Pareto efficiency is unknown. Therefore, it is replaced by relative efficiency [38], which is fully efficient if and only if other DMUs cannot improve inputs or outputs without worsening some of its other inputs or outputs on the basis of empirically available evidence. In this case, measuring production efficiency is actually evaluating whether there is waste of input by comparing the minimum input with the actual input while the output is unchanged or evaluating whether there is an output shortage by comparing the actual output with the maximum output with the input unchanged.
- total-factor energy efficiency
- total-factor carbon emissions efficiency
- carbon neutral
- sustainable development
- input-output variables
1. Defining Energy Efficiency and Carbon Emissions Efficiency
1.1. The Origin of Energy Efficiency and Carbon Emissions Efficiency
1.2. Single-Factor Indicator of Energy Efficiency and Carbon Emissions Efficiency
1.2.1. Energy Intensity
Energy efficiency was first recorded in 1888 [4] and is known as the thermal economy of a machine [5]. Patterson [6] was the first to elaborate on energy efficiency in economic terms. He defined energy efficiency as the ratio of GDP to energy consumption, commonly referred to as energy productivity. Energy intensity, as the reciprocal of energy productivity, is widely used to measure energy efficiency [7], and is used by many international organizations and countries as a strictly binding target for carbon reduction [8][9].1.2.2. Carbon Intensity
Actual production and energy consumption will inevitably produce environmental pollution as a by-product of economic growth, of which CO1.1. The Origin of Energy Efficiency and Carbon Emissions Efficiency
1.2. Single-Factor Indicator of Energy Efficiency and Carbon Emissions Efficiency
1.2.1. Energy Intensity
1.2.2. Carbon Intensity
1.2.3. Inadequacy of Single-Factor Indicator
Since only a single-input factor is considered in addition to one output, energy intensity and carbon intensity are often referred to as single-factor indicators [15][16]. Although these indicators are easy to understand and convenient to measure [17][18], they do have some shortcomings. On the one hand, the measurement of intensity does not conform to the definition of efficiency in economics. Intensity has no comparison between the optimal and actual energy consumption or carbon emissions. Blindly reducing the intensity may cause economic development to deviate from the optimal state. On the other hand, intensity only focuses on the goal of realizing energy saving, carbon emissions reduction, and output growth but pays little attention to other factors, such as capital and labor and structural changes in production [19][20]. It also fails to reflect the change in technical efficiency [21]. Energy intensity may decrease due to labor substitution or organizational structure improvements rather than technological advancement in energy efficiency [22], and it reflects energy consumption rather than energy efficiency [23]. Carbon intensity separates the intrinsic connections between CO1.2.3. Inadequacy of Single-Factor Indicator
1.3. Total-Factor Indicator of Energy Efficiency and Carbon Emissions Efficiency
Through the previous analysis, it is not difficult to find that the definition of single-factor is inconsistent with economic theory, which is divorced from reality and not in line with the production process. In view of the deficiencies of single-factor indicators, total-factor indicators are more convincing in measuring energy saving and carbon emissions reductions. In measuring the efficiency of DMUs with multiple inputs and multiple outputs, Farrell extends the Pareto–Koopmans property to inputs and outputs, avoiding the necessity of resource prices or other weight assumptions and formal relations between inputs and outputs. This makes it possible to determine relative efficiency by taking the performance of other DMUs to evaluate the overall behavior of each DMU. The obtained result is known as Farrell efficiency [27], which can estimate the amount of input that can be saved or the amount of output that can be increased without worsening any input and output. With the assumption of equal access to inputs by all DMUs, Farrell efficiency is restricted to expressing technical efficiency. However, Farrell’s empirical work was limited to cases of a single output and failed to take into account other non-zero slack, which is an important source for mix inefficiencies in both inputs and outputs.1.3.1. Total-Factor Energy Efficiency
On the basis of Farrell efficiency, Charnes, Cooper, and Rhodes [28] further formalized the relative efficiency, made up for the shortcomings of Farrell’s work, and developed a dual pair of linear programming model data envelopment analysis (DEA) to identify the best-practice frontier and estimate relative efficiency. The production function is generally regarded as the basis for economics. By constructing the frontier with the possibility of multiple production functions, DEA closely relates to the theory of production economics. Compared with other methods for measuring relative efficiencies, DEA does not need to set a specific function form and strict assumptions and has less data constraints [29][30]. Therefore, since the initial study of Charnes, Cooper, and Rhodes, DEA has become widely accepted and rapidly applied in a number of fields, including the nonprofit, public, and private sectors. It is often used to estimate production efficiency and to examine the overall performance of operations and management. With more and more extensive application, in addition to deeper development of methodologies, DEA is also used to measure various efficiency values. As the catastrophic problems caused by man-made greenhouse gas emissions become more and more serious, reducing global energy consumption and CO1.3. Total-Factor Indicator of Energy Efficiency and Carbon Emissions Efficiency
Through the previous analysis, it is not difficult to find that the definition of single-factor is inconsistent with economic theory, which is divorced from reality and not in line with the production process. In view of the deficiencies of single-factor indicators, total-factor indicators are more convincing in measuring energy saving and carbon emissions reductions. In measuring the efficiency of DMUs with multiple inputs and multiple outputs, Farrell extends the Pareto–Koopmans property to inputs and outputs, avoiding the necessity of resource prices or other weight assumptions and formal relations between inputs and outputs. This makes it possible to determine relative efficiency by taking the performance of other DMUs to evaluate the overall behavior of each DMU. The obtained result is known as Farrell efficiency [61], which can estimate the amount of input that can be saved or the amount of output that can be increased without worsening any input and output. With the assumption of equal access to inputs by all DMUs, Farrell efficiency is restricted to expressing technical efficiency. However, Farrell’s empirical work was limited to cases of a single output and failed to take into account other non-zero slack, which is an important source for mix inefficiencies in both inputs and outputs.1.3.1. Total-Factor Energy Efficiency
On the basis of Farrell efficiency, Charnes, Cooper, and Rhodes [62] further formalized the relative efficiency, made up for the shortcomings of Farrell’s work, and developed a dual pair of linear programming model data envelopment analysis (DEA) to identify the best-practice frontier and estimate relative efficiency. The production function is generally regarded as the basis for economics. By constructing the frontier with the possibility of multiple production functions, DEA closely relates to the theory of production economics. Compared with other methods for measuring relative efficiencies, DEA does not need to set a specific function form and strict assumptions and has less data constraints [63,64]. Therefore, since the initial study of Charnes, Cooper, and Rhodes, DEA has become widely accepted and rapidly applied in a number of fields, including the nonprofit, public, and private sectors. It is often used to estimate production efficiency and to examine the overall performance of operations and management. With more and more extensive application, in addition to deeper development of methodologies, DEA is also used to measure various efficiency values. As the catastrophic problems caused by man-made greenhouse gas emissions become more and more serious, reducing global energy consumption and CO The target energy input is the minimum energy input under the best practice. Comparing the minimum energy input with the actual energy input, TFEE conforms to the definition of efficiency in economics. A higher TFEE implies less redundancy of energy and more efficiency in energy used. The difference between the actual input and the target input is the total adjustment, which is initially referred to as radial adjustment, conforming to Farrell efficiency, and later incorporates non-zero slacks to satisfy Pareto efficiency [33]. The total adjustments of energy input can be used to measure the inefficient proportion of actual energy consumption and measure the energy-saving target ratio (ESTR) [34]. The relation between TFEE and ESTR is as follows:
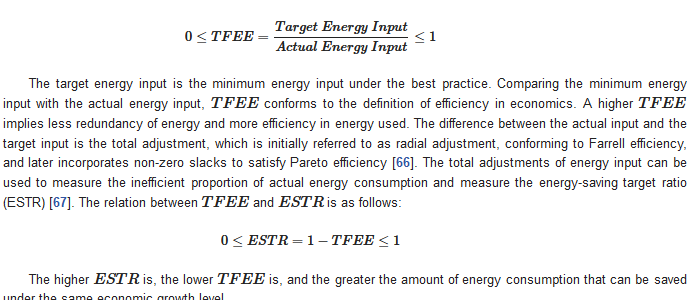
 The higher ESTR is, the lower is TFEE, and the greater the amount of energy consumption that can be saved under the same economic growth level.
1.3.2. Total-Factor Carbon Emissions Efficiency
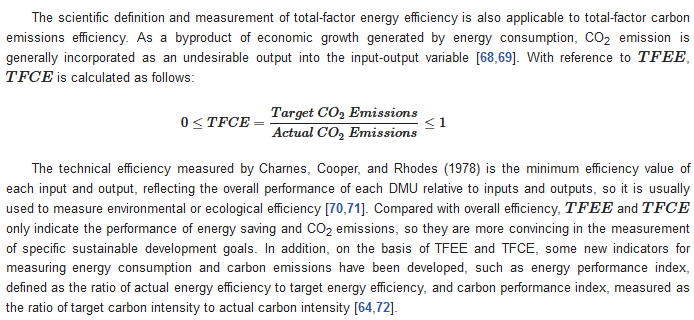
The scientific definition and measurement of total-factor energy efficiency is also applicable to total-factor carbon emissions efficiency. As a byproduct of economic growth generated by energy consumption, CO2 emission is generally incorporated as an undesirable output into the input-output variable [35][36]. With reference to TFEE, TFCE is calculated as follows:

The technical efficiency measured by Charnes, Cooper, and Rhodes (1978) is the minimum efficiency value of each input and output, reflecting the overall performance of each DMU relative to inputs and outputs, so it is usually used to measure environmental or ecological efficiency [37][38]. Compared with overall efficiency, TFEE and TFCE only indicate the performance of energy saving and CO2 emissions, so they are more convincing in the measurement of specific sustainable development goals. In addition, on the basis of TFEE and TFCE, some new indicators for measuring energy consumption and carbon emissions have been developed, such as energy performance index, defined as the ratio of actual energy efficiency to target energy efficiency, and carbon performance index, measured as the ratio of target carbon intensity to actual carbon intensity [30][39].
1.3.2. Total-Factor Carbon Emissions Efficiency
2. Efficiency Measurement Model Based on DEA
The concept and idea of data envelopment analysis (DEA) was first proposed by Farrell [27][61] and is a commonly used benchmark tool to measure the production efficiency of decision-making units (DMUs) and to reflect their performance. DEA is a method that is easy to operate. It does not need to make any restrictive assumptions about relevant functions and can deal with multiple input and output variables of different units.
2.1. Radial Model
2.1.1. CCR
2.1. Radial Model
2.1.1. CCR
In 1978, Charnes, Cooper, and Rhode [28][62] first proposed an input-oriented data envelopment analysis, which is based on Constant Return to Scale (CRS) in the intersection of mathematics, operational research, mathematical economics, and management science. Subsequently, this method has attracted widespread attention and application. An input-oriented CRS-DEA model can be expounded as follows:
In the
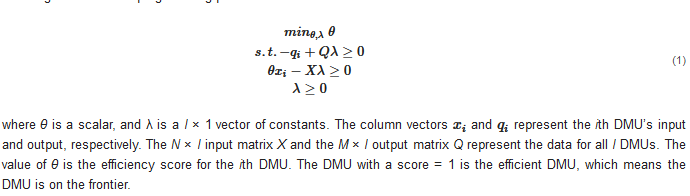
Acase of the production, technology was defined as . Suppose that theore are I DMUs, and each DMU has N inputs and M outputs. Measuring the efficiency of the ith DMU is to solve the following mathematical programming problem:

where θ is a scalar, and λ is a I × 1 vector of constants. The column vectors and represent the ith DMU’s input and output, respectively. The N × I input matrix X and the M × I output matrix Q represent the data for all I DMUs. The value of θ is the efficiency score for the ith DMU. The DMU with a score = 1 is the efficient DMU, which means the DMU is on the frontier.
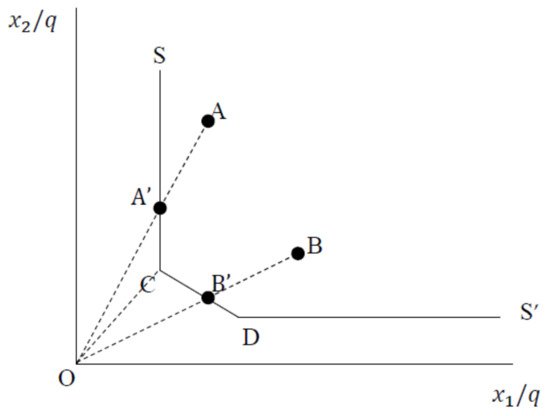
According to Figure 16, SS’ is a piece-wise linear isoquant determined by all the DMUs in the sample, where the radial contraction of the input vector is ( Xλ, Qλ), the radial adjustment is AA’, and the constraints in Equation (1) ensure that the projected point cannot lie outside the feasible set. There are four firms, A, B, C, and D, where firms using input combinations C and D are the two efficient firms that define the frontier, and firms A and B are inefficient firms. Based on the measure of technical efficiency, the efficiency of A and B can be represented as OA′/OA and OB′/OB, respectively. However, it is not certain if A′ is an efficient point because when the use of input x2 is reduced (that is, CA’), it still produces the same output. For firm B, it is effective when B moves to B′, as its input combinations change, i.e., efficiency equals one.
2.1.2. BCC
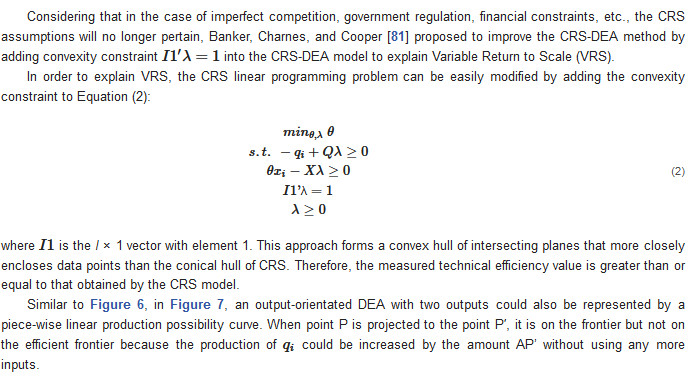
Considering that in the case of imperfect competition, government regulation, financial constraints, etc., the CRS assumptions will no longer pertain, Banker, Charnes, and Cooper [40] proposed to improve the CRS-DEA method by adding convexity constraint into the CRS-DEA model to explain Variable Return to Scale (VRS).
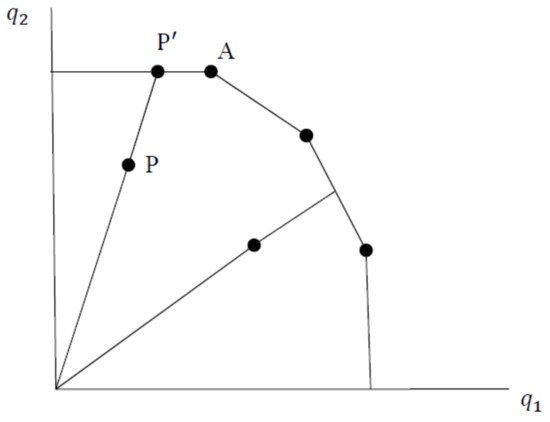
In order to explain VRS, the CRS linear programming problem can be easily modified by adding the convexity constraint to Equation (2): where is the I × 1 vector with element 1. This approach forms a convex hull of intersecting planes that more closely encloses data points than the conical hull of CRS. Therefore, the measured technical efficiency value is greater than or equal to that obtained by the CRS model.
Similar to
where is the I × 1 vector with element 1. This approach forms a convex hull of intersecting planes that more closely encloses data points than the conical hull of CRS. Therefore, the measured technical efficiency value is greater than or equal to that obtained by the CRS model.
Similar to 2.1.2. BCC
2.2. Non-Radial Model
2.2.1. Traditional Slacks-Based Measure (SBM) Model
In the traditional CRS/VRS-DEA model, the inefficient decision-making unit achieves the effective state by reducing all inputs or expanding all outputs in the same proportion. Therefore, the traditional DEA model is also referred to as a radial model. When the DMU is inefficient, there is a certain distance between the current state and the optimal target. In the radial model, this distance is equal to the sum of the radial improvement and the slack improvement, but the latter is not reflected in the efficiency measurement of the radial model. In this context, Tone (2001) [41] proposed a non-radial and non-angular Slacks-Based Measure model, which directly introduced the slack variable into the objective function. The SBM model can find the target energy input more effectively, avoid the influence and error caused by radial and angle differences, better reflect the essence of efficiency measurement, and improve the reliability and accuracy of efficiency measurement.2.2.2. Slacks-Based Measure (SBM) Model with Undesirable Output
Tone (2004) [42] constructed the SBM model by taking undesirable outputs into account. Therefore, compared with other DEA models, the SBM model with undesirable output can better reflect the essence of efficiency evaluation. Suppose that there are n DMUs, and each has m inputs , desirable outputs and undesirable outputs . The production possibility set was defined as . The specific model is expressed as follows:
where , and are all slacks. , when means the DMU is on the production frontier, which is completely efficient.
2.2. Non-Radial Model
2.2.1. Traditional Slacks-Based Measure (SBM) Model
2.2.2. Slacks-Based Measure (SBM) Model with Undesirable Output
Tone (2004) [87] constructed the SBM model by taking undesirable outputs into account. Therefore, compared with other DEA models, the SBM model with undesirable output can better reflect the essence of efficiency evaluation.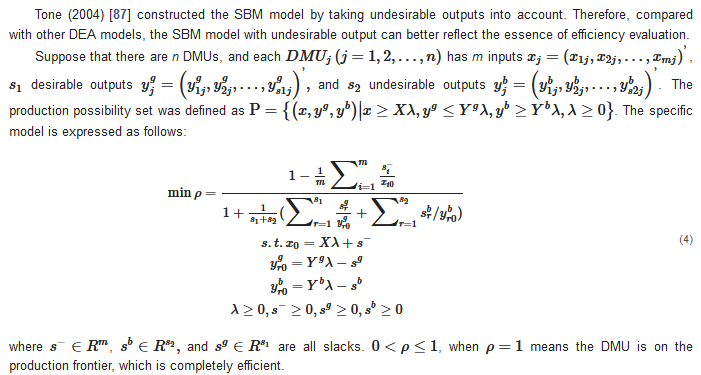
3. Input-Output Variables for Efficiency Measurement
The seemingly straightforward measurements have their underlying theoretical and empirical assumptions [43]. Efficiency can be defined and measured in various forms, and the results obtained can affect socio-economic development in different ways, such as placing an unfair burden of carbon reduction on consumers and isolating humans from the natural world. In efficiency measurement, social scientists call for more observation of complex social contexts and practices and the dissecting of efficiency from conceptual foundations, practical applications, and sociology [44][45][46]. This is mainly reflected in the selection of input and output variables of efficiency measurement.3.1. Production Possibility Set
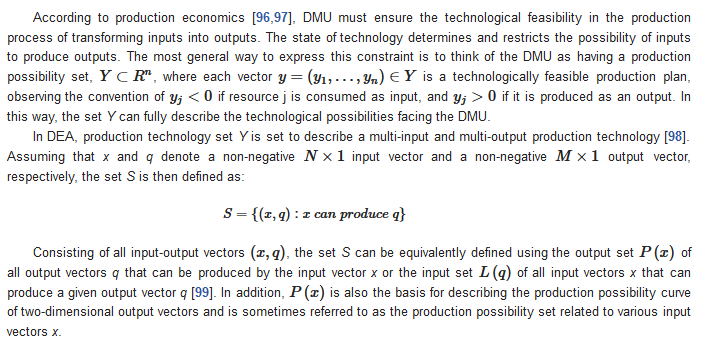
According to production economics [47][48], DMU must ensure the technological feasibility in the production process of transforming inputs into outputs. The state of technology determines and restricts the possibility of inputs to produce outputs. The most general way to express this constraint is to think of the DMU as having a production possibility set, , where each vector is a technologically feasible production plan, observing the convention of if resource j is consumed as input, and if it is produced as an output. In this way, the set Y can fully describe the technological possibilities facing the DMU.
In DEA, production technology set Y is set to describe a multi-input and multi-output production technology [49]. Assuming that x and q denote a non-negative input vector and a non-negative output vector, respectively, the set S is then defined as:

Consisting of all input-output vectors , the set S can be equivalently defined using the output set of all output vectors q that can be produced by the input vector x or the input set of all input vectors x that can produce a given output vector q [50]. In addition, is also the basis for describing the production possibility curve of two-dimensional output vectors and is sometimes referred to as the production possibility set related to various input vectors x.
3.2. Input-Output Variables Selection
As an improvement of single-factor energy efficiency, total-factor energy efficiency overcomes the one-sidedness of single-factor energy efficiency to a certain extent and takes into account the coordination and substitution of factors. However, in the existing literature, the selected input-output variables are repeated or omitted, and this does not conform to the theory of production economics and the actual production situation. In the current research on TFEE, the most commonly selected variables are capital, labor, and energy as input variables and value added as output variable [15][19][51]. Some scholars also chose the value of output as an output variable [52]. On this basis, some scholars consider the impact of the environment and add undesirable outputs into the output variable [53]. Some scholars have also considered other intermediate inputs [54]. However, these studies have a certain degree of repetition or omission in the selection of variables. The input-output variables of total-factor energy efficiency (TFEE) are also applicable to the measurement of total-factor carbon emissions efficiency (TFCE). Pang (2015) chose employment, capital stock, and energy use as inputs; GDP as desirable output; and CO3.1. Production Possibility Set