Your browser does not fully support modern features. Please upgrade for a smoother experience.
Please note this is a comparison between Version 2 by Paulina Tapia Quirós and Version 1 by Paulina Tapia Quirós.
The determination of polyphenols can be approached from two main perspectives: by liquid chromatography, which provides the polyphenolic profile, but also allows the quantification of target individual polyphenols, or by spectrophotometric or electrochemical assays, which provide an estimation of the total polyphenol content or the antioxidant capacity.
- Polyphenol
- Chromatographic Techniques
- Spectrophotometric
1. Chromatographic Techniques
High-performance liquid chromatography (HPLC) or ultra-high-performance liquid chromatography (UHPLC) is frequently used to analyze polyphenolic compounds. There are many studies of identification and quantification of polyphenols in olive oil [44,45,46,47,48,49,50,51,52,53,54] and wine by-products [30,55,56,57,58,59,60,61,62] by chromatographic techniques.
Commonly, separation is performed in the reverse phase mode, using C18 columns, and with gradient elution using mobile phases based on methanol:water or acetonitrile:water containing formic acid [63]. Different gradient programs are proposed, depending on the polyphenolic profile of the samples. The most frequently used detectors are ultraviolet (UV)-diode array (DAD) and mass spectrometry (MS) detectors, but fluorescence and electrochemical detectors are also applied. Figure 1 shows the HPLC-UV chromatogram of a wine lees extract.
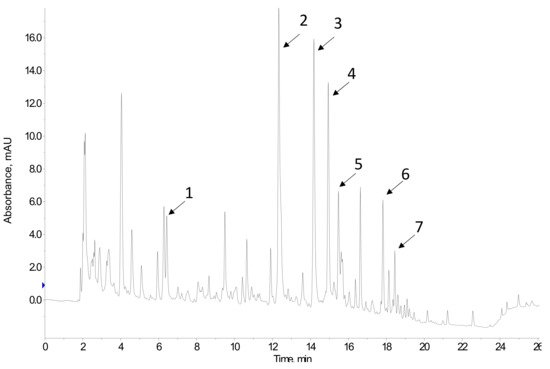
Figure 1. HPLC-UV chromatogram at 280 nm of a wine lees extract. Peak assignment: 1 Gallic acid; 2 catechin; 3 cis-coutaric acid; 4 trans-coutaric acid; 5 caffeic acid; 6 p-coumaric acid; 7 astilbin.
It is well known that MS allows the confirmation of the identity of the polyphenols. In this sense, high-resolution mass spectrometry (HRMS) is especially suited when dealing with complex samples, such as extracts from vegetal origin products. Thus, the HRMS spectrum and the retention time are used for confirmatory analysis [63,64]. It must be said that low-resolution MS/MS systems are also applicable. Both low- and high-resolution MS are suited for quantitative analysis, providing excellent selectivity as well as sensitivity, but it must be kept in mind that, to obtain reliable quantitative results, calibration should account for potential matrix effects, which are quite common in liquid chromatography LC-MS.
UV detection is simpler than MS detection, but the UV spectrum provides useful information which, combined with retention time, allows for tentative identification of compounds. As a matter of example, Fernandez et al. [54] identified luteolin, hydroxytyrosol, trans-ferulic acid, rutin hydrate, tyrosol, apigenin, and caffeic acid in olive pomace samples by HPLC-DAD-UV. Romero et al. [48], also using HPLC-DAD-UV, reported the presence of hydroxytyrosol-4-glucoside, hydroxytyrosol, dialdehydic form of decarboxymethyl elenolic acid linked to hydroxytyrosol (HyEDA), verbascoside, tyrosol, and salidroside in olive pomace samples. Moreover, Jurčević et al. [60] identified quercetin, ellagic acid, gallic acid, caffeic acid, p-coumaric acid, chlorogenic acid, and kaempferol in wine lees samples by HPLC-UV. If the chromatographic peaks are well resolved, UV detection can be used for quantitative analysis of target compounds [63]. HPLC-UV quantitative analysis is simpler than in the case of MS since there are no matrix effects.
A different approach is related to the analysis of total polyphenol content (TPC). It is also based on the use of UV detection. The chromatogram is acquired at a wavelength where polyphenols absorb (e.g., 280 nm or 320 nm), and the total area of the peaks eluting in the time window, where elution of polyphenols occurs, is calculated. This area is related to TPC, which is estimated using a calibration curve obtained with a standard (e.g., gallic acid). The TPC is expressed in terms of the equivalent concentration of the standard used in calibration [65].
2. Spectrophotometric Methods
The most widely applied method to determine the TPC in vegetal products is Folin-Ciocalteu (FC) [66]. There are also spectrophotometric assays to determine the antioxidant capacity or activity, which in samples of agri-food waste is largely due to the presence of phenolic compounds. The assays can be classified according to the mechanism of the chemical reaction involved in the method: hydrogen atom transfer (HAT) and single electron transfer (SET). In HAT assays the measure is related to the capability of antioxidants (e.g., phenolics) to scavenge free radicals by donating a hydrogen atom. SET assays measure the ability of antioxidants to transfer electrons to oxidized forms (metal ions, radicals, etc.). Some assays involve both HAT and SET mechanisms.
2.1. Folin-Ciocalteu Method
The FC method is a SET assay based on the reaction of phenolic compounds with the FC reagent in alkaline conditions. This reagent is a mixture of phosphomolybdate and phosphotungstate, yellow in color, which, when reduced by the phenolic groups, gives rise to an intense blue complex, with a broad absorption band in the 600–800 nm range. Diverse wavelengths in this range have been reported for the spectrophotometric analysis. The measured absorbance is proportional to the polyphenol content in the sample, which is usually quantified based on a calibration curve of gallic acid, and the results are expressed in terms of gallic acid equivalent (GAE) concentration. The assay is not specific for polyphenols, and other reducing compounds (e.g., carotenoids, vitamin E, vitamin C, reducing sugars, certain amino acids) interfere [13,67]. However, it is assumed that the reaction of the FC assay with agri-food products is mostly due to polyphenols, and therefore the FC index is a good estimation of polyphenols content for such samples, as evidenced by the correlations reported for FC results and those obtained by other techniques such as LC-UV [66,68].
There are different studies on the analysis of TPC by the FC method in residues of olive oil production. For instance, Elkacmi et al. [69] determined the TPC in olive mill wastewater, obtaining values of 2.1–6.43 g GAE L−1. For olive pomace, Alu’datt et al. [45] and Razek et al. [47] reported TPC values of 0.06–4.37 mg GAE g−1 dry weight (dw) and 69.66 mg GAE g−1 dw, respectively. There are also many studies for TPC determination in residues of wine production by the FC method, which is dependent on the extraction procedure used. As a matter of example, some values reported for TPC are 3.22 mg GAE g−1 dw in grape skin [55], 42.10–188.21 mg GAE g−1 wet weight (ww) [70], 50.96–219.23 mg GAE kg−1 dw [57], and 196.2 mg GAE g−1 dw [58] in grape pomaces, 63.46 mg GAE g−1 ww in grape steams [70], 188.21 mg GAE g−1 ww in grape seeds [70], and 26.1 g GAE g−1 dw [71], 9.84–23.17 mg GAE g−1 dw [60] in wine lees.
2.2. 2,2-Diphenyl-1-picrylhydrazyl (DPPH) Assay
The DPPH assay is a mixed-mode HAT/SET, used to determine the antioxidant capacity. DPPH is a free radical that has a deep purple color; it is one of the few stable organic radicals. The assay is based on the reaction of the DPPH radical with an antioxidant, e.g., phenolic compounds, which generates a reduced molecular form of the radical, and results in the loss of the purple color. Thus, the decrease in absorbance at 515 nm depends on the concentration of the antioxidant. Trolox is used as standard in calibration and the results of antioxidant capacity are expressed in terms of Trolox equivalent (TEAC) concentration [72,73,74,75]. Tournour et al. [76] evaluated the antioxidant capacity by DPPH in ethanol/water extracts and aqueous suspensions of grape pomaces from four different Portuguese grape varieties. The highest DPPH values were found in Touriga Nacional grape cultivar with 1.09 ± 0.13 and 1.12 ± 0.04 mmol TEAC g−1 dry residue, in ethanol/water extracts and aqueous suspensions, respectively.
2.3. 2,2′-Azino-bis(3-ethylbenzothiazoline-6-Sulfonic Acid) Assay
In this method, the 2,2′-azino-bis(3-ethylbenzothiazoline-6sulfonic) acid (ABTS) is used. Antioxidants reduce the cation radical (ABTS·+), throughout mixed-mode HAT/SET mechanisms, and a change of color occurs from a bluish-green solution to a decolorized one. The absorbance diminution at 743 nm depends on the concentration of antioxidants in the sample. Trolox is commonly used as a standard in calibration, and the ABTS results are expressed in terms of Trolox equivalent concentration [72,73,74,75,77]. Poveda et al. [70] applied the ABTS assay to the analysis of winery by-products, such as grape seeds, pomace, and stems. The highest antioxidant capacity values were found in grape seeds extracts (0.061–0.065 mmol Trolox g−1). Similarly, Abdel-Razek et al. [47] applied the ABTS assay to evaluate the antioxidant activity of olive oil production by-products (olive pomace, olive leaves, and pomace olive oil). The highest antioxidant capacity was observed in olive pomace samples.
2.4. Ferric Reducing Antioxidant Power (FRAP)
FRAP assay is a colorimetric method that measures the antioxidant capacity of a sample based on a redox reaction. The reaction involves a SET mechanism and consists of the reduction of ferric tripyridyl triazine complex to ferrous form at low pH (3.6), which has an intense blue color and can be monitored by measuring the change in absorption at 593 nm. The increase of absorption is related to the concentration of antioxidants in the sample. Trolox is used as standard and results are expressed in Trolox equivalent concentration [72,75,77]. Jurčević et al. [60] evaluated the potential of wine lees polyphenols as novel functional bioactive compounds in the protection against oxidative stress and hyperlipidemia. The antioxidant capacity of wine lees determined by FRAP was 45.7 ± 1.05 mM of Trolox equivalents per 100 g, respectively.
2.5. Oxygen Radical Absorbance Capacity (ORAC)
The ORAC method is a HAT assay used to determine antioxidant activity. It is based on the quenching of the fluorescence of fluorescein by peroxyl radicals. In the presence of antioxidants, which react with peroxyl radical, the decrease in the fluorescence signal is slowed down. The fluorescence decay over time is recorded, and the area under the curve is related to the antioxidant capacity. Trolox is habitually used as the standard in calibration, and results are reported as Trolox equivalent concentration [72,73,77]. Antoniolli et al. [58] determined the antioxidant capacity by ORAC of grape pomace extracts of cv. Malbec, and reported 2756 µmol TEAC g−1. Pasten et al. [78] analyzed the antioxidant activity of Arbequina olive residues. The antioxidant capacity of fresh samples was 66.81, 101.75, and 283.5 µmol TEAC g−1 dw, for DPPH, FRAP, and ORAC, respectively.
It is not evident what is the equivalence of the results provided by the different assays. It is not just a question of the units used to express the results; quite often, there is not a clear correlation between the results from different assays. However, as a general trend, when comparing results from different samples measured by several assays, samples having high results in one assay usually show high values in the others (See Figure 2).
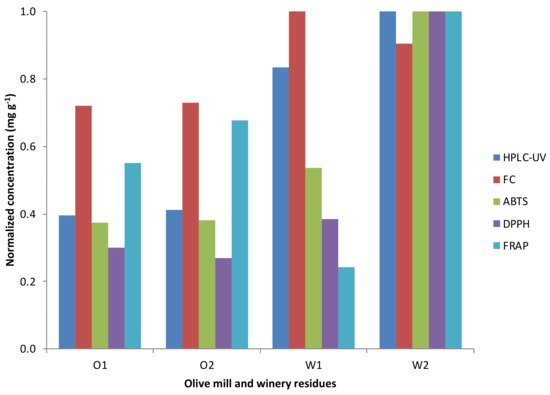
Figure 2. Normalized results of the spectrophotometric assays and HPLC-UV technique from the olive mill (O1 and O2) and winery residues (W1 and W2).
Finally, it should be mentioned that, although less applied than spectrophotometric assays, electrochemical assays can also be used to determine the antioxidant capacity of samples, with cyclic voltammetry, differential pulse voltammetry, and square wave voltammetry being the most widely used techniques [79]. In this sense, electrochemical detection combined with molecularly imprinted polymers (MIPs) is an innovative approach for the quick detection of antioxidants [80].