Lung cancer accounts for approximately 18.4% of the total cancer-related deaths, the highest of all cancer types. The prognosis of lung cancer is relatively unfavorable compared to that of other malignancies, and as a prognosis largely depends on the stage of onset, thus, the early diagnosis of lung cancer is very important. Pulmonary tuberculosis (TB) is a known risk factor for lung cancer.
- pulmonary tuberculosis
- lung cancer
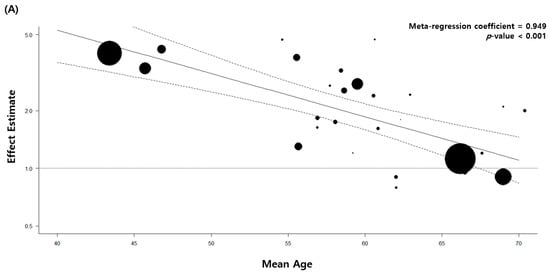
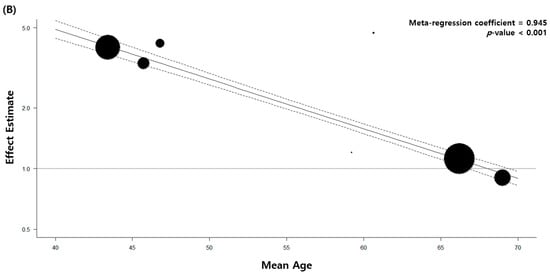
- meta regression
- burden of tuberculosis
1. Introduction
Chronic inflammation resulting in pathological changes is a major risk factor in carcinogenesis. Inflammation is known to play a key role in carcinogenesis, such as infection with hepatitis B and C viruses in hepatocellular carcinoma, Helicobacter pylori in gastric cancer, and human papilloma virus in gynecological cancers [1][7]. Several meta-analyses have shown that previous inflammatory diseases in the lungs, such as pneumonia, chronic bronchitis, and pulmonary tuberculosis (TB), may increase the risk of lung cancer (relative risk ratio 1.36–1.90), independent of cigarette smoking [2][3][8,9]. According to forty-nine studies, pulmonary and extra-pulmonary TB infections increase the risk of 10 cancer types, including head and neck cancer, leukemia, lymphoma, gastrointestinal cancer, kidney cancer, bladder cancer, and lung cancer [4][10]. Thus, TB infection may influence the pathogenesis of lung cancer with or without cigarette smoking. To prevent the emergence of airborne transmittable TB and its progression to cancer, the control and prevention of TB is very important.
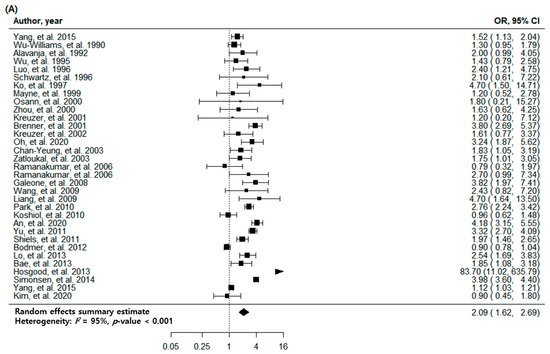
2. Pulmonary TB and Risk of Lung Cancer with All Eligible Studies
| Subgroup | No. of Cohorts * | OR (95% CI) | p | -Value | I2 | Value (%) | p | -Value | I2 | between Subgroups (%) |
|---|---|---|---|---|---|---|---|---|---|---|
| I | 2 | Value (%) | I | 2 | between Subgroups (%) |
|||||
| All cohorts | 33 | 2.09 (1.62–2.69) | <0.001 | 95 |
| Study | Selection | Comparability | Outcome | Quality Score | |||||
|---|---|---|---|---|---|---|---|---|---|
| Adequacy of Case Definition | Degree of Representation of Cases | Selection of Controls | Definition of Controls | Comparability of Cases and Controls on the Basis of Design or Analysis | |||||
| Selection | Comparability | Outcome | Quality Score | ||||||||||||||||||||||
|---|---|---|---|---|---|---|---|---|---|---|---|---|---|---|---|---|---|---|---|---|---|---|---|---|---|
| Confirmation of Exposure | Same Method of Confirmation for Cases and Controls | Non-Response Rate | |||||||||||||||||||||||
| Study | Degree of Representation of the Exposed Cohort | Selection of the Non-Exposed Cohort | Confirmation of Exposure | ||||||||||||||||||||||
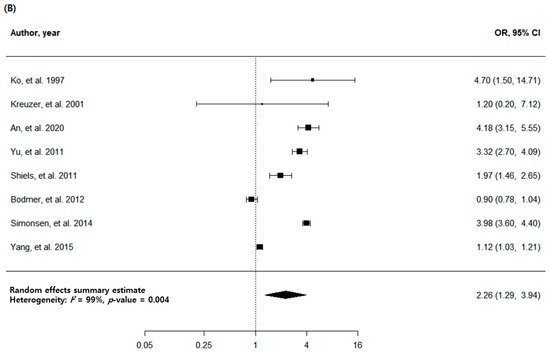
| All studies | 8 | 2.26 (1.29–3.94) | 0.004 | 99 | |||||||||||||||||||||
| Demonstration That the Current Outcome of Interest Is Absent at the Start of the Study | |||||||||||||||||||||||||
| Comparability of Cohorts Based on Design or Analysis | Assessment of Outcome | Sufficiency of Follow-Up to Detect Outcomes | Adequacy of Follow-Up of Cohorts | ||||||||||||||||||||||
| An et al. 2020 [5] | An et al. 2020 [20] | * | |||||||||||||||||||||||
| Kim et al. 2020 [ | * | * | * | 31 | ** | * | * | ] | Kim et al. 2020 [19] | * | * | * | ** | ** | 9 | * | |||||||||
| TB burden of country | |||||||||||||||||||||||||
| 7 | Country of TB burden | ||||||||||||||||||||||||
| Oh et al. 2020 | [32 | ||||||||||||||||||||||||
| Yang et al. 2015 [6] | Yang et al. 2015 [22] | ] | Oh et al. 2020 [21] | * | ** | ** | * | ** | * | * | 8 | * | ** | * | * | * | 8 | Low | 18 | 1.77 (1.22–2.56) | 0.003 | 97 | 12 | ||
| Low | |||||||||||||||||||||||||
| Yang et al. 2015 [7] | Yang et al. 2015 [ | 7 | 23 | 2.04 (1.12–3.73) | 0.020 | ] | |||||||||||||||||||
| Simonsen et al. 2014 [33 | 99 | 78 | |||||||||||||||||||||||
| ] | * | * | * | * | * | * | * | Simonsen et al. 2014 [ | * | 24] | * | * | * | * | * | * | * | * | 8 | Medium | 6 | 2.48 (1.71–3.58) | <0.001 | 75 | |
| 8 | Medium | 1 | |||||||||||||||||||||||
| Hosgood et al. 2013 | 4.18 (3.15–5.55) | [ | <0.001 | - | |||||||||||||||||||||
| 8] | Hosgood et al. 2013 [25] | * | * | * | * | ||||||||||||||||||||
| Bae et al. 2013 [34 | * | ] | Bae et al. 2013 [26 | * | * | 7 | ] | * | * | * | ** | * | * | 7 | High | 9 | 2.57 (1.68–3.93) | <0.001 | 81 | ||||||
| High | 0 | ||||||||||||||||||||||||
| Shiels et al. 2011 [35] | Shiels et al. 2011 [29] | - | * | * | * | Region of country | |||||||||||||||||||
| East Asia and Pacific | 19 | 2.49 (1.83–3.39) | <0.001 | 93 | 58 | ||||||||||||||||||||
| - | - | ||||||||||||||||||||||||
| Lo et al. 2013 [9] | Lo et al. 2013 [27] | * | * | * | * | *** | *** | * | 8 | * | * | * | 9 | Region of country | |||||||||||
| Bodmer et al. 2012 [10] | Bodmer et al. 2012 [28] | * | * | * | * | ** | |||||||||||||||||||
| Yu et al. 2011 [36] | Yu et al. 2011 [30 | * | ] | * | * | * | * | * | * | * | * | 9 | * | 7 | East Asia and Pacific | 4 | 2.79 (1.21–6.39) | ||||||||
| Koshiol et al. 2010 [11] | Koshiol et al. 2010 [31 | 0.016 | ] | 98 | 0 | Europe and Central Asia | |||||||||||||||||||
| * | * | * | * | ** | * | * | 8 | 7 | Europe and Central Asia | 1.60 (0.80–3.22) | 0.185 | 4 | |||||||||||||
| Park et al. 2010 [12] | Park et al. 2010 [32 | 98 | |||||||||||||||||||||||
| 1.79 (0.67–4.77) | ] | 0.244 | 99 | North America | |||||||||||||||||||||
| * | 7 | North America | 0 | - | - | - | |||||||||||||||||||
Abbreviations: CI, confidence interval; No, Number; OR, odds ratio; TB, tuberculosis.
4. Stratified and Sensitivity Analysis
| * | |||||||||||||||||||||||
| * | |||||||||||||||||||||||
| * | |||||||||||||||||||||||
| ** | |||||||||||||||||||||||
| * | 7 | ||||||||||||||||||||||
| 1.53 (1.11–2.12) | 0.010 | 0 | |||||||||||||||||||||
| Liang et al. 2009 [13] | Liang et al. 2009 [33] | * | * | * | * | ** | * | * | 8 | Economic status of country | |||||||||||||
| Wang et al. 2009 [14] | Wang et al. 2009 [34] | * | * | * | * | * | * | * | 7 | High-income | 24 | 1.91 (1.41–2.59) | <0.001 | ||||||||||
| Galeone et al. 2008 | 96 | [15] | Galeone et al. 2008 [35] | * | 20 | ||||||||||||||||||
| * | * | * | ** | * | * | 8 | Upper-middle-income | 9 | 2.57 (1.68–3.93) | ||||||||||||||
| Ramanakumar et al. 2006 | <0.001 | [16] | Ramanakumar et al. 2006 [36] | a | 81 | ||||||||||||||||||
| * | * | * | * | ** | * | * | Age | ||||||||||||||||
| 8 | |||||||||||||||||||||||
| Ramanakumar et al. 2006 [16] | Ramanakumar et al. 2006 [36] | b | * | * | * | * | ** | * | * | 8 | Adjusted | 29 | 2.00 (1.54–2.61) | <0.001 | 95 | 14 | |||||||
| Zatloukal et al. 2003 [17] | Zatloukal et al. 2003 [37] | * | * | * | * | ** | * | * | 8 | Not adjusted | 4 | 3.84 (1.21–12.15) | 0.022 | 82 | |||||||||
| Chan-Yeung et al. 2003 [18] | Chan-Yeung et al. 2003 [38] | * | * | * | * | * | * | 7 | Sex | ||||||||||||||
| * | |||||||||||||||||||||||
| Kreuzer et al. 2002 [19] | Kreuzer et al. 2002 [39] | * | * | * | * | * | * | * | 7 | Adjusted | |||||||||||||
| Brenner et al. 2001 [20] | 22 | 2.23 (1.60–3.11) | <0.001 | Brenner et al. 2001 [40 | 96 | ] | * | * | 0 | ||||||||||||||
| * | * | ** | * | * | 8 | Not adjusted | 11 | 1.90 (1.47–2.46) | <0.001 | 61 | |||||||||||||
| Kreuzer et al. 2001 [21] | Kreuzer et al. 2001 [41] | * | * | * | * | * | * | * | * | 8 | Smoking | ||||||||||||
| Zhou et al. 2000 [22] | Zhou et al. 2000 [42] | * | * | * | * | * | * | * | 7 | Adjusted | 22 | 2.03 (1.51–2.73) | <0.001 | 90 | 0 | ||||||||
| Osann et al. 2000 [23] | Osann et al. 2000 [43] | * | * | * | * | ** | * | * | 8 | Not adjusted | 11 | 2.19 (1.34–3.59) | 0.002 | 98 | |||||||||
| Mayne et al. 1999 [24] | Mayne et al. 1999 [44] | * | * | * | * | * | * | * | 7 | Hypertension | |||||||||||||
| Ko et al. 1997 [25] | Ko et al. 1997 [45] | * | * | * | * | * | * | * | 7 | Adjusted | 2 | 1.92 (0.66–5.57) | |||||||||||
| Schwartz et al. 1996 [26 | 0.230 | 99 | 0 | ||||||||||||||||||||
| ] | Schwartz et al. 1996 [46] | * | * | * | * | ** | * | * | 8 | Not adjusted | 31 | 2.10 (1.62–2.73) | <0.001 | ||||||||||
| Luo et al. 1996 [27 | 92 | ||||||||||||||||||||||
| ] | Luo et al. 1996 [47] | * | * | * | * | * | * | * | Diabetes | ||||||||||||||
| 7 | |||||||||||||||||||||||
| Wu et al. 1995 [28] | Wu et al. 1995 [48] | * | * | * | * | ** | * | * | 8 | Adjusted | |||||||||||||
| Alavanja et al. 1992 | 2 | 1.72 (0.48–6.20) | 0.404 | [ | 99 | 29] | 0 | ||||||||||||||||
| Alavanja et al. 1992 [49] | * | * | * | * | ** | * | * | 8 | Not adjusted | 31 | 2.13 (1.63–2.77) | <0.001 | Wu-Williams et al. 1990 | 94 | |||||||||
| [30] | Wu-Williams et al. 1990 [50] | * | * | * | * | ** | * | * | 8 | Respiratory comorbidities | |||||||||||||
| Adjusted | 8 | 1.32 (0.93–1.86) | 0.121 | 94 | 90 | ||||||||||||||||||
| Not adjusted | 25 | 2.51 (2.04–3.08) | <0.001 | 78 | |||||||||||||||||||
| Cohort of the study | |||||||||||||||||||||||
| Population-based | 23 | 1.95 (1.41–2.68) | <0.001 | 96 | 0 | ||||||||||||||||||
| Hospital-based | 10 | 2.36 (1.85–3.01) | <0.001 | 49 | |||||||||||||||||||
| Study design | |||||||||||||||||||||||
| Prospective cohort study | 4 | 1.96 (1.22–3.15) | 0.005 | 84 | 94 | ||||||||||||||||||
| Retrospective cohort study | 2 | 3.95 (3.58–4.36) | <0.001 | 0 | |||||||||||||||||||
| Case-control study | 27 | 1.99 (1.56–2.53) | <0.001 | 89 | |||||||||||||||||||
| Diagnostic method | of pulmonary TB | ||||||||||||||||||||||
| Medical record | 8 | 2.26 (1.29–3.94) | 0.004 | 99 | 0 | ||||||||||||||||||
| Imaging | 3 | 2.13 (1.16–3.92) | 0.015 | 80 | |||||||||||||||||||
| Self-report or physical examination |
22 | 1.96 (1.56–2.47) | <0.001 | 66 | |||||||||||||||||||
* Since two separate cohorts were reported in one article, a total of 33 eligible cohorts were extracted and analyzed from 32 enrolled studies. Abbreviations: CI, confidence interval; No, Number; OR, odds ratio; TB, tuberculosis.
3. Pulmonary TB and Risk of Lung Cancer with High-Quality Studies
| Subgroup | No. of Studies | OR (95% CI) |
|---|
IA study can be awarded a maximum of one star for each numbered item within the Selection and Outcome categories. A maximum of two stars can be given for Comparability.