Your browser does not fully support modern features. Please upgrade for a smoother experience.
Please note this is a comparison between Version 2 by Amina Yu and Version 1 by Alexander Fedotov.
Hyperspectral remote sensing provides image data with very high spectral resolution. This high resolution allows subtle differences in plant health to be recognized. Such a multidimensional data space, generated by hyperspectral sensors, has given rise to new approaches and methods for analyzing hyperspectral data.
- remote sensing
- hyperspectral
- plant diseases
- early detection
- oil palm
- citrus
- cereals
- solanaceae
1. Introduction
The spread of various, including invasive, plant diseases and pests is one of the most important problems in modern agriculture [1]. Therefore, to solve these relevant problems, the timely monitoring of plant diseases and pests is necessary. Remote sensing methods hold great promise for solving these problems [2]. Remote sensing data can identify crop conditions, including diseases, and provide useful information for specific agricultural management practices [3,4][3][4].
There are two types of remote sensing technologies: passive (such as optical) and active remote sensing (such as LiDAR and radar). Passive optical remote sensing is usually divided into two groups based on the spectral resolution of the sensors used: multispectral and hyperspectral remote sensing [5]. Hyperspectral sensing shows great potential as a non-invasive and non-destructive tool for monitoring biotic and abiotic plant stress among passive remote sensing methods, which measure reflected solar radiation [6]. This method collects and stores information from the spectroscopy of an object in a spectral cube that contains spatial information and hundreds of contiguous wavelengths in the third dimension. Hyperspectral imaging offers many opportunities for the early recognition of plant diseases by providing preliminary indicators through subtle changes in spectral reflectance due to absorption or reflection. Hyperspectral images with hundreds of spectral bands can provide detailed spectral portraits, hence, they are better able to detect subtle variations in soil, canopies or individual leaves. Thus, hyperspectral images can be used to solve a wider class of problems for the accurate and timely determination of the physiological status of agricultural crops. The early identification of disease spread and pest outbreaks may avoid not only significant crop loss, but also reduce pesticides usage and mitigate their negative impacts on human health and the environment, thus, improving the existing IPM [7,8][7][8].
In recent years, a wide range of miniature hyperspectral sensors available for commercial use have been developed, such as Micro- and Nano-Hyperspec (Headwall Photonics Inc., Boston, MA, USA), HySpex VNIR (HySpex, Skedsmo, Skjetten, Norway) and FireflEYE (Cubert GmbH, Ulm, Germany) [9]. These sensors can be installed on manned or unmanned airborne platforms (for example, airplanes, helicopters, and UAVs) to obtain hyperspectral imaging and support various monitoring missions [10,11][10][11].
There are various types of hyperspectral cameras, e.g., push-broom cameras, whisk-broom cameras and snapshot cameras. The measurement principle of each sensor type depends on its ability to obtain the whole picture (snapshot) at one time, one line of the picture (push broom) or one point of the picture (whisk broom) [12].
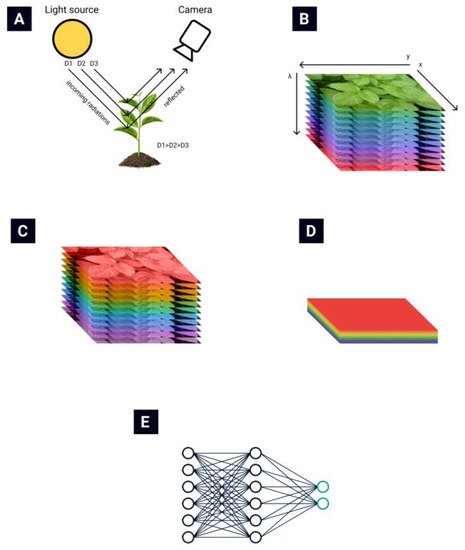
The general routine of collecting and processing hyperspectral images is presented in Figure 1. The light reflected from plant leaves is collected by the hyperspectral camera (Figure 1A) [13]. A hyperspectral data cube (Figure 1B) is obtained from the hyperspectral camera. Then various data normalization (Figure 1C) and feature extraction (Figure 1D) algorithms are applied to reduce the data’s dimensionality. Finally, different automatization techniques are used to automate the classification process (Figure 1E).
Hyperspectral remote sensing provides image data with very high spectral resolution [16,17][16][17]. This high resolution allows subtle differences in plant health to be recognized. Such a multidimensional data space, generated by hyperspectral sensors, has given rise to new approaches and methods for analyzing hyperspectral data [18,19][18][19].
For a long time, feature extraction methods have been used that reduce the data dimension without loss (or with minimal loss) of the original information on which the classification of hyperspectral images is based [20]. One of the most widely used dimensionality reduction techniques in HRS is principal component analysis (PCA). PCA computes orthogonal projections that maximize data variance and outputs the dataset in a new, uncorrelated coordinate system. Unfortunately, the informational content of hyperspectral images does not always coincide with such projections [21]. Thus, other methods are also used for feature extraction. The common methods for extracting hyperspectral data used in pathological research traditionally include PCA [22], derivative analysis [23], wavelet methods and correlation plots [24]. Alternatively, the hyperspectral image data can be processed at the image level to extract either spatial representation alone or joint spatial spectral information. If only spatial features are considered, for example, when studying structural and morphological features, spatial patterns among neighboring pixels with relation to the current pixel in the hyperspectral image will be extracted. Machine vision techniques, such as using a two-dimensional CNN, with a p × p chunk of input pixel data have been implemented to automatically generate high-level spatial structures. Extraction of spatial characteristics, in tandem with spectral elements, has been shown to significantly improve model performance. [25]. The use of spatial spectral characteristics can be achieved using two approaches: (i) by separately extracting spatial characteristics using CNN [26,27][26][27] and combining data from a spectral extractor using RNN, or LSTM [27,28][27][28]; and (ii) by using three-dimensional patterns in hyperspectral data cubes (p × p × b) associated with p × p spatially adjacent pixels and b spectral bands to take full advantage of important distinctive patterns.
2. Hyperspectral Remote Sensing for Early Plant Disease Detection
It was believed that, due to the lack of interaction between specialists in engineering and biology, there is a significant gap in the scientific basis for planning an experiment to use remote sensing data in determining plant state. Although the review above demonstrates the practical possibility of late and early detection of plant diseases using HRS, it also reveals differences in the technical results (range of important bands) between researchers, which indicates an insufficient study of the experimental methodology, as can be seen from Table 1, Table 2, Table 3 and Table 4.Table 1. Oil palm disease early detection by HRS.
| Publication Year | Culture | Treat | Equipment | Studied Bands | Important Bands | Study Type | Reference | Location |
|---|---|---|---|---|---|---|---|---|
| ] | ||||||||
| Malaysia | ||||||||
Table 2. Citrus disease early detection by HRS.
| Publication Year | Culture | Treat | Equipment | Studied Bands | Important Bands |
|---|
Table 3. Solanaceae disease early detection by HRS.
| Publication Year | Culture | Treat | Equipment | Studied Bands | Important Bands | Study Type | Reference | Location |
|---|
Table 4. Wheat disease early detection by HRS.
| Publication Year | Culture | Treat | EquipmentStudy Type | Reference | Studied Bands | Important Bands | Study TypeLocation | ||||||||||||
|---|---|---|---|---|---|---|---|---|---|---|---|---|---|---|---|---|---|---|---|
| Reference | Location | ||||||||||||||||||
| 2009 | oil palm | basal stem rot | APOGEE spectroradiometer of unmentioned model | 450–1100 | 715, 734, 791 | field | [29] | Malaysia | |||||||||||
| citrus greening | Spectra Vista SVC HR-1024 spectrometer | ||||||||||||||||||
| 2003 | tomato | late blight | Megatech GER-2600 spectrometer | 400–2500 | 750–930, 950–1030, 1040–1130 | field | [53] | USA | |||||||||||
| 2014 | |||||||||||||||||||
| 2000 | wheat | fusarium350–2500 | Specim Imspector V9 spectrometer combined with camera | 425–860 | not mentioned | lab | [ | 2009 | oil palm | tobacco | TSWV | Ocean Optics USB2000 spectrometer | 450–850 | 475.22, 489.37, 524.29, 539.65, 552.82, 667.33, 703.56, 719.31, 724.31, 758.39 | greenhouse | [54] | 500–533, 560–675, 682–733 | lab and field | [Bulgaria |
| 76 | ] | Germany | 2015 | tomato | late blight, early blight | ||||||||||||||
| 2015 | wheatSpecim Imspector V10E spectrograph combined with camera | 400–1000 | 442, 508, 573, 696, 715 | lab | fusarium | Headwall Photonics Hyperspec Model 1003B-10151 spectrometer combined with a camera[ | 520–1785 | 141155 | lab] | [77China | ] | lab | [49] | China | |||||
| Brazil | 2017 | tomato | gray mold | Specim Imspector V10E spectrograph combined with camera | |||||||||||||||
| 2018 | wheat | fusarium | Specim Imspector V10E and ImSpector N25E spectrographs380–1023 | 655, 746, 759–761 | lab | [ | 400–1000, 1000–250056] | 430–525, 560–710, 1115–2500 | greenhouse | [78]China | [79] | Germany | 2019 | citrus | citrus greening | Cubert S185 camera and ASD HandHeld 2 spectrometer | |||
| 2017 | tomato | 400–1000 | 544, 718, 753, 760, 764, 930, 938, 943, 951, 969, 985, 998, 999 | yellow leaf curl | Specim Imspector V10E spectrograph combined with camera | 450–1000field | [50] | China | |||||||||||
| 560–575, 712–729, 750–950 | lab | [ | |||||||||||||||||
| 2018 | wheat | fusarium, yellow rust | Gilden Photonics camera | 400–1000 | 650–70057] | China | lab, field | [80][81] | UK | 2020 | citrus | citrus greening | Cubert S185 camera & ASD HandHeld 2 spectrometer | 450–950, 325–1075 | 468, 504, 512, 516, 528, 536, 632, 680, 688, 852 | field | [51] | China | |
| 2017 | tobacco | TMV | Specim Imspector V10E spectrograph combined with camera | 450–1000 | 697.44, 639.04, 938.22, 719.15, 749.90, 874.91, 459.58, 971.78 | lab, greenhouse | [58][59] | 2020 | citrus | citrus greening | ASD HandHeld 2 spectrometer | 370–1000 | not mentioned | field | [52] | China |
| China | ||||||||||||||||||||||||||
| 2018 | ||||||||||||||||||||||||||
| tomato | late blight, target and bacterial spot | Spectra Vista SVC HR-1024 spectrometer | 350–2500 | 445, 450, 690, 707, 750, 800, 1070, 1200 | lab | [60] | USA | |||||||||||||||||||
| 2018 | tomato | TSWV | Specim Imspector V10E spectrograph combined with camera | 400–1000 | ||||||||||||||||||||||
| oil palm | orange spotting | ASD HandHeld 2 spectrometer | ||||||||||||||||||||||||
| 2012 | citrus | 537, 612, 638, 662, 688, 713, 763, 813, 998, 1066, 1120, 1148, 1296, 1445, 1472, 1546, 1597, 1622, 1746, 1898, 2121, 2172, 2348, 2471, 2493 | field | [44][45][46] | USA | basal stem rot | APOGEE spectroradiometer of unmentioned model | 300–1000 | ||||||||||||||||||
| 2012 | citrus (orange) | 462, 487, 610.5, 738, 749 | field | [30] | citrus greeningMalaysia | |||||||||||||||||||||
| Spectra Vista SVC HR-1024 spectrometer & Varian Cary 500 Scan | 457–921 | 650–850 | field and lab | [47] | USA | 2010 | oil palm | basal stem rot | PP Systems Unispec-SC spectrometer | |||||||||||||||||
| 2012 | 310–1130 | 670–715, 490–520, 730–770, 920–970 | field | [31][32] | Indonesia | citrus (orange) | citrus greening | Specim Aisa Eagle camera | 457–921 | 410–432, 440–509, 634–686, 734–927, 932, 951, 975, 980 | field | [48] | USA | 2011 | oil palm | basal stem rot | APOGEE spectroradiometer of unmentioned model | 350–1000 | 495, 495.5, 496, 651.5, 652, 652.5, 653, 653.5, 654, 654.5, 655, 655.5, 656, 656.5, 657, 657.5, 658, 658.5, 659, 659.5, 660, 660.5, 661, 908 | field | [33] | |||||
| 2018 | citrus | citrus greening | Malaysia | |||||||||||||||||||||||
| Specim Imspector V10E spectrograph combined with camera | 379–1023 | 493, 515, 665, 716, 739 | 2014 | oil palm | basal stem rot | ASD spectrometer of unmentioned model | 325–1040 | not mentioned | field | [34] | Malaysia | |||||||||||||||
| 2017 | oil palm | basal stem rot | APOGEE spectroradiometer of unmentioned model | 325–1000 | 495, 495.5, 496, 651.5, 652, 652.5, 653, 653.5, 654, 654.5, 655, 655.5, 656, 656.5, 657, 657.5, 658, 658.5, 659, 659.5, 660, 660.5, 661, 908 | field | [35] | Malaysia | ||||||||||||||||||
| 2019 | wheat | fusarium | ASD FieldSpec Pro spectrometer | 350–2500 | 471, 696, 841, 963, 1069, 2272 | field | [82] | China | 2017 | oil palm | basal stem rot | |||||||||||||||
| 2019 | wheatGER 1500 spectrometer | 273–1100 | 540–560, 650–780 | fusarium | Surface optics SOC710VP camerafield | 400–1000[ | 447, 539, 668, 67336 | field] | [83Malaysia | |||||||||||||||||
| ] | China | 2018 | oil palm | basal stem rot | Specim spectrograph of unmentioned model | 350–1000 | 650–750 | 700–1000field | [ | |||||||||||||||||
| 2020 | wheat | fusarium | 37 | Surface optics SOC710VP camera] | Malaysia | |||||||||||||||||||||
| 400–1000 | 560, 565, 570, 661, 663, 678 | lab | [61] | Israel | field | [84] | China | 2020 | oil palm | basal stem rot | Cubert S185 camera | 325–1075 | 800–950 | greenhouse | [38 | |||||||||||
| 2018 | potato | PVY | ASD FieldSpec 4 spectrometer | 350–2500 | 500–900, 720–1300 | field | ||||||||||||||||||||
| 2020 | wheat | fusarium | ASD FieldSpec Pro spectrometer | 350–2500] | [62Malaysia | |||||||||||||||||||||
| 350–400, 500–600, 720–1000 | ] | USA | field | [24] | China | 2014 | oil palm | orange spotting | ASD FieldSpec 4 spectrometer | 300–1050 | 400–401, 404–405, 455–499, 500–599, 600–699, 700–712 | field | [39][40] | Malaysia | ||||||||||||
| 2019 | tomato | late blight, blackleg | StellarNet Blue Wave spectrometer | 400–1000 | not mentioned | |||||||||||||||||||||
| 2007 | greenhouse, field | wheat | [ | 63] | UK | yellow rust | ASD FieldSpec Pro spectrometer | 350–2500 | not mentioned | field | [85] | China | 2019 | 400–1050 | 601–630 | field | [41] | |||||||||
| 2019 | Malaysia | |||||||||||||||||||||||||
| tobacco | TSWV | Surface optics SOC710VP camera | 400–1000 | 780–1000 | ||||||||||||||||||||||
| 2012 | lab | wheat | [ | 64] | China | yellow rust | ASD FieldSpec Pro spectrometer | 350–2500 | not mentioned | field | [86] | China | 2019 | oil palm | orange spotting | ASD HandHeld 2 spectrometer | 325–1075 | 680–780 | field | |||||||
| 2019 | potato | [ | PVY | Specim FX10 camera | ||||||||||||||||||||||
| 2014 | 42 | 400–1000 | not mentioned | ] | field | [65][43 | The Netherlands | |||||||||||||||||||
| wheat | yellow rust | ASD FieldSpec Pro spectrometer | 350–2500 | 428, 672, 1399 | field | [87] | India | 2019 | potato | early blight | Specim Imspector V10E spectrograph combined with camera | 430–900 | 550, 680, 720–750 | field | [66] | Belgium | ||||||||||
| 2019 | wheat | yellow rust | ASD FieldSpec Pro spectrometer | 350–1000 | 460–720, 568–709, 725–1000 | field | [88] | China | 2019 | tomato | bacterial spot, target spot | Resonon Pika L camera | 380–1020 | 408–420, 630–650, 730–750 | lab and field | [67] | USA | |||||||||
| 2019 | wheat | yellow rust | Specim ImSpector PFD V10E camera, Senop Oy Rikola camera | 400–1000, 500–900 | 594, 601, 706, 780, 797, 874, 881 | field | [89][90] | Germany | 2019 | pepper early | TSWV | |||||||||||||||
| 2019 | wheatSpecim Imspector V10E spectrograph combined with a camera | 400–1000 | 700–1000 | lab | [68] | Israel | ||||||||||||||||||||
| yellow rust | Cubert S185 camera | 450–950 | not mentioned | field | [91] | China | 2019 | potato | late blight | Senop Oy Rikola camera | 500–900 | 620, 724, 803 | ||||||||||||||
| 2019 | wheat | field | [ | 69] | The Netherlands | |||||||||||||||||||||
| 67 | ] | USA | ||||||||||||||||||||||||
| 75 | ] | USA | yellow rust | Headwall Photonics VNIR imaging sensor, Cubert S185 camera | 400–1000 | 538, 598, 689, 702, 751, 895 | lab, field | [92][93] | China | 2020 | tomato | yellow leaf curl, bacterial spot | Resonon Pika L camera | 380–1020 | 550–850 | lab and field | [ | 2020 | tomato early | ToCV | PP Systems Unispec-SC spectrometer | 310–1100 | 402.2, 405.5, 412.2, 415.6, 425.7, 429.0, 449.2, 556.4, 559.7, 563.0, 566.4, 676.4, 679.7, 722.9, 726.3, 862.1 | lab | [70] | Greece |
| 2020 | potato | late blight | ASD FieldSpec 4 spectrometer | 400–900 | 439–481, 554–559, 654–671, 702–709 | lab | [71] | Canada | ||||||||||||||||||
| 350–2500 | 700, 857, 970, 990, 1100, 1241, 1380, 1890, 2300 | lab | [73][ | |||||||||||||||||||||||
| 2011 | wheat | fusarium | Specim Imspector V10E spectrograph combined with camera | 400–1000 | 2020 | potato | late blight | ASD FieldSpec 4 spectrometer | 660–780 | 668, 705, 717, 740 | lab | [72] | Canada | |||||||||||||
| 2020 | potato early | late blight, early blight | Spectra Vista SVC HR-1024 spectrometer74] | USA |
References
- Elad, Y.; Pertot, I. Climate change impacts on plant pathogens and plant diseases. J. Crop Improv. 2014, 28, 99–139.
- Mahlein, A.K.; Kuska, M.T.; Behmann, J.; Polder, G.; Walter, A. Hyperspectral sensors and imaging technologies in phytopathology: State of the art. Annu. Rev. Phytopathol. 2018, 56, 535–558.
- Weiss, M.; Jacob, F.; Duveiller, G. Remote sensing for agricultural applications: A meta-review. Remote Sens. Environ. 2020, 236, 111402.
- Liu, J.; Miller, J.R.; Haboudane, D.; Pattey, E.; Nolin, M.C. Variability of seasonal CASI image data products and potential application for management zone delineation for precision agriculture. Can. J. Remote Sens. 2005, 31, 400–411.
- Jensen, J.R. Remote Sensing of the Environment: An Earth Resource Perspective; Prentice Hall: Upper Saddle River, NJ, USA, 2006.
- Jones, H.G.; Vaughan, R.A. Remote Sensing of Vegetation: Principles, Techniques, and Applications; Oxford University Press: Oxford, UK, 2010.
- Lucieer, A.; Malenovský, Z.; Veness, T.; Wallace, L. HyperUAS-imaging spectroscopy from a multirotor unmanned aircraft system. J. Field Robot. 2014, 31, 571–590.
- Gonzalez-Dugo, V.; Hernandez, P.; Solis, I.; Zarco-Tejada, P. Using High-Resolution Hyperspectral and Thermal Airborne Imagery to Assess Physiological Condition in the Context of Wheat Phenotyping. Remote Sens. 2015, 7, 13586–13605.
- Adao, T.; Hruška, J.; Pádua, L.; Bessa, J.; Peres, E.; Morais, R.; Sousa, J. Hyperspectral Imaging: A Review on UAV-Based Sensors, Data Processing and Applications for Agriculture and Forestry. Remote Sens. 2017, 9, 1110.
- Metternicht, G. Vegetation indices derived from high-resolution airborne videography for precision crop management. Int. J. Remote Sens. 2003, 24, 2855–2877.
- Schell, J.; Deering, D. Monitoring vegetation systems in the Great Plains with ERTS. NASA Spec. Publ. 1973, 351, 309.
- Thomas, S.; Kuska, M.T.; Bohnenkamp, D.; Brugger, A.; Alisaac, E.; Wahabzada, M.; Behmann, J.; Mahlein, A.K. Benefits of hyperspectral imaging for plant disease detection and plant protection: A technical perspective. JPDP 2018, 125, 5–20.
- De Jong, S.M.; Van Der Meer, F.D.; Clevers, J.G. Basics of Remote Sensing. Remote Sensing Image Analysis: Including the Spatial Domain; Springer: Dordrecht, The Netherlands, 2004.
- Mishra, P.; Asaari, M.S.M.; Herrero-Langreo, A.; Lohumi, S.; Diezma, B.; Scheunders, P. Close range hyperspectral imaging of plants: A review. Biosyst. Eng. 2017, 164, 49–67.
- Chen, Y.; Lin, Z.; Zhao, X.; Wang, G.; Gu, Y. Deep learning-based classification of hyperspectral data. IEEE J. Sel. Top. Appl. 2014, 7, 2094–2107.
- Landgrebe, D.A. Signal Theory Methods in Multispectral Remote Sensing; John Wiley & Sons: Hoboken, NJ, USA, 2003.
- Green, R.O.; Eastwood, M.L.; Sarture, C.M.; Chrien, T.G.; Aronsson, M.; Chippendale, B.J.; Faust, J.A.; Pavri, B.E.; Chovit, C.J.; Solis, M.; et al. Imaging spectroscopy and the airborne visible/infrared imaging spectrometer (AVIRIS). Remote Sens. Environ. 1998, 65, 227–248.
- Chang, C.-I. Hyperspectral Imaging: Techniques for Spectral Detection and Classification; Kluwer/Plenum: New York, NY, USA, 2003.
- Jia, X.; Richards, J.A.; Ricken, D.E. Remote Sensing Digital Image Analysis: An Introduction; Springer: Berlin/Heidelberg, Germany, 1999.
- Serpico, S.B.; D’Inca, M.; Melgani, F.; Moser, G. Comparison of feature reduction techniques for classification of hyperspectral remote-sensing data. In Image and Signal Processing for Remote Sensing VIII; International Society for Optics and Photonics: Bellingham, WA, USA, 2003; Volume 4885, pp. 347–358.
- Kaewpijit, S.; Le Moigne, J.; El-Ghazawi, T. Automatic reduction of hyperspectral imagery using wavelet spectral analysis. IEEE Trans. Geosci. Remote Sens. 2003, 41, 863–871.
- Xie, C.; He, Y. Spectrum and image texture features analysis for early blight disease detection on eggplant leaves. Sensors 2016, 16, 676.
- Barreto, A.; Paulus, S.; Varrelmann, M.; Mahlein, A.K. Hyperspectral imaging of symptoms induced by Rhizoctonia solani in sugar beet: Comparison of input data and different machine learning algorithms. J. Plant Dis. Prot. 2020, 127, 441–451.
- Huang, L.; Zhang, H.; Ruan, C.; Huang, W.; Hu, T.; Zhao, J. Detection of scab in wheat ears using in situ hyperspectral data and support vector machine optimized by genetic algorithm. Int. J. Agric. Biol. Eng. 2020, 13, 182–188.
- Nguyen, C.; Sagan, V.; Maimaitiyiming, M.; Maimaitijiang, M.; Bhadra, S.; Kwasniewski, M.T. Early Detection of Plant Viral Disease Using Hyperspectral Imaging and Deep Learning. Sensors 2021, 21, 742.
- Liu, F.; Xiao, Z. Disease Spots Identification of Potato Leaves in Hyperspectral Based on Locally Adaptive 1D-CNN. In Proceedings of the 2020 IEEE International Conference on Artificial Intelligence and Computer Applications (ICAICA), Dalian, China, 27–29 June 2020.
- Jin, X.; Jie, L.; Wang, S.; Qi, H.J.; Li, S.W. Classifying wheat hyperspectral pixels of healthy heads and Fusarium head blight disease using a deep neural network in the wild field. Remote Sens. 2018, 10, 395.
- Hruška, J.; Adão, T.; Pádua, L.; Marques, P.; Peres, E.; Sousa, A.; Morais, R.; Sousa, J.J. Deep Learning-Based Methodological Approach for Vineyard Early Disease Detection Using Hyperspectral Data. In Proceedings of the IGARSS 2018-2018 IEEE International Geoscience and Remote Sensing Symposium, Valencia, Spain, 22–27 July 2018.
- Shafri, H.Z.M.; Anuar, M.I. Hyperspectral Signal Analysis for Detecting Disease Infection in Oil Palms. In Proceedings of the International Conference on Computer and Electrical Engineering, Phuket, Thailand, 20–22 December 2008.
- Shafri, H.Z.M.; Hamdan, N. Hyperspectral Imagery for Mapping Disease Infection in Oil Palm Plantation Using Vegetation Indices and Red Edge Techniques. Am. J. Appl. Sci. 2009, 6, 1031–1035.
- Lelong, C.C.D.; Roger, J.-M.; Bregand, S.; Dubertret, F.; Lanore, M.; Sitorus, N.A.; Raharjo, D.A.; Caliman, J.-P. Discrimination of fungal disease infestation in oil-palm canopy hyperspectral reflectance data. In Proceedings of the First Workshop on Hyperspectral Image and Signal Processing: Evolution in Remote Sensing, Grenoble, France, 26–28 August 2009.
- Lelong, C.C.D.; Roger, J.-M.; Bregand, S.; Dubertret, F.; Lanore, M.; Sitorus, N.; Raharjo, D.A.; Caliman, J.-P. Evaluation of Oil-Palm Fungal Disease Infestation with Canopy Hyperspectral Reflectance Data. Sensors 2010, 10, 734–747.
- Shafri, H.Z.M.; Anuar, M.I.; Seman, I.A.; Noor, N.M. Spectral discrimination of healthy and Ganoderma-infected oil palms from hyperspectral data. Int. J. Remote Sens. 2011, 32, 7111–7129.
- Liaghat, S.; Ehsani, R.; Mansor, S.; Shafri, H.Z.M.; Meon, S.; Sankaran, S.; Azam, S.H.M.N. Early detection of basal stem rot disease (Ganoderma) in oil palms based on hyperspectral reflectance data using pattern recognition algorithms. Int. J. Remote Sens. 2014, 35, 3427–3439.
- Anuar, M.I.; Abu, S.I.; Nisfariza, M.N.; Nordiana, A.A.; Shafri, H.Z.M.; Ezzati, B. The development of spectral indices for early detection of Ganoderma disease in oil palm seedlings. Int. J. Remote Sens. 2017, 38, 6505–6527.
- Ahmadi, P.; Muharam, F.M.; Ahmad, K.; Mansor, S.; Abu, S.I. Early Detection of Ganoderma Basal Stem Rot of Oil Palms Using Artificial Neural Network Spectral Analysis. Plant Dis. 2017, 101, 1009–1016.
- Anuar, M.I.; Nisfariza, M.N.; Ezzati, B.; Idris, A.S.; Steven, M.D.; Boyd, D. Analysis of airborne hyperspectral image using vegetation indices, red edge position and continuum removal for detection of Ganoderma disease in oil palm. J. Oil Palm Res. 2018, 30, 416–428.
- Azmi, A.N.N.; Bejo, S.K.; Jahari, M.; Muharam, F.M.; Yule, I.; Husin, N.A. Early Detection of Ganoderma boninense in Oil Palm Seedlings Using Support Vector Machines. Remote Sens. 2020, 12, 3920.
- Selvaraja, S.; Balasundram, S.K.; Vadamalai, G.; Husni, M.H.A. Use of Spectral Reflectance to Discriminate between Potassium Deficiency and Orange Spotting Symptoms in Oil Palm (Elaeis guineensis). Life Sci. J. 2013, 10, 947–951.
- Selvaraja, S.; Balasundram, S.K.; Vadamalai, G.; Husni, M.H.A.; Khosla, R. Remote Sensing as a Tool to Assess Orange Spotting Disease in Oil Palm (Elaies guineensis). Mitt. Klosterneubg. 2014, 64, 12–26.
- Golhani, K.; Balasundram, S.K.; Vadamalai, G.; Pradhan, B. A review of neural networks in plant disease detection using hyperspectral data. Inf. Process. Agric. 2018, 5, 354–371.
- Golhani, K.; Balasundram, S.K.; Vadamalai, G.; Pradhan, B. Use of reflectance spectroscopy as a tool for screening viroid-inoculated oil palm seedlings. OAJAR 2017, 2, 1–4.
- Golhani, K.; Balasundram, S.K.; Vadamalai, G.; Pradhan, B. Selection of a spectral index for detection of orange spotting disease in oil palm (Elaeis guineensis jacq.) using red edge and neural network techniques. J. Indian Soc. Remote Sens. 2019, 47, 639–646.
- Sankaran, S.; Mishra, A.; Maja, J.M.; Ehsani, R. Visible-near infrared spectroscopy for detection of Huanglongbing HLB) Using a VIS-NIR Spectroscopy Technique. Comput. Electron. Agric. 2011, 77, 127–134.
- Sankaran, S.; Ehsani, R. Visible-near infrared spectroscopy based citrus greening detection: Evaluation of spectral feature extraction techniques. Crop Prot. 2011, 30, 1508–1513.
- Sankaran, S.; Maja, J.; Buchanon, S.; Ehsani, R. Huanglongbing (Citrus Greening) Detection Using Visible, Near Infrared and Thermal Imaging Techniques. Sensors 2013, 13, 2117–2130.
- Li, X.; Lee, W.S.; Li, M.; Ehsani, R.; Mishra, A.R.; Yang, C.; Mangan, R.L. Spectral difference analysis and airborne imaging classification for citrus greening infected trees. Comput. Electron. Agric. 2012, 83, 32–46.
- Kumar, A.; Lee, W.S.; Ehsani, R.J.; Albrigo, L.G.; Yang, C.; Mangane, R.L. Citrus greening disease detection using aerial hyperspectral and multispectral imaging techniques. J. Appl. Remote Sens. 2012, 6, 063542.
- Weng, H.; Lu, J.; Cen, H.; He, M.; Zeng, Y.; Hua, S.; Li, H.; Meng, Y.; Fang, H.; He, Y. Hyperspectral reflectance imaging combined with carbohydrate metabolism analysis for diagnosis of citrus Huanglongbing in different seasons and cultivars. Sens. Actuators B Chem. 2018, 275, 50–60.
- Deng, X.; Zhu, Z.; Yang, J.; Zheng, Z.; Huang, Z.; Yin, X.; Wei, S.; Lan, Y. Detection of Citrus Huanglongbing Based on Multi-Input Neural Network Model of UAV HRS. Remote Sens. 2020, 12, 2678.
- Deng, X.; Huang, Z.; Zheng, Z.; Lan, Y.; Dai, F. Field detection and classification of citrus Huanglongbing based on hyperspectral reflectance. Comput. Electron. Agric. 2019, 167, 105006.
- Mei, H.; Deng, X.; Hong, T.; Luo, X.; Deng, X. Early detection and grading of citrus huanglongbing using hyperspectral imaging technique. Trans. Chin. Soc. Agric. Eng. 2014, 30, 140–147.
- Zhang, M.; Qin, Z.; Liu, X.; Ustin, S.L. Detection of stress in tomatoes induced by late blight disease in California, USA, using HRS. Int. J. Appl. Earth. Obs. 2003, 4, 295–310.
- Krezhova, D.; Dikova, B.; Maneva, S. Ground based HRS for disease detection of tobacco plants. Bulg. J. Agric. Sci. 2014, 20, 1142–1150.
- Xie, C.; Shao, Y.; Li, X.; He, Y. Detection of early blight and late blight diseases on tomato leaves using hyperspectral imaging. Sci. Rep. 2015, 5, 16564.
- Xie, C.; Yang, C.; He, Y. Hyperspectral imaging for classification of healthy and gray mold diseased tomato leaves with different infection severities. Comput. Electron. Agric. 2017, 135, 154–162.
- Lu, J.; Zhou, M.; Gao, Y.; Jiang, H. Using hyperspectral imaging to discriminate yellow leaf curl disease in tomato leaves. Precis. Agric. 2017, 19, 379–394.
- Zhu, H.; Cen, H.; Zhang, C.; He, Y. Early Detection and Classification of Tobacco Leaves Inoculated with Tobacco Mosaic Virus Based on Hyperspectral Imaging Technique. In Proceedings of the ASABE Annual International Meeting, Orlando, FL, USA, 17–20 July 2016.
- Zhu, H.; Chu, B.; Zhang, C.; Liu, F.; Jiang, L.; He, Y. Hyperspectral imaging for presymptomatic detection of tobacco disease with successive projections algorithm and machine-learning classifiers. Sci. Rep. 2017, 7, 4125.
- Lu, J.; Ehsani, R.; Shi, Y.; de Castro, A.I.; Wang, S. Detection of multi-tomato leaf diseases (late blight, target and bacterial spots) in different stages by using a spectral-based sensor. Sci. Rep. 2018, 8, 2793.
- Wang, D.; Vinson, R.; Holmes, M.; Seibel, G.; Bechar, A.; Nof, S.; Luo, Y.; Tao, Y. Early Tomato Spotted Wilt Virus Detection using Hyperspectral Imaging Technique and Outlier Removal Auxiliary Classifier Generative Adversarial Nets (OR-AC-GAN). In Proceedings of the ASABE Annual International Meeting, Detroit, MI, USA, 29 July–1 August 2018.
- Griffel, L.M.; Delparte, D.; Edwards, J. Using Support Vector Machines classification to differentiate spectral signatures of potato plants infected with Potato Virus Y. Comput. Electron. Agric. 2018, 153, 318–324.
- Bienkowski, D.; Aitkenhead, M.J.; Lees, A.K.; Gallagher, C.; Neilson, R. Detection and differentiation between potato (Solanum tuberosum) diseases using calibration models trained with non-imaging spectrometry data. Comput. Electron. Agric. 2019, 167, 105056.
- Gu, Q.; Sheng, L.; Zhang, T.; Lu, Y.; Zhang, Z.; Zheng, K.; Hu, H.; Zhou, H. Early detection of tomato spotted wilt virus infection in tobacco using the hyperspectral imaging technique and machine learning algorithms. Comput. Electron. Agric. 2019, 167, 105066.
- Polder, G.; Blok, P.M.; de Villiers, H.A.C.; Van der Wolf, J.M.; Kamp, J. Potato Virus Y Detection in Seed Potatoes Using Deep Learning on Hyperspectral Images. Front. Plant Sci. 2019, 10, 209.
- Van de Vijvera, R.; Mertensa, K.; Heungensb, K.; Somersc, B.; Nuyttensa, D.; Borra-Serranoc, I.; Lootensd, P.; Roldán-Ruizd, I.; Vangeytea, J.; Saeys, W. In-field detection of Alternaria solani in potato crops using hyperspectral imaging. Comput. Electron. Agric. 2019, 168, 105106.
- Abdulridha, J.; Ampatzidis, Y.; Kakarla, S.C.; Robert, P. Laboratory and UAV-Based Identification and Classification of Tomato Yellow Leaf Curl, Bacterial Spot, and Target Spot Diseases in Tomato Utilizing Hyperspectral Imaging and Machine Learning. Remote Sens. 2020, 21, 3843.
- Wang, D.; Vinson, R.; Holmes, M.; Seibel, G.; Bechar, A.; Nof, S.; Tao, Y. Early Detection of Tomato Spotted Wilt Virus by Hyperspectral Imaging and Outlier Removal Auxiliary Classifier Generative Adversarial Nets (OR-AC-GAN). Sci. Rep. 2019, 9, 4377.
- Franceschini, M.H.D.; Bartholomeus, H.; van Apeldoorn, D.F.; Suomalainen, J.; Kooistra, L. Feasibility of unmanned aerial vehicle optical imagery for early detection and severity assessment of late blight in potato. Remote Sens. 2019, 11, 224.
- Morellos, A.; Tziotzios, G.; Orfanidou, C.; Pantazi, X.E.; Sarantaris, C.; Maliogka, V.; Alexandridis, T.K.; Moshou, D. Non-Destructive Early Detection and Quantitative Severity Stage Classification of Tomato Chlorosis Virus (ToCV) Infection in Young Tomato Plants Using Vis–NIR Spectroscopy. Remote Sens. 2020, 12, 1920.
- Fernandez, C.I.; Leblon, B.; Haddadi, A.; Wang, J.; Wang, K. Potato Late Blight Detection at the Leaf and Canopy Level Using Hyperspectral Data. Can. J. Remote Sens. 2020, 46, 390–413.
- Fernandez, C.I.; Leblon, B.; Haddadi, A.; Wang, K.; Wang, J. Potato Late Blight Detection at the Leaf and Canopy Levels Based in the Red and Red-Edge Spectral Regions. Remote Sens. 2020, 12, 1292.
- Gold, K.M.; Townsend, P.A.; Herrmann, I.; Gevens, A.J. Investigating potato late blight physiological differences across potato cultivars with spectroscopy and machine learning. Plant Sci. 2019, 110316.
- Gold, K.M.; Townsend, P.A.; Chlus, A.; Herrmann, I.; Couture, J.J.; Larson, E.R.; Gevens, A.J. Hyperspectral Measurements Enable Pre-Symptomatic Detection and Differentiation of Contrasting Physiological Effects of Late Blight and Early Blight in Potato. Remote Sens. 2020, 12, 286.
- Delwiche, S.R.; Kim, M.S. Biological Quality and Precision Agriculture, II. DeShazer, J.A., Meyer, G.E., Eds.; SPIE: Bellingham, WA, USA, 2000; Volume 4203.
- Bauriegel, E.; Giebel, A.; Geyer, M.; Schmidt, U.; Herppich, W.B. Early detection of Fusarium infection in wheat using hyper-spectral imaging. Comput. Electron. Agric. 2011, 75, 304–312.
- Barbedo, J.G.A.; Tibola, C.S.; Fernandes, J.M.C. Detecting Fusarium head blight in wheat kernels using hyperspectral imaging. Biosyst. Eng. 2015, 131, 65–76.
- Alisaac, E.; Behmann, J.; Kuska, M.T.; Dehne, H.-W.; Mahlein, A.-K. Hyperspectral quantification of wheat resistance to Fusarium head blight: Comparison of two Fusarium species. Eur. J. Plant Pathol. 2018, 152, 869–884.
- Mahlein, A.-K.; Alisaac, E.; Al Masri, A.; Behmann, J.; Dehne, H.-W.; Oerke, E.-C. Comparison and Combination of Thermal, Fluorescence, and Hyperspectral Imaging for Monitoring Fusarium Head Blight of Wheat on Spikelet Scale. Sensors 2019, 19, 2281.
- Whetton, R.L.; Hassall, K.L.; Waine, T.W.; Mouazen, A.M. Hyperspectral measurements of yellow rust and fusarium head blight in cereal crops: Part 1: Laboratory study. Biosyst. Eng. 2018, 166, 101–115.
- Whetton, R.L.; Waine, T.W.; Mouazen, A.M. Hyperspectral measurements of yellow rust and fusarium head blight in cereal crops: Part 2: On-line field measurement. Biosyst. Eng. 2018, 167, 144–158.
- Ma, H.; Huang, W.; Jing, Y.; Pignatti, S.; Laneve, G.; Dong, Y.; Ye, H.; Liu, L.; Guo, A.; Jiang, J. Identification of Fusarium Head Blight in Winter Wheat Ears Using Continuous Wavelet Analysis. Sensors 2019, 20, 20.
- Zhang, N.; Pan, Y.; Feng, H.; Zhao, X.; Yang, X.; Ding, C.; Yang, G. Development of Fusarium head blight classification index using hyperspectral microscopy images of winter wheat spikelets. Biosyst. Eng. 2019, 186, 83–99.
- Zhang, D.; Wang, Q.; Lin, F.; Yin, X.; Gu, C.; Qiao, H. Development and Evaluation of a New Spectral Disease Index to Detect Wheat Fusarium Head Blight Using Hyperspectral Imaging. Sensors 2020, 20, 2260.
- Huang, W.; Lamb, D.W.; Niu, Z.; Zhang, Y.; Liu, L.; Wang, J. Identification of yellow rust in wheat using in-situ spectral reflectance measurements and airborne hyperspectral imaging. Precis. Agric. 2007, 8, 187–197.
- Zhang, J.; Pu, R.; Huang, W.; Yuan, L.; Luo, J.; Wang, J. Using in-situ hyperspectral data for detecting and discriminating yellow rust disease from nutrient stresses. Field Crops Res. 2012, 134, 165–174.
- Krishna, G.; Sahoo, R.N.; Pargal, S.; Gupta, V.K.; Sinha, P.; Bhagat, S.; Saharan, M.S.; Singh, R.; Chattopadhyay, C. Assessing Wheat Yellow Rust Disease through Hyperspectral Remote Sensing. ISPRS Int. Arch. Photogramm. Remote Sens. Spat. Inf. Sci. 2014, XL-8, 1413–1416.
- Zheng, Q.; Huang, W.; Cui, X.; Dong, Y.; Shi, Y.; Ma, H.; Liu, L. Identification of Wheat Yellow Rust Using Optimal Three-Band Spectral Indices in Different Growth Stages. Sensors 2018, 19, 35.
- Bohnenkamp, D.; Behmann, J.; Mahlein, A.-K. In-Field Detection of Yellow Rust in Wheat on the Ground Canopy and UAV Scale. Remote Sens. 2019, 11, 2495.
- Bohnenkamp, D.; Kuska, M.T.; Mahlein, A.-K.; Behmann, J. Utilising pure fungal spore spectra as reference for a hyperspectral signal decomposition and symptom detection of wheat rust diseases on leaf scale. Plant Pathol. 2019, 68, 1188–1195.
- Zhang, X.; Han, L.; Dong, Y.; Shi, Y.; Huang, W.; Han, L.; González-Moreno, P.; Ma, H.; Ye, H.; Sobeih, T. A Deep Learning-Based Approach for Automated Yellow Rust Disease Detection from High-Resolution Hyperspectral UAV Images. Remote Sens. 2019, 11, 1554.
- Guo, A.; Huang, W.; Ye, H.; Dong, Y.; Ma, H.; Ren, Y.; Ruan, C. Identification of Wheat Yellow Rust Using Spectral and Texture Features of Hyperspectral Images. Remote Sens. 2020, 12, 1419.
- Guo, A.; Huang, W.; Dong, Y.; Ye, H.; Ma, H.; Liu, B.; Wu, B.; Ren, Y.; Ruan, C.; Geng, Y. Wheat Yellow Rust Detection Using UAV-Based Hyperspectral Technology. Remote Sens. 2021, 13, 123.
- Lan, Y.; Zhu, Z.; Deng, X.; Lian, B.; Huang, J.; Huang, Z.; Hu, J. Monitoring and classification of Huanglongbing plants of citrus based on UAV HRS. Trans. Chin. Soc. Agric. Eng. 2019, 35, 92–100.
- Lan, Y.; Huang, Z.; Deng, X.; Zhu, Z.; Huang, H.; Zheng, Z.; Lian, B.; Zeng, G.; Tong, Z. Comparison of machine learning methods for citrus greening detection on UAV multispectral images. Comput. Electron. Agric. 2020, 171, 105234.
- Anuar, M.I. Modified vegetation indices for Ganoderma disease detection in oil palm from field spectroradiometer data. J. Appl. Remote Sens. 2009, 3, 033556.
- Mansour, K.; Mutanga, O.; Adam, E.; Abdel-Rahman, E.M. Multispectral remote sensing for mapping grassland degradation using the key indicators ofgrass species and edaphic factors. Geocarto Int. 2016, 31, 477–491.
- Martínez-Usó, A.; Pla, F.; Sotoca, J.M.; García-Sevilla, P. Clustering-based hyperspectral band selection using information measures. IEEE Trans. Geosci. Remote 2007, 45, 4158–4171.
- Guo, B.F.; Damper, R.I.; Gunn, S.R.; Nelson, J.D.B. A fast separability-based feature-selection method for high-dimensional remotely sensed image classification. Pattern Recogn. 2008, 41, 1653–1662.
- Lorente, D.; Aleixos, N.; Gómez-Sanchis, J.; Cubero, S.; Blasco, J. Selection of optimal wavelengths features for decay detection in citrus fruit using the ROC curve and neural networks. Food Bioprocess Technol. 2013, 6, 530–541.
- Andries, J.P.M.; Heyden, Y.V.; Buydens, L.M.C. Predictive-property-ranked variable reduction in partial least squares modelling with final complexity adapted models: Comparison of properties for ranking. Anal. Chim. Acta 2013, 760, 34–45.
- Van der Plank, J.E. Plant Diseases: Epidemics and Control; Academic: New York, NY, USA, 1963.
- Wheeler, B.E.J. An Introduction to Plant Diseases; John Wiley: London, UK, 1969.
- Hale, M.G.; Orcutt, D.M. The Physiology of Plants Under Stress; John Wiley & Sons: New York, NY, USA, 1987.
- Fox, R.; Narra, H. Plant disease diagnosis. In The Epidemiology of Plant Diseases, 2nd ed.; Cooke, B.M., Jones, D.G., Kaye, B., Eds.; Springer: Dordrecht, The Netherlands, 2006; pp. 1–42.
- Afanasenko, O.S.; Mironenko, N.V.; Bespalova, L.A.; Ablova, I.B.; Lashina, N.M. Ramularia spot blotch in Russian Federation: Distribution and diagnosis. Mikol. Fitopatol. 2019, 53, 236–245.
- Kolander, T.M.; Bienapfl, J.C.; Kurle, J.E.; Malvick, D.K. Symptomatic and Asymptomatic Host Range of Fusarium virguliforme, the Causal Agent of Soybean Sudden Death Syndrome. Plant Dis. 2012, 96, 1148–1153.
- Bray, E.A. Plant responses to water deficit. Trends Plant Sci. 1997, 2, 48–54.
- Bohnert, H.J.; Sheveleva, E. Plant stress adaptations—Making metabolism move. Curr. Opin. Plant Biol. 1998, 1, 267–274.
- Shabala, S. Plant Stress Physiology. CAB International: Oxford, UK; Oxford, MS, USA, 2012.
- Senaratna, T.; Touchell, D.; Bunn, E.; Dixon, K. Acetyl salicylic acid (Aspirin) and salicylic acid induce multiple stress tolerance in bean and tomato plants. Plant Growth Regul. 2000, 30, 157–161.
- Khan, M.I.R.; Fatma, M.; Per, T.S.; Anjum, N.A.; Khan, N.A. Salicylic acid-induced abiotic stress tolerance and underlying mechanisms in plants. Front. Plant Sci. 2015, 6, 462.
- Koo, Y.M.; Heo, A.Y.; Choi, H.W. Salicylic Acid as a Safe Plant Protector and Growth Regulator. Plant Pathol. J. 2020, 36, 1–10.
- Wasternack, C.; Hause, B. Jasmonates and octadecanoids: Signals in plant stress responses and development. Prog. Nucleic Acid Res. Mol. Biol. 2002, 165–221.
- Dar, T.A.; Uddin, M.; Khan, M.M.A.; Hakeem, K.R.; Jaleel, H. Jasmonates counter plant stress: A Review. Environ. Exp. Bot. 2015, 115, 49–57.
- Goel, P.; Prasher, S.; Landry, J.; Patel, R.; Bonnell, R.; Viau, A.; Miller, J. Potential of airborne hyperspectral remote sensing to detect nitrogen deficiency and weed infestation in corn. Comput. Electron. Agric. 2003, 38, 99–124.
- Behmann, J.; Steinrücken, J.; Plümer, L. Detection of early plant stress responses in hyperspectral images. ISPRS J. Photogramm. Remote Sens. 2014, 93, 98–111.
- Zhao, F.; Huang, Y.; Guo, Y.; Reddy, K.; Lee, M.; Fletcher, R.; Thomson, S. Early Detection of Crop Injury from Glyphosate on Soybean and Cotton Using Plant Leaf Hyperspectral Data. Remote Sens. 2014, 6, 1538–1563.
- Huang, Y.; Yuan, L.; Reddy, K.N.; Zhang, J. In-situ plant hyperspectral sensing for early detection of soybean injury from dicamba. Biosyst. Eng. 2016, 149, 51–59.
- Sayyari, M.; Salehi, F.; Valero, D. New Approaches to Modeling Methyl Jasmonate Effects on Pomegranate Quality during Postharvest Storage. Int. J. Fruit Sci. 2017, 17, 374–390.
- Do Prado Ribeiro, L.; Klock, A.L.S.; Filho, J.A.W.; Tramontin, M.A.; Trapp, M.A.; Mithöfer, A.; Nansen, C. Hyperspectral imaging to characterize plant–plant communication in response to insect herbivory. Plant Methods 2018, 14, 54.
- Zovko, M.; Žibrat, U.; Knapič, M.; Kovačić, M.B.; Romić, D. Hyperspectral remote sensing of grapevine drought stress. Precis. Agric. 2019, 20, 335–347.
- Wang, J.; Zhang, C.; Shi, Y.; Long, M.; Islam, F.; Yang, C.; He, Y.; Zhou, W. Evaluation of quinclorac toxicity and alleviation by salicylic acid in rice seedlings using ground-based visible/near-infrared hyperspectral imaging. Plant Methods 2020, 16, 30.
- Jackson, R.D. Remote Sensing of Biotic and Abiotic Plant Stress. Annu. Rev. Phytopathol. 1986, 24, 265–287.
- Irmak, S.; Haman, D.Z.; Bastug, R. Determination of Crop Water Stress Index for Irrigation Timing and Yield Estimation of Corn. J. Agron. 2000, 92, 1221.
- Nansen, C.; Macedo, T.; Swanson, R.; Weaver, D.K. Use of spatial structure analysis of hyperspectral data cubes for detection of insect-induced stress in wheat plants. Int. J. Remote Sens. 2009, 30, 2447–2464.
- Lowe, A.; Harrison, N.; French, A.P. Hyperspectral image analysis techniques for the detection and classification of the early onset of plant disease and stress. Plant Methods 2017, 13, 80.
- Nansen, C.; Sidumo, A.J.; Capareda, S. Variogram Analysis of Hyperspectral Data to Characterize the Impact of Biotic and Abiotic Stress of Maize Plants and to Estimate Biofuel Potential. Appl. Spectrosc. 2010, 64, 627–636.
- Susič, N.; Žibrat, U.; Širca, S.; Strajnar, P.; Razinger, J.; Knapič, M.; Voncuna, A.; Urek, G.; Gerič Stare, B. Discrimination between abiotic and biotic drought stress in tomatoes using hyperspectral imaging. Sens. Actuators B Chem. 2018, 273, 842–852.
- Das, B.; Mahajan, G.R.; Singh, R. HRS: Use in Detecting Abiotic Stresses in Agriculture. Adv. Crop. Environ. Interact. 2018, 317–335.
- Gagkaeva, T.; Gavrilova, O.; Orina, A.; Lebedin, Y.; Shanin, I.; Petukhov, P.; Eremin, S. Analysis of Toxigenic Fusarium Species Associated with Wheat Grain from Three Regions of Russia: Volga, Ural, and West Siberia. Toxins 2019, 11, 252.
- Mahlein, A.-K. Plant Disease Detection by Imaging Sensors—Parallels and Specific Demands for Precision Agriculture and Plant Phenotyping. Plant Dis. 2016, 100, 241–251.
- Behmann, J.; Acebron, K.; Emin, D.; Bennertz, S.; Matsubara, S.; Thomas, S.; Bohnenkamp, D.; Kuska, M.T.; Jussila, J.; Salo, H.; et al. Specim IQ: Evaluation of a new, miniaturized handheld hyperspectral camera and its application for plant phenotyping and disease detection. Sensors 2018, 18, 441.
- Singh, A.K.; Ganapathysubramanian, B.; Sarkar, S.; Singh, A. Deep Learning for Plant Stress Phenotyping: Trends and Future Perspectives. Trends Plant Sci. 2018, 23, 883–898.
- Brugger, A.; Behmann, J.; Paulus, S.; Luigs, H.-G.; Kuska, M.T.; Schramowski, P.; Kersting, K.; Steiner, U.; Mahlein, A.-K. Extending Hyperspectral Imaging for Plant Phenotyping to the UV-Range. Remote Sens. 2019, 11, 1401.
- Mutka, A.M.; Bart, R.S. Image-based phenotyping of plant disease symptoms. Front. Plant Sci. 2015, 5, 734.
- Mutka, A.M.; Fentress, S.J.; Sher, J.W.; Berry, J.C.; Pretz, C.; Nusinow, D.A.; Bart, R. Quantitative, Image-Based Phenotyping Methods Provide Insight into Spatial and Temporal Dimensions of Plant Disease. Plant Physiol. 2016, 172, 650–660.
- Calderón, R.; Navas-Cortés, J.A.; Lucena, C.; Zarco-Tejada, P.J. High-resolution airborne hyperspectral and thermal imagery for early detection of Verticillium wilt of olive using fluorescence, temperature and narrow-band spectral indices. Remote Sens. Environ. 2013, 139, 231–245.
- Roháček, K.; Soukupová, J.; Barták, M. Chlorophyll fluorescence: A wonderful tool to study plant physiology and plant stress. Res. Signpost. 2008, 37, 41–104.
- Bauriegel, E.; Giebel, A.; Herppich, W.B. Hyperspectral and Chlorophyll Fluorescence Imaging to Analyse the Impact of Fusarium culmorum on the Photosynthetic Integrity of Infected Wheat Ears. Sensors 2011, 11, 3765–3779.
- Yu, K.; Leufen, G.; Hunsche, M.; Noga, G.; Chen, X.; Bareth, G. Investigation of Leaf Diseases and Estimation of Chlorophyll Concentration in Seven Barley Varieties Using Fluorescence and Hyperspectral Indices. Remote Sens. 2013, 6, 64–86.
- Pérez-Bueno, M.L.; Pineda, M.; Barón, M. Phenotyping Plant Responses to Biotic Stress by Chlorophyll Fluorescence Imaging. Front. Plant Sci. 2019, 10, 1135.
- Abdulridha, J.; Ampatzidis, Y.; Qureshi, J.; Robert, P. Detection of target spot and bacterial spot diseases in tomato using UAV based and benchtop based hyperspectral imaging techniques. Precis. Agric. 2019, 21, 955–978.
- Basati, Z.; Jamshidi, B.; Rasekh, M.; Abbaspour-Gilandeh, Y. Detection of sunn pest-damaged wheat samples using visible/near-infrared spectroscopy based on pattern recognition. Spectrochim. Acta A Mol. Biomol. Spectrosc. 2018, 203, 308–314.
- Kumar, J.; Vashisth, A.; Sehgal, V.K.; Gupta, V.K. Assessment of Aphid Infestation in Mustard by Hyperspectral Remote Sensing. J. Indian Soc. Remote Sens. 2012, 41, 83–90.
- Canário, D.V.P.; Figueiredo, E.; Franco, J.C.; Guerra, R. Detecting early mealybug infestation stages on tomato plants using optical spectroscopy. Eur. J. Hortic. Sci. 2017, 82, 141–148.
- Zhang, J.; Huang, Y.; Pu, R.; Gonzalez-Moreno, P.; Yuan, L.; Wu, K.; Huang, W. Monitoring plant diseases and pests through remote sensing technology: A review. Comput. Electron. Agric. 2019, 165, 104943.
- Yan, T.; Xu, W.; Lin, J.; Duan, L.; Gao, P.; Zhang, C.; Lu, X. Combining Multi-Dimensional Convolutional Neural Network (CNN) With Visualization Method for Detection of Aphis gossypii Glover Infection in Cotton Leaves Using Hyperspectral Imaging. Front. Plant Sci. 2021, 12, 74.
- Carter, G.A.; Knapp, A.K. Leaf optical properties in higher plants: Linking spectral characteristics to stress and chlorophyll concentration. Am. J. Bot. 2001, 88, 677–684.
- Gitelson, A.A.; Merzlyak, N.M.; Chivkunova, B.O. Optical properties and non-destructive estimation of anthocyanin content in plant leaves. Photochem. Photobiol. 2001, 74, 38–45.
- Carter, G.A.; Spiering, B.A. Optical Properties of Intact Leaves for Estimating Chlorophyll Concentration. J. Environ. Qual. 2002, 31, 1424.
- Jacquemoud, S.; Baret, F. PROSPECT: A model of leaf optical properties spectra. Remote Sens. Environ. 1990, 34, 75–91.
- Jacquemoud, S.; Ustin, S.L. Leaf optical properties: A State of the art. In Proceedings of the 8th International Symposium of Physical Measurements & Signatures in Remote Sensing—CNES, Aussois, France, 8–12 January 2001.
- Jacquemoud, S.; Ustin, S. Leaf Optical Properties; Cambridge University Press: Cambridge, UK, 2019.
- Yao, X.; Zhu, Y.; Tian, Y.; Feng, W.; Cao, W. Exploring hyperspectral bands and estimation indices for leaf nitrogen accumulation in wheat. Appl. Earth. Obs. Geoinf. 2010, 12, 89–100.
- Stellacci, A.M.; Castrignanò, A.; Troccoli, A.; Basso, B.; Buttafuoco, G. Selecting optimal hyperspectral bands to discriminate nitrogen status in durum wheat: A comparison of statistical approaches. Environ. Monit. Assess. 2016, 188, 1–15.
- Thompson, L.J.; Puntel, L.A. Transforming Unmanned Aerial Vehicle (UAV) and Multispectral Sensor into a Practical Decision Support System for Precision Nitrogen Management in Corn. Remote Sens. 2020, 12, 1597.
- Devadas, R.; Lamb, D.W.; Simpfendorfer, S.; Backhouse, D. Evaluating ten spectral vegetation indices for identifying rust infection in individual wheat leaves. Precis. Agric. 2008, 10, 459–470.
- Zhao, Y.-R.; Li, X.; Yu, K.-Q.; Cheng, F.; He, Y. Hyperspectral Imaging for Determining Pigment Contents in Cucumber Leaves in Response to Angular Leaf Spot Disease. Sci. Rep. 2016, 6, 27790.
- He, R.; Li, H.; Qiao, X.; Jiang, J. Using wavelet analysis of hyperspectral remote-sensing data to estimate canopy chlorophyll content of winter wheat under stripe rust stress. Int. J. Remote Sens. 2018, 39, 4059–4076.
- Gao, Z.; Khot, L.R.; Naidu, R.A.; Zhang, Q. Early detection of grapevine leafroll disease in a red-berried wine grape cultivar using hyperspectral imaging. Comput. Electron. Agric. 2020, 179, 105807.
- Calderón, R.; Navas-Cortés, J.; Zarco-Tejada, P. Early Detection and Quantification of Verticillium Wilt in Olive Using Hyperspectral and Thermal Imagery over Large Areas. Remote Sens. 2015, 7, 5584–5610.
- Zarco-Tejada, P.J.; Camino, C.; Beck, P.S.A.; Calderon, R.; Hornero, A.; Hernández-Clemente, R.; Kattenborn, T.; Montes-Borrego, M.; Susca, L.; Morelli, M.; et al. Previsual symptoms of Xylella fastidiosa infection revealed in spectral plant-trait alterations. Nat. Plants 2018, 4, 432–439.
- Zhao, Y.; Yu, K.; Feng, C.; Cen, H.; He, Y. Early Detection of Aphid (Myzus persicae) Infestation on Chinese Cabbage by Hyperspectral Imaging and Feature Extraction. Trans. ASABE 2017, 60, 1045–1051.
- Pandey, P.; Ge, Y.; Stoerger, V.; Schnable, J.C. High Throughput In vivo Analysis of Plant Leaf Chemical Properties Using Hyperspectral Imaging. Front. Plant Sci. 2017, 8, 1348.
- Zhou, W.; Zhang, J.; Zou, M.; Liu, X.; Du, X.; Wang, Q.; Liu, Y.; Liu, Y.; Li, J. Prediction of cadmium concentration in brown rice before harvest by hyperspectral remote sensing. Environ. Sci. Pollut. Res. 2018, 26, 1848–1856.
- Ge, Y.; Atefi, A.; Zhang, H.; Miao, C.; Ramamurthy, R.K.; Sigmon, B.; Yang, J.; Schnable, J.C. High-throughput analysis of leaf physiological and chemical traits with VIS–NIR–SWIR spectroscopy: A case study with a maize diversity panel. Plant Methods 2019, 15, 66.
- Hu, N.; Li, W.; Du, C.; Zhang, Z.; Gao, Y.; Sun, Z.; Yang, L.; Yu, K.; Zhang, Y.; Wang, Z. Predicting micronutrients of wheat using hyperspectral imaging. Food Chem. 2021, 343, 128473.
- Fuentes, S.; Tongson, E.; Unnithan, R.R.; Gonzalez Viejo, C. Early Detection of Aphid Infestation and Insect-Plant Interaction Assessment in Wheat Using a Low-Cost Electronic Nose (E-Nose), Near-Infrared Spectroscopy and Machine Learning Modeling. Sensors 2021, 21, 5948.
- Fang, Y.; Ramasamy, R.P. Current and prospective methods for plant disease detection. Biosensors 2015, 5, 537–561.
- Müller, C.; Hosgood, B.; Andreoli, G. Physical mechanisms in hyperspectral BRDF data of grass and watercress. Remote Sens. Environ. 1998, 66, 222–233.
- Ferwerda, J.G.; Skidmore, A.K.; Mutanga, O. Nitrogen detection with hyperspectral normalized ratio indices across multiple plant species. Int. J. Remote Sens. 2005, 26, 4083–4095.
- López-Higuera, J.M. Sensing Using Light: A Key Area of Sensors. Sensors 2021, 21, 6562.
More