Chronic use of glyceryl trinitrate (GTN) is limited by serious side effects, such as tolerance and endothelial dysfunction of coronary and resistance arteries. Although GTN is used as a drug since more than 130 years, the mechanisms of the vasodilatory effects and of tolerance development to organic nitrates are still incompletely elucidated. New synthesized organic nitrates with and without antioxidant properties were characterized for their ex vivo tolerance profile, in order to investigate the oxidative stress hypothesis of nitrate tolerance. The organic nitrates studied showed different vasodilation and tolerance profiles, probably due to the ability or inability of the compounds to interact with the aldehyde dehydrogenase-2 enzyme (ALDH-2) involved in bioactivation. Furthermore, nitrooxy derivatives endowed with antioxidant properties did not determine the onset of tolerance, even if bioactivated by ALDH-2. The results of this study could be further evidence of the involvement of ALDH-2 in the development of nitrate tolerance. Moreover, the behavior of organic nitrates with antioxidant properties supports the hypothesis of the involvement of ROS in inactivating ALDH-2.
1. Introduction
Organic nitrates such as glyceryl trinitrate (GTN) are the most commonly adopted vasodilators in coronary artery diseases. The mechanism by which organic nitrates dilate blood vessels is still not fully understood. It is generally accepted that they are prodrugs that require bioactivation to yield NO or an ‘NO’-like species resulting in relaxation of the vascular smooth muscle
[1][2][3][1,2,3]. Different enzymes have been implicated in the bioconversion of organic nitrates, in particular glutathione S-transferases, the cytochrome P450 system, xanthine oxidoreductase, and glyceraldehyde-3-phosphate dehydrogenase, although recent evidence suggests a central role for mitochondrial lipoic acid-dependent aldehyde dehydrogenase (ALDH)-2
[4][5][6][4,5,6]. In fact, it has been reported that the GTN bioactivation catalyzed by ALDH-2 involves the oxidation of two vicinal cysteine residues, leading to the formation of a disulfide; this mechanism implicates the requirement of a reducing agent (such as lipoic acid) for sustained catalysis
[7]. Although organic nitrates are still among the most commonly prescribed medications for the treatment of angina pectoris and myocardial infarction, any hypothesis concerning the mechanism of action of these drugs must take into account the phenomenon of tolerance. In fact, the chronic efficacy of nitrates is blunted due to the development of nitrate tolerance and endothelial dysfunction
[8]. It is well established that most organic nitrates cause nitrate tolerance and/or cross-tolerance to endothelium-dependent vasodilators
[9]. Tolerance to nitrates is a still not well understood, complex, and multifactorial phenomenon
[10], and a number of mechanisms have been proposed to explain the tolerance development
[11][12][11,12]. One of the best studied and most widely accepted postulates involves the production of reactive oxygen species (ROS). The first report on a role for oxidative stress on the development of nitrate tolerance was published in 1995 by Münzel and co-workers
[13]. These authors hypothesized that nitrate tolerance results from an increase in vascular superoxide, due to uncoupled endothelial nitric oxide synthase and increased activity of NADPH oxidase. Moreover, several studies showed abnormalities in the bioactivation process and in particular, in the denitration of nitrates by the ALDH-2 within the mithocondria
[14][15][16][14,15,16]. The observation that GTN treatment triggers mitochondrial ROS production
[17] leads to the proposal that ALDH-2 might be inactivated by ROS produced during sustained nitrate therapy. Indeed, ROS can oxidize ALDH-2 thiols either reversibly (disulfide form) or irreversibly (sulfonic acid); in addition, reactive oxygen species can oxidize lipoic acid causing its depletion
[18][19][18,19]. In particular, a study has demonstrated that the impaired GTN biotransformation concept as well as the oxidative stress concept are closely related to each other
[20]. This study showed that acute in vitro incubation of mitochondria with GTN leads to an increase in ROS production, associated with an inhibition of the mitochondrial ALDH-2. These findings were extended by in vivo observations, demonstrating that GTN treatment of rats for a 3-day period increased mitochondrial ROS production and simultaneously inhibited the activity of the enzyme. These observations supported the idea that oxidative stress may directly impair GTN biotransformation, either by oxidative inhibition of ALDH-2 or by depletion of essential repair cofactors such as lipoic acid
[2][21][2,21].
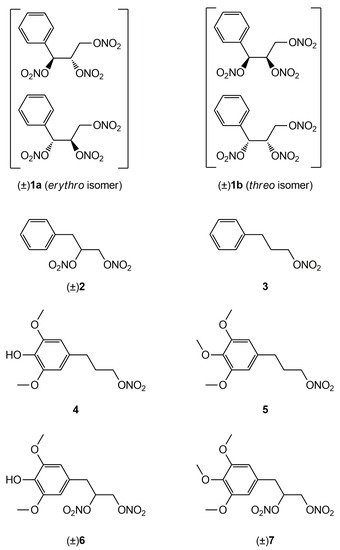
In a previous work
[22] rwe
searchers described the synthesis and the in vitro vasodilator profile of a new series of compounds, in which the phenyl group was introduced into the molecule of GTN; analogues obtained formally by elimination of one or two nitrooxy groups were also synthesized and characterized. On the basis of the results obtained, in this
entry researcherspaper we report the ex vivo characterization of the tolerance profile of the nitrooxyphenylalkyl derivatives
1-
3 (
Figure 1). In the light of the oxidative stress hypothesis of nitrate tolerance, here
rwe
searchers report also the ex vivo characterization of the tolerance profile of new organic nitrates
4 and
6 with antioxidant properties, formally obtained by joining an antioxidant phenol moiety with a nitrooxyalkyl chain. The synthesis and the antioxidant activity of these multitarget drugs were described in previous works
[23][24][23,24]. The in vitro vasodilating activity of new antioxidant nitrates and their metabolic transformations are also reported here. Compounds
5 and
7 were expressly synthesized; these molecules, devoid of antioxidant activity, were taken as references, together with GTN.
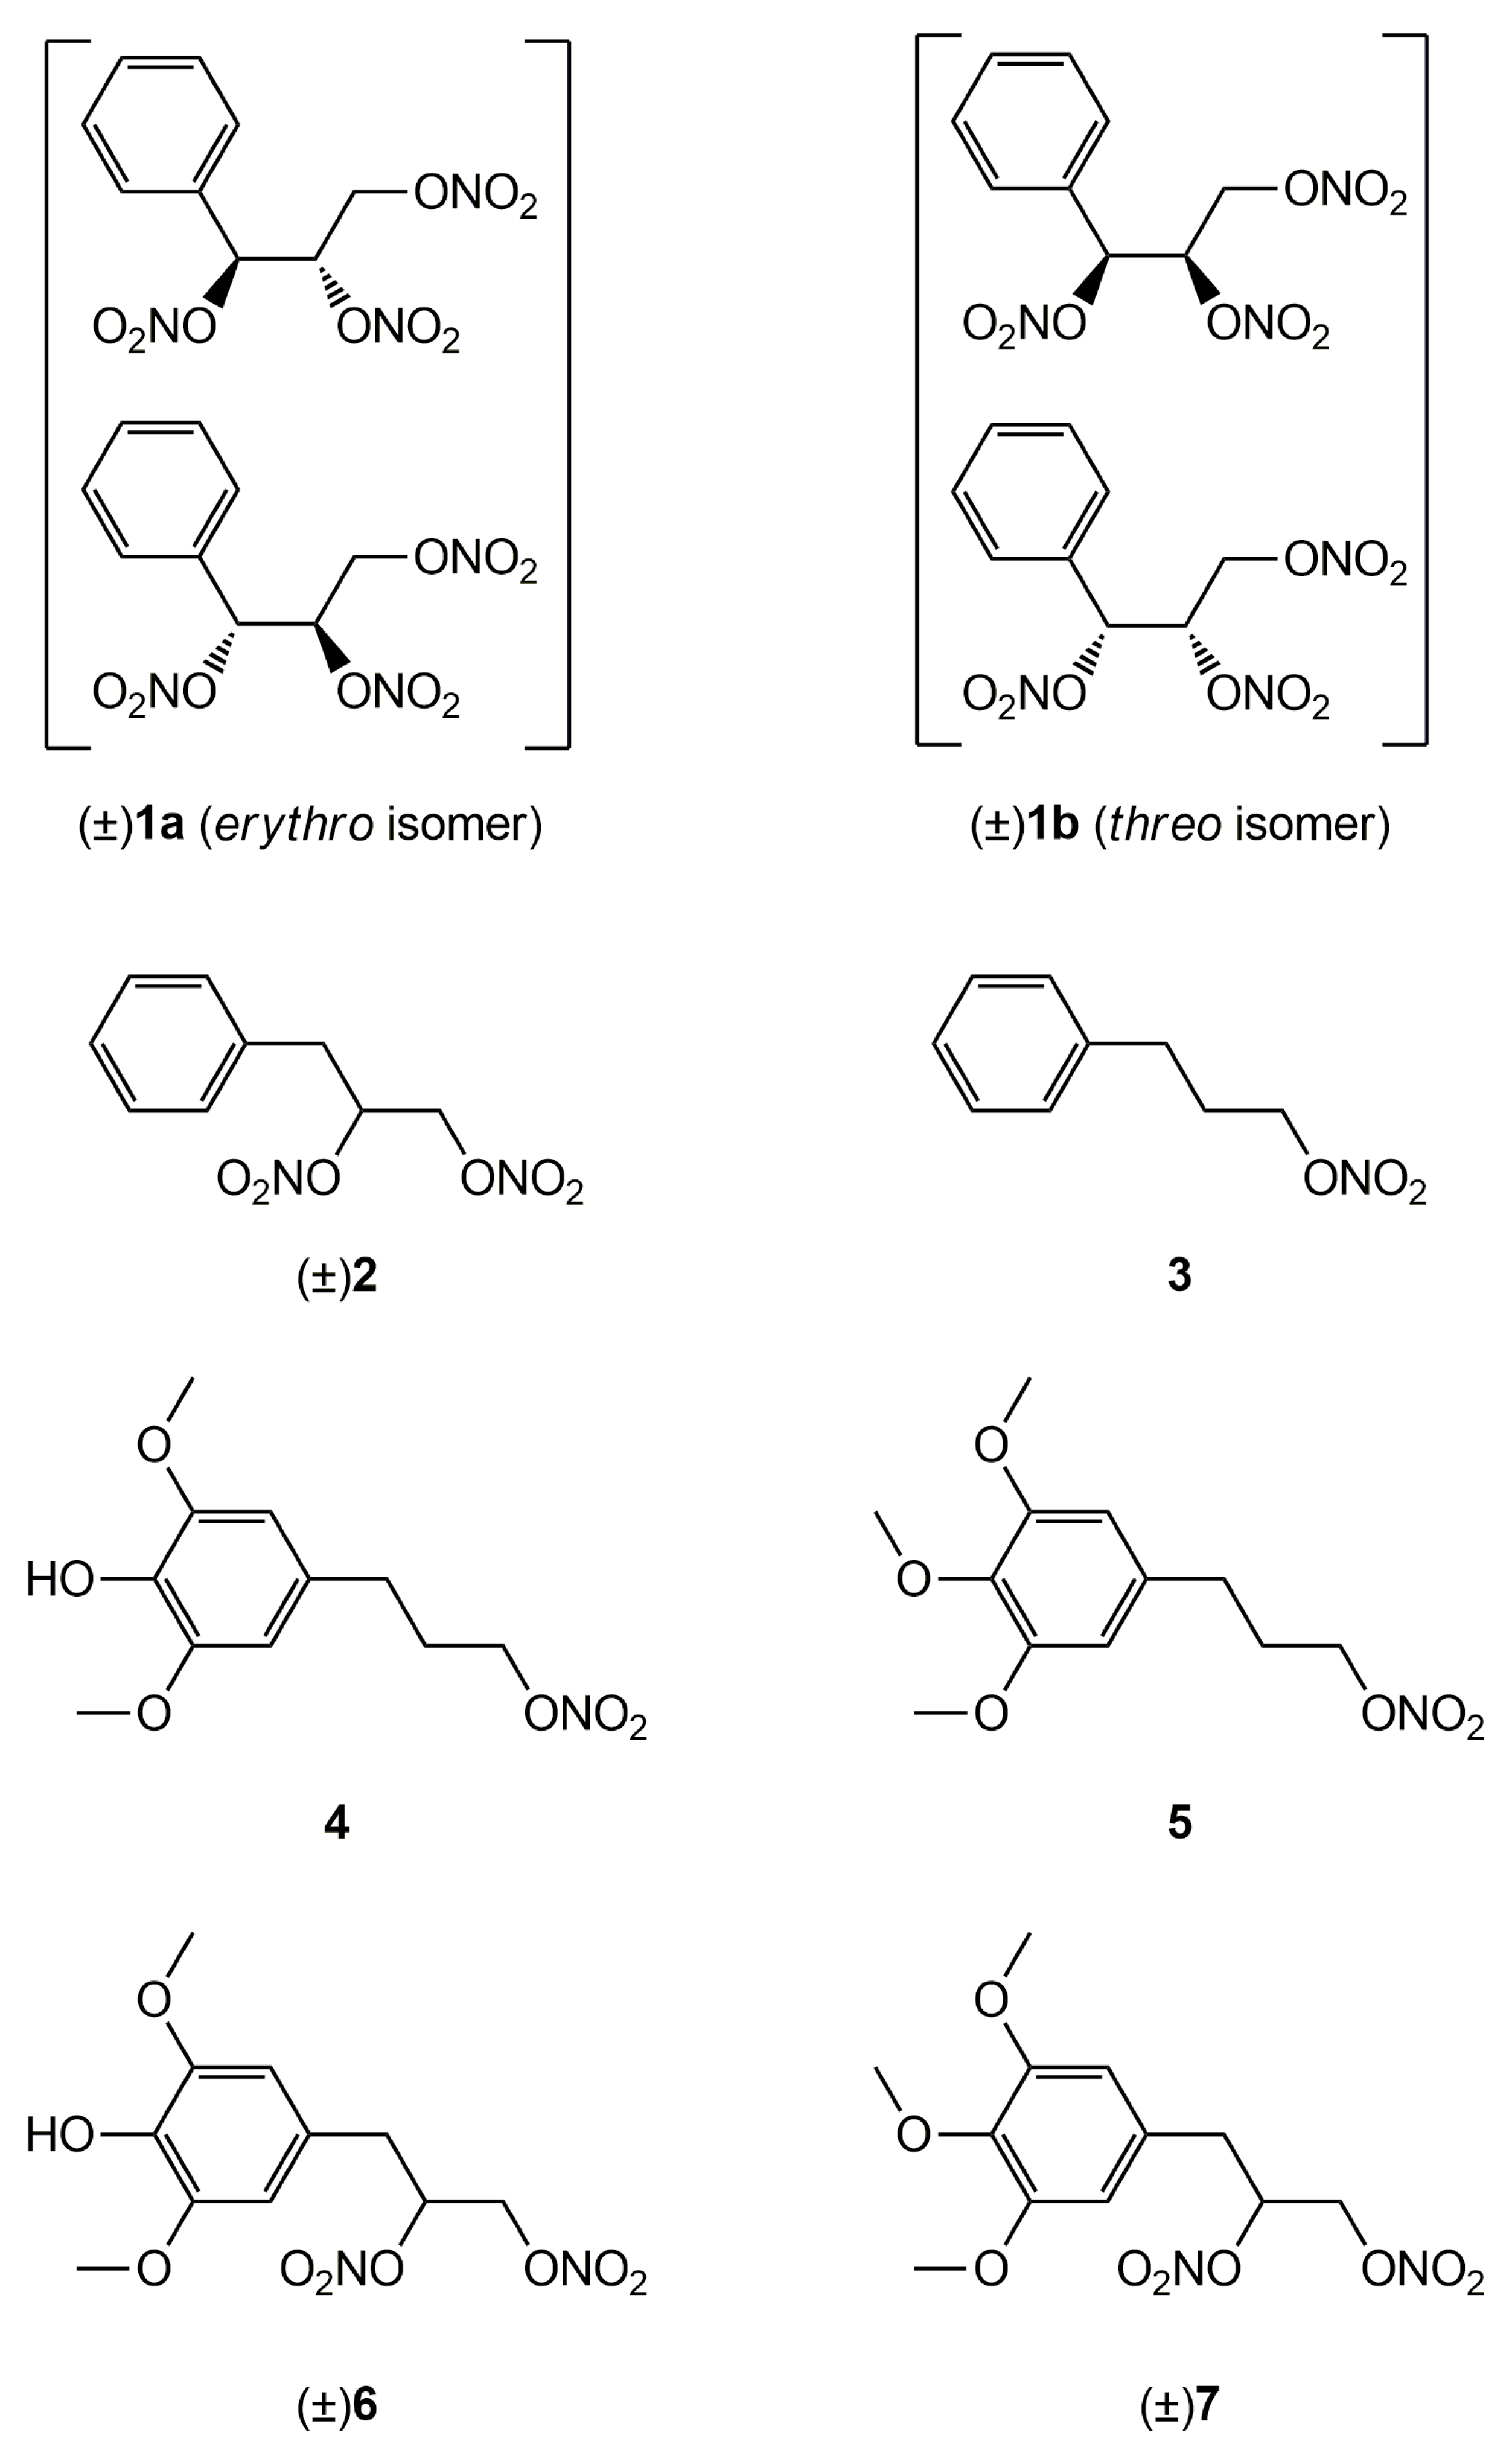
Figure 1.
Structures of previously developed compounds
1
–
3
,
4
,
6
and newly synthesized compounds
5
and
7
.
2. Vasodilating Activity
2.1. In Vitro Experiments
Since NO predominantly modulates the tone of large conduit vessels
[25][26][29,30], the vasodilator activities of the nitrooxyphenylalkyl derivatives
4–
7, as well as those of GTN, taken as a reference, were assessed on rat aorta strips precontracted with 1 μM L-phenylephrine. The endothelium was removed in order to study the vasodilation effects only due to the direct action of NO-donor organic nitrates. All the products were able to dilate the strips in a concentration-dependent manner. Their potencies as vasodilators, expressed as pEC
50, are collected in
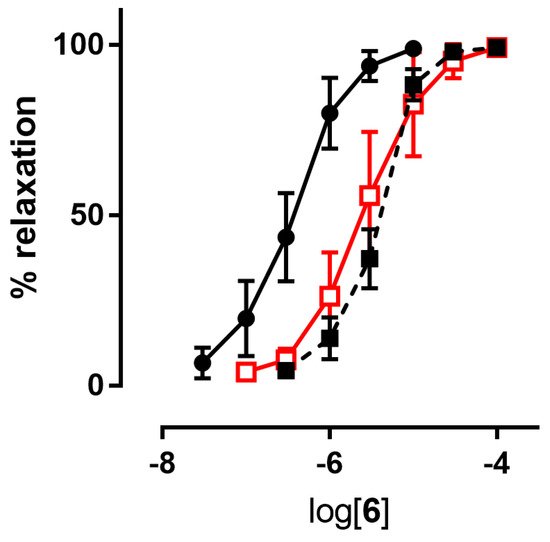
Table 12. Inhibitors of ALDH-2 (chloral hydrate and benomyl) shifted the concentration–response curves of all nitrooxy derivatives to higher concentrations. An example of a concentration–response curve is reported in
Figure 2. pEC
50 values obtained in presence of inhibitors of ALDH-2 are reported in
Table 12.
Figure 2. Example of
a concentration-response curve: compound
6 in the absence (black ●) and in the presence of inhibitors of ALDH-2 (1 µM benomyl (black ■), 1 mM chloral hydrate (red □)).
Table 12.
Vasodilating activity of nitrooxyphenylalkyl derivatives and GTN.
| |
In Vitro Experiments
pEC50 ± SE |
Ex Vivo Experiments
pEC50 ± SE |
| Compd |
|
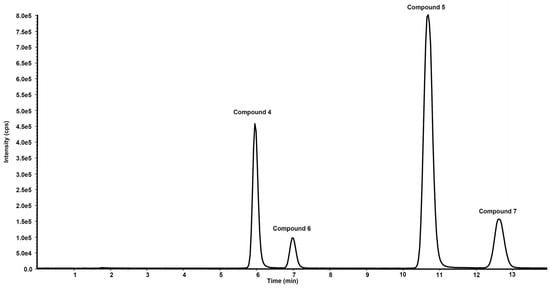
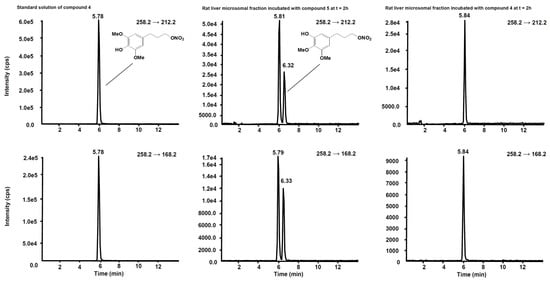
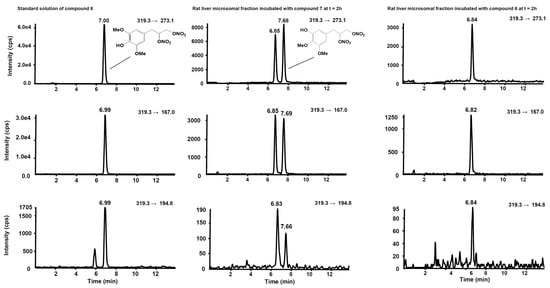
6, confirming that they are metabolic products of compounds 5 and 7, respectively (Figure 7 and Figure 8).
Figure 6. Chromatographic profile in total ion current of the ion precursor–ion products transitions reported in
Table 21 of a standard solution of compounds
4,
5,
6 and
7 at the concentration of 10 µg/mL.
Table 2. Mass spectrometric acquisition parameters for the multiple reaction monitoring operating mode.
| Compd |
Precurson Ion (m/z) |
Declustering Potential (V) |
Entrance Potential (V) |
Product Ions |
Collision Energy (V) |
Collision Cell Exit Potential (V) |
+ Benomyl 1 |
+ Chloral
Hydrate 2 |
Control |
Tolerant
Vessels |
| 1a |
6.68 ± 0.08 3 |
6.49 ± 0.10 3 |
| 4 | |
6.92 ± 0.06 |
6.80 ± 0.05 |
| 258.2 |
30 |
4 |
258.2 → 212.2 |
12 |
15 |
1b |
6.66 ± 0.07 3 |
6.46 ± 0.10 3 |
6.57 ± 0.03 |
| 258.2 → 168.2 | 3 |
6.70 ± 0.12 |
6.49 ± 0.06 |
| 22 |
15 |
2 |
7.20 ± 0.15 3 |
6.20 ± 0.12 3 |
5.92 ± 0.3 3 |
7.71 ± 0.11 |
6.67 ± 0.09 4 |
| 3 |
| 5 |
272.1 |
29 |
8 |
272.1 → 226.2 |
13 |
18 |
6.80 ± 0.07 3 |
5.82 ± 0.5 3 |
5.52 ± 0.5 3 |
7.36 ± 0.04 |
6.40 ± 0.06 5 |
| 272.1 → 182.2 |
20 |
14 |
4 |
5.48 ± 0.09 |
4.85 ± 0.07 |
4.79 ± 0.11 |
5.48 ± 0.08 |
5.49 ± 0.05 |
| 272.1 → 211.1 |
22 |
20 |
5 |
5.52 ± 0.09 |
4.72 ± 0.07 |
4.68 ± 0.03 |
| 6 | 5.64 ± 0.08 |
5.22 ± 0.05 | 6 |
| 319.3 |
63 |
9 |
319.3 → 273.1 |
10 |
18 |
6 |
6.19 ± 0.09 |
5.48 ± 0.08 |
5.59 ± 0.16 |
6.16 ± 0.04 |
6.06 ± 0.03 |
| 7 |
6.62 ± 0.10 |
5.58 ± 0.08 |
5.52 ± 0.06 |
6.55 ± 0.07 |
5.88 ± 0.02 7 |
| GTN |
7.54 ± 0.043 |
6.38 ± 0.07 3 |
6.03 ± 0.05 3 |
7.52 ± 0.04 |
6.10 ± 0.08 |
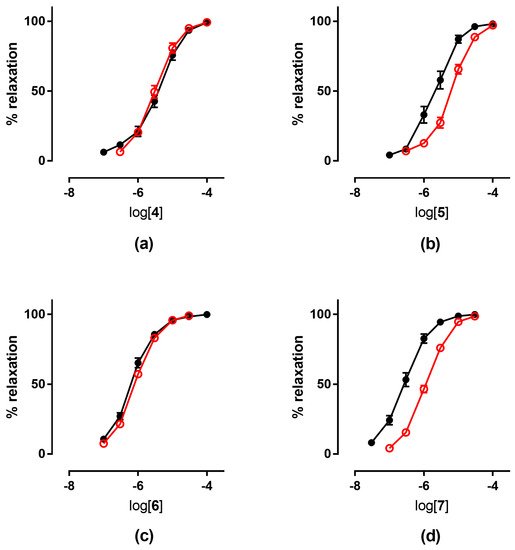
2.2. Ex Vivo Experiments
The tolerance profile of all the nitrates described in the present work was evaluated using a method described in the literature
[27][31]. Nitrate tolerance was induced in rats by subcutaneous injection of 50 mg/kg/die GTN, or equimolar doses of nitrooxy derivatives, for consecutive 3 days. Control animals were treated with vehicle only, saline solution for GTN and DMSO for tested compounds. At the end of the treatment period, thoracic aortas were removed and immediately used for functional studies. pEC
50 values are reported in
Table 12. GTN and compounds
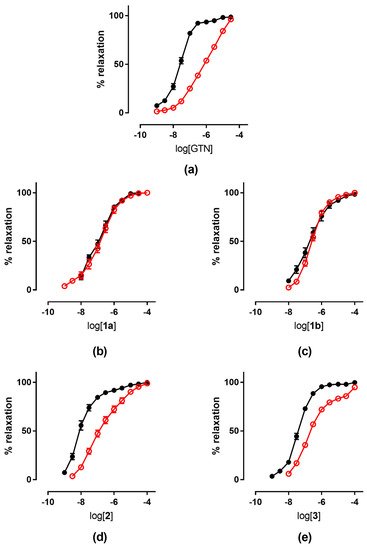
2 and
3 induced a strong development of tolerance, while vessels treated with compounds
1a and
1b did not show a significant rightward shift of the concentration–response curves (
Figure 3). Nitrooxy derivatives
4 and
6, endowed with antioxidant properties, did not determine the onset of tolerance (
Figure 4a,c). On the contrary, the treatment with compounds
5 and
7 induced a weak development of tolerance (
Figure 4b,d).
Figure 3. Concentration-response curves of GTN and nitrooxyphenylalkyl derivatives in control experiments (black ●) and tolerant vessels (red ○). (
a) GTN; (
b) compound
1a; (
c) compound
1b; (
d) compound
2; (
e) compound
3.
Figure 4. Concentration-response curves in control experiments (black ●) and tolerant vessels (red ○) of: (
a) compound
4; (
b) compound
5; (
c) compound
6; (
d) compound
7.
3. Metabolism
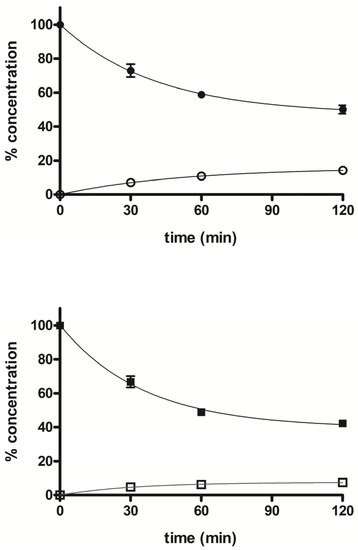
The stability profile of compounds 5 and 7 was studied in rat liver microsomal fractions in the presence of a NADPH-regenerating system. RP-HPLC analysis allowed the determination and quantification of the starting products and the expected demethylated metabolites 4 and 6, which were formed during incubation. After 2 h incubation, the % of unchanged compounds 5 and 7 were about 50% and 42%, respectively, and the % of the demethylated derivatives 4 and 6 were about 14% and 7%, respectively. Figure 5 shows the concentration trend for all compounds (4–7) during the incubation time.
Figure 5. Time course of percent concentration of
5 (●),
7 (■) and its demethylated metabolites
4 (○) and
6 (□), respectively, in rat liver activated microsomal fractions during 2 h incubation; values are means ± SEM (SEM < 1;
n = 3).
Figure 6 shows the chromatogram of a standard solution of compounds 4, 5, 6 and 7 reported as total ion current (TIC). After two hours’ incubation of compounds 5 and 7 in the rat liver microsomal fraction, four peaks appeared in tandem mass chromatograms relative to the precursor–product ions transitions selected to detect the main metabolites, compounds 4 and 6, respectively. Two of these signals are relative to compounds 4 and 6 while the other two peaks are possibly attributed to their structural isomers, namely compounds 4-iso and 6-iso, carrying the demethylated hydroxyl group in the meta-position with respect to the propyl-nitrate group. The latter peaks were not present in the chromatogram of the rat liver microsomal fraction incubated with compounds 4 or
| 319.3 → 167.0 |
| 18 |
| 16 |
| 319.3 → 194.8 |
19 |
25 |
| 7 |
333.2 |
40 |
9 |
333.2 → 181.0 |
18 |
15 |
| 333.2 → 167.1 |
34 |
30 |
| 333.2 → 223.2 |
17 |
17 |
Figure 7. Schemes following the same formatting chromatographic profiles of the two SRM transitions distinctive for compound
4. (
Left) Standard solution of compound
4 at the concentration of 10 µg/mL. (
Centre) Rat liver microsomal fraction after two hours’ incubation with compound
5. (
Right) Rat liver microsomal fraction after two hours’ incubation with compound
4.
Figure 8. Chromatographic profiles of the three SRM transitions distinctive for compound
6. (
Left) Standard solution of compound
6 at the concentration of 10 µg/mL. (
Centre) Rat liver microsomal fraction after two hours’ incubation with compound
7. (
Right) Rat liver microsomal fraction after two hours’ incubation with compound
6.
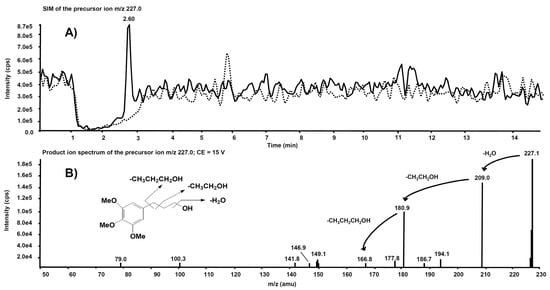
Interesting results, obtained by product ion scan mode analysis, were observed from the product ion spectra obtained after the isolation of m/z 227.0 on Q1. This precursor ion is likely to represent the molecular ion of an alleged metabolite of 5, obtained by de-nitration of the side chain. Figure 9A reports the comparison of the m/z 227.0 chromatographic profiles obtained from the rat liver microsomal fraction before the incubation with compound 5 (dotted line) and after two hours’ incubation (continuous line). A chromatographic peak is evident at the retention time of 2.60 min only in the second profile, viz. after two hours’ incubation. The corresponding product ion spectrum, depicted in Figure 9B, exhibits the loss of consecutive fragments from the side chain and it is compatible with the supposed metabolite’s structure.
Figure 9. (
A) Superimposed mass chromatograms of the
m/
z 227.0 precursor ion, obtained from the rat liver microsomal fraction at t = 0 (dotted line) and t = 2 h (continuous line) incubation with compound
5. (
B) Product ion spectrum of the selected
m/z 227.0 precursor, collected at 2.60 min, from the latter analysis.
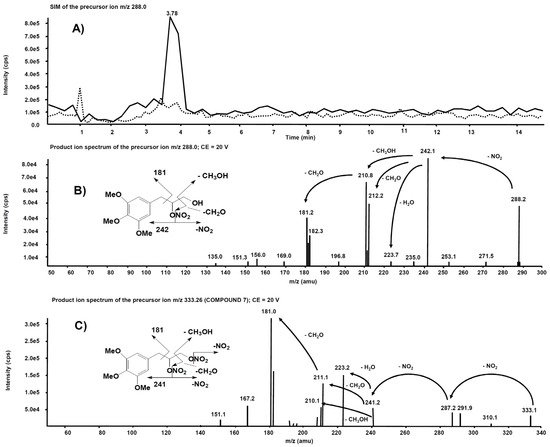
Analogue experiments were executed on the rat liver microsomal fraction incubated with compound 7. The m/z 288.0 precursor ion isolated on Q1 corresponds to the molecular ion of the alleged metabolite 7 obtained after single de-nitration of the side chain. Figure 10A reports the comparison of the m/z 288.0 chromatographic profiles obtained from the rat liver microsomal fraction before the incubation with compound 7 and after two hours, respectively. This time, a chromatographic peak is evident at the retention time of 3.78 min only in the profile from the rat liver microsomal fraction collected after two hours’ incubation. The corresponding product ion spectrum, depicted in Figure 10B, exhibits a fragmentation similar to Figure 9B. The product ion spectrum of 7 is also reported (Figure 10C) for comparison: several fragmentations similar to those present in the product ion spectrum of its alleged metabolite are indeed observed.
Figure 10. (
A) Superimposed mass chromatograms of the
m/
z 288.0 precursor ion, obtained from the rat liver microsomal fraction at t = 0 (dotted line) and t = 2 h (continuous line) incubation with compound
7. (
B) Product ion spectrum of the selected
m/z 288.0 precursor, collected at 3.78 min, from the latter analysis. (
C) Product ion spectrum of the selected
m/z 333.26, a precursor of compound
7.
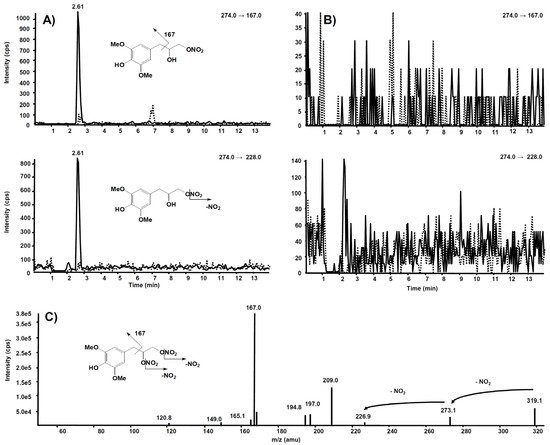
The same experiment was also executed on a rat liver microsomal fraction incubated with compound 6. The m/z 274.0 precursor ion was isolated on Q1, representing the molecular ion of a hypothetic compound 6 metabolite obtained by a single de-nitration from the side chain: in this case, no signal was observed in the chromatogram.
Further and more sensitive experiments were conducted by selecting the two most probable precursor–product ion SRM transitions, namely m/z 274→228 (loss of NO2) and m/z 274→167 (losses from the side chain), likewise fragmentation is observed in compound 6. Figure 11A reports the comparison between the two SRM transitions obtained from the rat liver microsomal fraction, before the incubation with compound 6 and after two hours, respectively. From this experiment of enhanced sensitivity, a high chromatographic peak is evident at the retention time of 2.61 min only in the profile collected after two hours’ incubation. The same experiment was executed on the rat liver microsomal fraction incubated with compound 7, to confirm that m/z 274.0 corresponds to a metabolite of compound 6, not produced from compound 7 (Figure 11B).
Figure 11. Chromatographic profiles of two plausible SRM transitions for a metabolite of compound
6. (
A) Rat liver microsomal fraction at t = 0 (dotted line) and t = 2 h (continuous line) incubation with compound
6. (
B) Rat liver microsomal fraction at t = 0 (dotted line) and t = 2 h (continuous line) incubation with compound
7. (
C) Product ion spectrum of the selected
m/z 319.10, precursor of compound
6.

