Alzheimer’s disease (AD) includes the formation of extracellular deposits comprising aggregated β-amyloid (Aβ) fibers associated with oxidative stress, inflammation, mitochondrial abnormalities, and neuronal loss. There is an associative link between AD and cardiac diseases; however, the mechanisms underlying the potential role of AD, particularly Aβ in cardiac cells, remain unknown. Here, we investigated the role of mitochondria in mediating the effects of Aβ1-40 and Aβ1-42 in cultured cardiomyocytes and primary coronary endothelial cells. Our results demonstrated that Aβ1-40 and Aβ1-42 are differently accumulated in cardiomyocytes and coronary endothelial cells. Aβ1-42 had more adverse effects than Aβ1-40 on cell viability and mitochondrial function in both types of cells. Mitochondrial and cellular ROS were significantly increased, whereas mitochondrial membrane potential and calcium retention capacity decreased in both types of cells in response to Aβ1-42. Mitochondrial dysfunction induced by Aβ was associated with apoptosis of the cells. The effects of Aβ1-42 on mitochondria and cell death were more evident in coronary endothelial cells. In addition, Aβ1-40 and Aβ1-42 significantly increased Ca2+ -induced swelling in mitochondria isolated from the intact rat hearts. In conclusion, this study demonstrates the toxic effects of Aβ on cell survival and mitochondria function in cardiac cells.
1. Introduction
Alzheimer’s disease (AD) is a progressive neurodegenerative disorder that is expected to affect 13 million individuals, mostly older adults, in the U.S. by 2050
[1]. The main pathological characteristics of AD are the formation of extracellular deposits comprising aggregated β-amyloid (Aβ) fibers and intracellular neurofibrillary tangles formed by hyperphosphorylated tau protein. These alterations are associated with the loss of synapses, mitochondrial structural and functional abnormalities, oxidative stress, inflammation, and neuronal loss. A growing body of experimental and clinical studies demonstrate an associative link between AD and cardiac diseases such as heart failure, ischemic heart disease, and atrial fibrillation
[2]. It has been proposed that cardiac dysfunction leads to cerebral hypoperfusion (hypoxia) associated with brain oxidative stress and acidosis that, in combination with Aβ aggregation, provoke neuronal degradation and progression of AD
[3]. Oxidative stress can induce further production of Aβ and tau protein, another critical component involved in the pathogenesis of AD
[4]. These studies suggest a feedback loop embedded in the crosstalk between oxidative stress and Aβ aggregation that stimulates the development and progression of AD. Although a causal role of cardiac dysfunction in AD progression can be explained, at least partially, by oxidative stress induced by decreased cerebral blood flow (hypoperfusion), it remains unclear whether AD
per se can increase the risk for developing cardiac abnormalities.
Protein misfolding plays a central role in the pathogenesis of AD, and recent studies identified Aβ aggregates in the heart of patients with heart failure and dilated cardiomyopathy
[5][6][7][5,6,7]. It has been suggested that Aβ oligomers may compromise cardiac function and lead to cardiovascular disease, the second leading cause of death (after pneumonia) in patients with AD
[8]. Aβ
1-40 and Aβ
1-42, structurally similar to those found in the brain and similar amounts in the heart of AD patients, are associated with diastolic cardiac dysfunction
[6]. Moreover, AD shares similar risk factors and common genetic profiles with cardiac diseases
[5][9][5,9]. Mutations in
PSEN1 and
PSEN2, associated with familial AD, and the apolipoprotein E ε4 allele, a risk factor for AD, were found in patients with dilated cardiomyopathy
[5][10][5,10]. AD patients lacking symptomatic cardiovascular diseases exhibit cardiac dysfunction, including increased diastolic dysfunction and left ventricular wall thickness
[6][11][12][13][6,11,12,13], as well as electrocardiographic abnormalities
[12]. In patients with AD, Aβ
1-40 and Aβ
1-42 aggregates were found in the cardiomyocytes and interstitial spaces associated with cardiac dysfunction
[6]. Plaque-like amyloid deposits observed in cardiomyopathy
[5] could induce proteotoxicity and cell death in the heart
[14]. However, despite a broad range of studies, the causal role of AD and amyloidosis in the development of cardiac abnormalities remains unknown. In addition, the source of the Aβ protein aggregates in the hearts of patients with AD is not entirely understood. However, high levels of Aβ
1-40 oligomers have been detected in the cerebrospinal fluid of AD patients
[15], and an increase in Aβ oligomers in peripheral plasma is now starting to be considered as a potential biomarker for AD
[16]. Therefore, there is a potential for these toxic aggregation species to reach the heart. Although it is not yet clear how AD affects cardiac function, patients with AD are at increased risk for developing cardiac abnormalities.
The mechanisms of cell damage induced by Aβ are still subject to investigation; several lines of evidence demonstrate toxic intracellular effects of Aβ and suggest a role of the mitochondria in mediating these effects (reviewed in
[17][18][19][17,18,19]). Aβ was found in the mitochondria of patients with AD
[4][20][4,20] and increased Aβ aggregation was associated with mitochondrial dysfunction
[21]. Together with oxidative stress and altered Ca
2+ homeostasis, mitochondrial abnormalities have been shown to mediate neuronal dysfunction and cell death in AD patients and animal models of Aβ and tau pathology
[22][23][22,23]. Mitochondrial dysfunction also mediates cerebral microvascular endothelial cell death induced by Aβ oligomers
[21][24][25][21,24,25]. Mitochondria-mediated apoptosis can also be initiated by the effects of Aβ oligomeric species on membrane death receptors, such as DR4 and DR5, which trigger the extrinsic, and consequently the intrinsic, apoptotic pathways
[26]. However, whether mitochondrial alterations act as a causal event and contribute to the etiology of AD or result from the disease pathology remains unknown. Notably, most of the studies elucidating the effect of Aβ on mitochondria have been conducted on brain tissue and neuronal or other brain cells, and thus, the mechanisms of Aβ production and its possible effects on cardiac cells remain unknown.
2. Beta-Amyloid Instigates Dysfunction of Mitochondria in Cardiac Cells
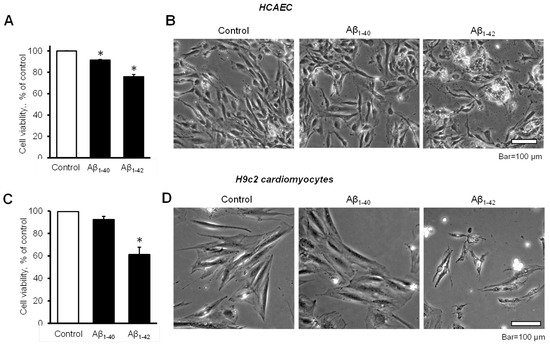
2.1. Aβ Decreased Cell Viability and Impaired Cell Morphology
The cell viability of HCAEC grown in the culture media containing 10 µM Aβ
1-40 or Aβ
1-42 for 20 days was significantly decreased in comparison with control cells. The cell viability of Aβ
1-40 or Aβ
1-42 groups were 8.6% and 24% lower (
p < 0.05) than the control, respectively (
Figure 1A). Morphological analysis using phase-contrast microscopy in Aβ
1-42-treated cells revealed irregular-shaped lumps appearing bright compared to the control and Aβ
1-40-treated cells (
Figure 1B). Incubation of H9c2 cardiomyocytes with 10 µM Aβ
1-42 for 96 h resulted in a 39% (
p < 0.05) decrease of cell viability, whereas Aβ
1-40 reduced the cell viability only by 8% (
Figure 1C). H9c2 cells challenged with Aβ
1-42 showed abnormally shrinking cell morphology, in addition to abnormal bright aggregates (
Figure 1D).
Figure 1. Aβ decreased cell viability and impaired cell morphology (A,B): Primary HCAEC grown for 20 days in the presence and absence of 10 µM Aβ1-40 or Aβ1-42. (A): Cell viability. n = 4 per group. * p < 0.05 vs. control. (B): Representative phase-contrast images of control (vehicle: DMSO) cells and cells grown with 10 μM Aβ1-40 or Aβ1-42. Bar = 100 µm (C,D): H9c2 cardiomyocytes grown with Aβ1-40 or Aβ1-42 for 96 h. (C): Cell viability. n = 4 per group. * p < 0.05 vs. control. (D): Representative images of control (vehicle: DMSO) cells and cells grown with 10 μM Aβ1-40 or Aβ1-42. Bar = 100 µm.
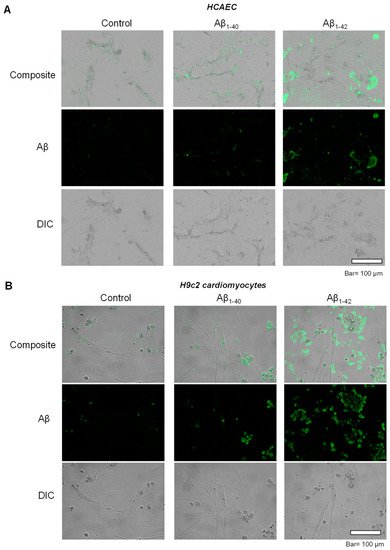
2.2. Aggregated Aβ Accumulated Inside of Cells
To investigate the possible inclusion of Aβ aggregates in subcellular compartments, primary HCAEC and H9c2 cardiomyocytes incubated with Aβ
1-40 or Aβ
1-42 were visualized using immunocytochemistry. Control primary HCAEC showed only low perinuclear signal, which could indicate a low level of Aβ and/or background staining, whereas Aβ
1-40-treated cells demonstrated the higher intensity of the cytoplasmic signal. Primary HCAEC challenged with Aβ
1-42 showed a strong signal of irregular-shaped aggregates with a size of 1–50 µm (
Figure 2A). Similar patterns of intracellular aggregation of Aβ were observed in H9c2 cells. The control group showed low perinuclear signal, whereas cells grown with Aβ
1-40 showed more cytoplasmic signal (in addition to the nuclei) compared to the control. Cells grown with Aβ
1-42 showed irregular-shaped aggregates in the cytoplasm (
Figure 2B) that were absent in the control.
Figure 2. Accumulation of aggregated Aβ. (A): Immunostaining of Aβ in primary HCAEC grown with 10 µM Aβ1-40 or Aβ1-42 for 20 days. Bar= 100 µm (B): Immunostaining of Aβ in H9c2 cardiomyocytes grown with 10 µM Aβ1-40 or Aβ1-42 for 96 h. Bar = 100 µm.
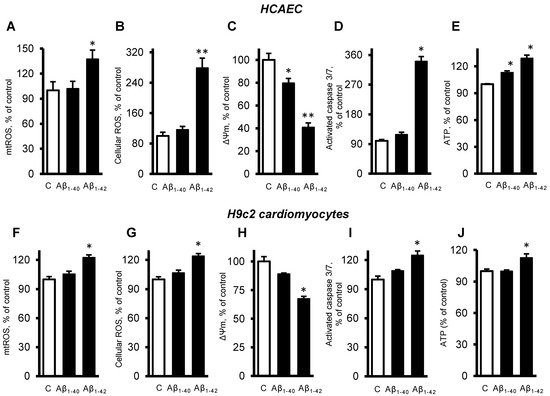
2.3. Aβ Induced Mitochondrial and Cellular Dysfunction
Next, we investigated the role of mitochondria in the cells exposed to Aβ. The primary HCAEC incubated with 10 µM Aβ
1-42 for 20 days showed a 37% (
p < 0.05) increase of mtROS, and a 179% (
p < 0.01) increase of cellular (total) ROS, compared to the control cells (
Figure 3A,B). Aβ
1-40 and Aβ
1-42 induced depolarization of the mitochondrial membrane as evidenced by decreased ΔΨm. The primary HCAEC treated with Aβ
1-40 and Aβ
1-42 showed a 20% (
p < 0.05) and 41% (
p < 0.01) decrease of ΔΨm, respectively, in comparison with the control (
Figure 3C). Aβ
1-42 induced a 2.4-fold (
p < 0.01) increase of activated caspase 3/7, indicating increased apoptosis (
Figure 3D). Interestingly, Aβ
1-40 and Aβ
1-42 increased ATP levels by 13% and 29% (
p < 0.01), respectively (
Figure 3E). Similar trends in cellular and mitochondrial parameters were observed in H9c2 cells. The cells incubated with 10 µM Aβ
1-42 for 20 days showed a 22% (
p < 0.01) increase of mtROS, and a 24% (
p < 0.01) increase of cellular ROS, compared to the control cells (
Figure 3F,G). Aβ
1-42 decreased ΔΨ
m by 33% (
p < 0.05) in H9c2 cells (
Figure 3H), which showed 25% (
p < 0.01) more activated caspase 3/7 than the control cells (
Figure 3I). In H9c2 cells, only Aβ
1-42 increased the ATP levels by 13% (
p < 0.05), whereas Aβ
1-40 had no significant effects (
Figure 3J).
Figure 3. Aβ-induced mitochondrial and cellular dysfunction. (A–E): Primary HCAEC cultured for 20 days in the presence and absence of 10 µM Aβ1-40 or Aβ1-42. (A): mtROS levels measured by MitoSOX Red (Thermo Fisher). (B): Cellular ROS levels measured using Ampiflu Red (Sigma) in permeabilized cells. (C): ΔΨm measured by JC-1 (Thermo Fisher). (D): Activated caspase 3/7 levels measured using the CellEvent™ Caspase-3/7 Green Detection Reagent (Thermo Fisher). (E): ATP levels measured by ATP-Red (Sigma). (F–J): H9c2 cardiomyocytes cultured for 96 h in the presence or absence of 10 µM Aβ1-40/Aβ1-42. All parameters were measured by the same methods used for primary HCAEC (A–E). (F): mtROS levels. G: Cellular ROS levels. (H): ΔΨm. (I): Activated caspase 3/7 levels. (J): ATP levels. n = 4 per group for all parameters of primary HCAEC and H9c2 cardiomyocytes. * p < 0.05, ** p < 0.01 vs. control (C).
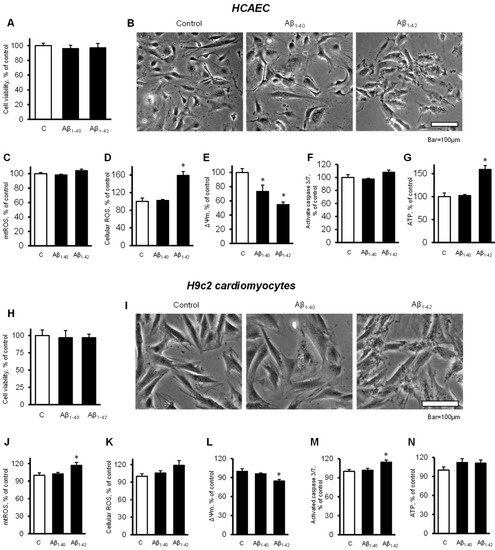
2.4. Cells and Mitochondria Demonstrated Early Response to Aβ
To elucidate the possible cause of the Aβ-induced cell death, we investigated the earlier changes that could predispose the cells and mitochondria to further functional alterations leading to cell death. Incubation of primary HCAEC with 10 µM Aβ
1-40 or Aβ
1-42 for 48 h did not decrease the cell viability compared to the control (
Figure 4A). Analysis of cellular morphology revealed that Aβ
1-42 increased dark, grainy aggregates in the cell cytoplasm that were not observed in the control and Aβ
1-40-treated groups (
Figure 4B). Aβ
1-42 did not affect mtROS levels after 48 h, but it increased cellular ROS by 59% (
p < 0.05) (
Figure 4C,D). In addition, mitochondria were found depolarized in the cells incubated with Aβ
1-40 or Aβ
1-42 that demonstrated 27% (
p < 0.05) and 45% (
p < 0.05) fewer ΔΨ
m for Aβ
1-40 and Aβ
1-42, respectively, in comparison with the control (
Figure 4E). No significant increase in caspase activation was observed in the presence of the Aβ (
Figure 4F). Aβ
1-42 increased ATP levels by 59% (
p < 0.05) while Aβ
1-40 did not affect ATP (
Figure 4G). Likewise, the H9c2 cells incubated with 10 µM Aβ
1-40 or Aβ
1-42 for 48 h did not show any change in cell viability (
Figure 4H).
Figure 4. Cells and mitochondria demonstrated early response to Aβ. (A–G): Primary HCAEC grown for 48 h in the presence and absence of 10 µM Aβ1-40 or Aβ1-42. (A): Cell viability after 48 h of treatment. n = 4 per group. (B): Representative phase-contrast images of control (vehicle: DMSO) cells and cells treated with 10 μM Aβ1-40 or Aβ1-42 for 48 h. Bar = 100 µm (C): mtROS levels (D): Cellular ROS levels. (E): ΔΨm. (F): Activated caspase 3/7 levels. (G): ATP levels. (H–N): H9c2 cardiomyocytes grown for 48 h in the presence and absence of 10 µM Aβ1-40 or Aβ1-42. (H): Cell viability after 48 h of treatment. (I): Representative phase-contrast images of cells. Bar = 100 µm (J): mtROS levels (K): Cellular ROS levels. (L): ΔΨm. (M): Activated caspase 3/7 levels. (N): ATP levels. n = 4 per group for all parameters of primary HCAEC and H9c2 cardiomyocytes. * p < 0.05 vs. control (C).
Cardiomyocytes also showed dark, grainy aggregates in the cytoplasm of incubated with Aβ
1-42 for 48 h. The control and Aβ
1-40-treated groups did not show remarkable changes in morphology (
Figure 4I). Aβ
1-42 induced a 17% (
p < 0.05) increase of mtROS and a 19% (
p > 0.05) increase of cellular ROS after 48 h of incubation (
Figure 4J,K). Aβ
1-42 induced a 15% (
p < 0.05) decrease of the ΔΨm (
Figure 4L) and increased caspase 3/7 activation by 15% (
p < 0.05) compared with the control (
Figure 4M). Both Aβ
1-40 and Aβ
1-42 had no significant effect on the ATP levels in H9c2 cells (
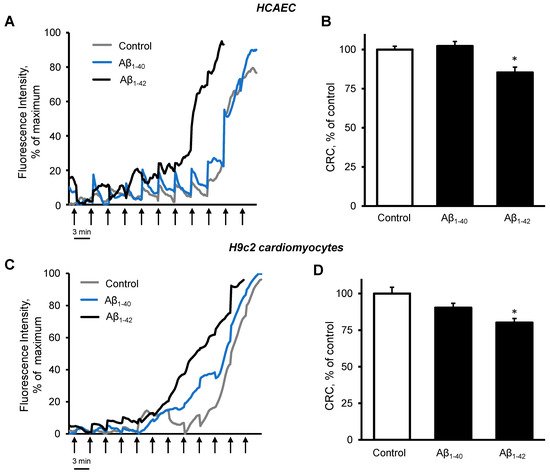
Figure 4N). Analysis of mitochondrial CRC demonstrated high sensitivity of the cells to Aβ
1-42. Incubation of primary HCAEC with 10 µM Aβ
1-42 for 48 h decreased the mitochondrial CRC by 15% (
p < 0.05) compared to control cells (
Figure 5A,B). Likewise, 10 µM Aβ
1-42 induced a 20% (
p < 0.05) decrease of the mitochondrial CRC in H9c2 cardioblasts (
Figure 5C,D). Aβ
1-40 did not affect the mitochondrial CRC in both types of cells.
Figure 5. Aβ1-42 decreased CRC. (A,B): Primary HCAEC grown for 48 h in the presence and absence of 10 µM Aβ1-40 or Aβ1-42. (A): Representative traces of the fluorescence intensity of Calcium Green 5N. (B): Quantification of CRC calculated from the burst cycles (cycles that showed the highest fluorescence signal increase). (C,D): H9c2 cardiomyocytes were grown for 48 h in the presence and absence of 10 µM Aβ1-40 or Aβ1-42. (C): Representative traces of the fluorescence intensity of Calcium Green 5N. (D): CRC was calculated from the burst cycles. The addition of 1 nmol calcium was done every 3 min (one cycle) at 37 °C. Assays without cells were used as a baseline. n = 6 per group. * p < 0.05 vs. control.
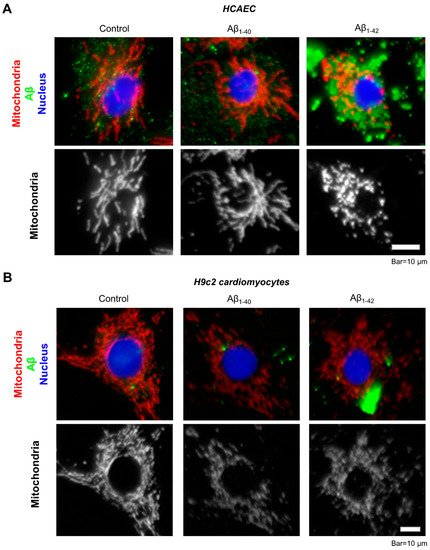
Immunocytochemical analysis of the primary HCAEC incubated with 10 µM Aβ
1-42 for 48 h showed aggregated Aβ throughout the cytoplasm (
Figure 6A, green). Mitochondria in Aβ
1-42-treated cells showed mostly fragmented mitochondria, whereas control cells and the cells incubated with Aβ
1-40 presented a well-organized mitochondrial network (
Figure 6A, white). Likewise, mitochondria were more fragmented in H9c2 cardioblasts incubated with 10 µM Aβ
1-42 for 48 h (
Figure 6B, white) and showed aggregated Aβ in the cytoplasm (
Figure 6B, green).
Figure 6. Visualization of Aβ aggregates and mitochondria by immunostaining. (A): Representative images of primary HCAEC. (B): Representative images of H9c2 cardiomyocytes. Primary HCAEC and H9c2 cardiomyocytes grown for 48 h in the presence and absence of 10 µM Aβ1-40 or Aβ1-42 were fixed and stained with anti-amyloid beta (green) and anti-ATP5A antibody (red). Nuclei were stained by DAPI. Bar = 10 µm.
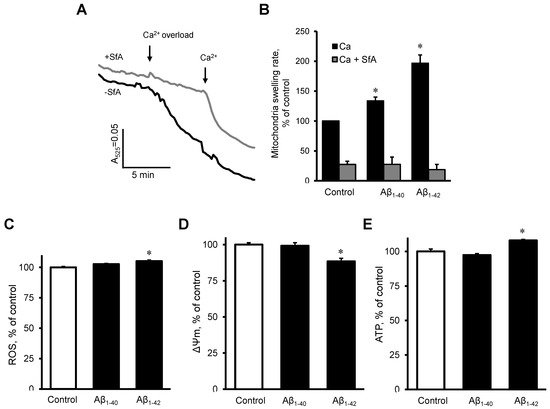
2.5. Aβ induced Dysfunction of Cardiac Mitochondria In Vitro
To investigate the possible direct effects of Aβ on the mitochondria, we measured mitochondrial swelling rates, mtROS, ΔΨm, and ATP levels in mitochondria that were isolated from healthy rat hearts. The mitochondria were incubated with 10 µM Aβ
1-40 or Aβ
1-42 for 10 min. Results demonstrated that Aβ
1-40 and Aβ
1-42 further increased the Ca
2+ -induced mitochondrial swelling rate by 34% (
p < 0.05) and 97% (
p < 0.05), respectively, in comparison with the control (
Figure 7A,B). The swelling of mitochondria apparently was induced by mPTP opening since the addition of sanglifehrin A, a cyclophilin D inhibitor, completely prevented the mitochondrial swelling in control and Aβ-treated groups (
Figure 7B). Aβ
1-42 slightly (5%,
p < 0.05) increased mtROS (
Figure 7C), decreased the ΔΨm by 12% (
p < 0.05,
Figure 7D), and increased ATP levels (8%,
p < 0.05), (
Figure 7E). Aβ
1-40 did not induce any remarkable changes in mtROS, ΔΨm, and ATP levels.
Figure 7. The effect of Aβ on isolated cardiac mitochondria. (A,B): Isolated rat heart mitochondria were used to analyze mitochondria swelling. (A): Mitochondrial swelling measured as decrement of A525 during the first 2 min of the calcium overload. Sanglifehrin A (SfA), a cyclophilin D (an mPTP regulator) inhibitor, was used to demonstrate that the swelling was mediated by mPTP. (B): Quantification of mitochondrial swelling rate presented as a percentile of control. Aβ1-40 or Aβ1-42 were added 10 min before the experiment to 10 µM. 0.1% DMSO was used as a vehicle. n = 3–6 per group. (C): mtROS levels (D): ΔΨm. (E): ATP levels. n = 4 per group. * p < 0.05 vs. control.