Your browser does not fully support modern features. Please upgrade for a smoother experience.
Please note this is a comparison between Version 1 by Alexander Fedotov and Version 2 by Amina Yu.
Hyperspectral remote sensing provides image data with very high spectral resolution. This high resolution allows subtle differences in plant health to be recognized. Such a multidimensional data space, generated by hyperspectral sensors, has given rise to new approaches and methods for analyzing hyperspectral data.
- remote sensing
- hyperspectral
- plant diseases
- early detection
- oil palm
- citrus
- cereals
- solanaceae
1. Introduction
The spread of various, including invasive, plant diseases and pests is one of the most important problems in modern agriculture [1]. Therefore, to solve these relevant problems, the timely monitoring of plant diseases and pests is necessary. Remote sensing methods hold great promise for solving these problems [2]. Remote sensing data can identify crop conditions, including diseases, and provide useful information for specific agricultural management practices [3][4][3,4].
There are two types of remote sensing technologies: passive (such as optical) and active remote sensing (such as LiDAR and radar). Passive optical remote sensing is usually divided into two groups based on the spectral resolution of the sensors used: multispectral and hyperspectral remote sensing [5]. Hyperspectral sensing shows great potential as a non-invasive and non-destructive tool for monitoring biotic and abiotic plant stress among passive remote sensing methods, which measure reflected solar radiation [6]. This method collects and stores information from the spectroscopy of an object in a spectral cube that contains spatial information and hundreds of contiguous wavelengths in the third dimension. Hyperspectral imaging offers many opportunities for the early recognition of plant diseases by providing preliminary indicators through subtle changes in spectral reflectance due to absorption or reflection. Hyperspectral images with hundreds of spectral bands can provide detailed spectral portraits, hence, they are better able to detect subtle variations in soil, canopies or individual leaves. Thus, hyperspectral images can be used to solve a wider class of problems for the accurate and timely determination of the physiological status of agricultural crops. The early identification of disease spread and pest outbreaks may avoid not only significant crop loss, but also reduce pesticides usage and mitigate their negative impacts on human health and the environment, thus, improving the existing IPM [7][8][7,8].
In recent years, a wide range of miniature hyperspectral sensors available for commercial use have been developed, such as Micro- and Nano-Hyperspec (Headwall Photonics Inc., Boston, MA, USA), HySpex VNIR (HySpex, Skedsmo, Skjetten, Norway) and FireflEYE (Cubert GmbH, Ulm, Germany) [9]. These sensors can be installed on manned or unmanned airborne platforms (for example, airplanes, helicopters, and UAVs) to obtain hyperspectral imaging and support various monitoring missions [10][11][10,11].
There are various types of hyperspectral cameras, e.g., push-broom cameras, whisk-broom cameras and snapshot cameras. The measurement principle of each sensor type depends on its ability to obtain the whole picture (snapshot) at one time, one line of the picture (push broom) or one point of the picture (whisk broom) [12].
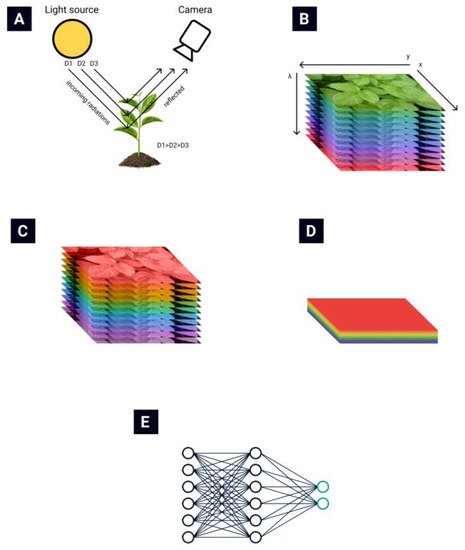
The general routine of collecting and processing hyperspectral images is presented in Figure 1. The light reflected from plant leaves is collected by the hyperspectral camera (Figure 1A) [13]. A hyperspectral data cube (Figure 1B) is obtained from the hyperspectral camera. Then various data normalization (Figure 1C) and feature extraction (Figure 1D) algorithms are applied to reduce the data’s dimensionality. Finally, different automatization techniques are used to automate the classification process (Figure 1E).
Hyperspectral remote sensing provides image data with very high spectral resolution [16][17][16,17]. This high resolution allows subtle differences in plant health to be recognized. Such a multidimensional data space, generated by hyperspectral sensors, has given rise to new approaches and methods for analyzing hyperspectral data [18][19][18,19].
For a long time, feature extraction methods have been used that reduce the data dimension without loss (or with minimal loss) of the original information on which the classification of hyperspectral images is based [20]. One of the most widely used dimensionality reduction techniques in HRS is principal component analysis (PCA). PCA computes orthogonal projections that maximize data variance and outputs the dataset in a new, uncorrelated coordinate system. Unfortunately, the informational content of hyperspectral images does not always coincide with such projections [21]. Thus, other methods are also used for feature extraction. The common methods for extracting hyperspectral data used in pathological research traditionally include PCA [22], derivative analysis [23], wavelet methods and correlation plots [24]. Alternatively, the hyperspectral image data can be processed at the image level to extract either spatial representation alone or joint spatial spectral information. If only spatial features are considered, for example, when studying structural and morphological features, spatial patterns among neighboring pixels with relation to the current pixel in the hyperspectral image will be extracted. Machine vision techniques, such as using a two-dimensional CNN, with a p × p chunk of input pixel data have been implemented to automatically generate high-level spatial structures. Extraction of spatial characteristics, in tandem with spectral elements, has been shown to significantly improve model performance. [25]. The use of spatial spectral characteristics can be achieved using two approaches: (i) by separately extracting spatial characteristics using CNN [26][27][26,27] and combining data from a spectral extractor using RNN, or LSTM [27][28][27,28]; and (ii) by using three-dimensional patterns in hyperspectral data cubes (p × p × b) associated with p × p spatially adjacent pixels and b spectral bands to take full advantage of important distinctive patterns.
2. Hyperspectral Remote Sensing for Early Plant Disease Detection
It was believed that, due to the lack of interaction between specialists in engineering and biology, there is a significant gap in the scientific basis for planning an experiment to use remote sensing data in determining plant state. Although the review above demonstrates the practical possibility of late and early detection of plant diseases using HRS, it also reveals differences in the technical results (range of important bands) between researchers, which indicates an insufficient study of the experimental methodology, as can be seen from Table 1, Table 2, Table 3 and Table 4.Table 1. Oil palm disease early detection by HRS.
| Publication Year | Culture | Treat | Equipment | Studied Bands | Important Bands | Study Type | Reference | Location |
|---|---|---|---|---|---|---|---|---|
| ] | ||||||||
| Malaysia | ||||||||
Table 2. Citrus disease early detection by HRS.
| Publication Year | Culture | Treat | Equipment | Studied Bands | Important Bands |
|---|
Table 3. Solanaceae disease early detection by HRS.
| Publication Year | Culture | Treat | Equipment | Studied Bands | Important Bands | Study Type | Reference | Location |
|---|
Table 4. Wheat disease early detection by HRS.
| Publication Year | Culture | Treat | EquipmentStudy Type | Reference | Studied Bands | Important Bands | Study TypeLocation | ||||||||||||
|---|---|---|---|---|---|---|---|---|---|---|---|---|---|---|---|---|---|---|---|
| Reference | Location | ||||||||||||||||||
| 2009 | oil palm | basal stem rot | APOGEE spectroradiometer of unmentioned model | 450–1100 | 715, 734, 791 | field | [29] | Malaysia | |||||||||||
| citrus greening | Spectra Vista SVC HR-1024 spectrometer | ||||||||||||||||||
| 2003 | tomato | late blight | Megatech GER-2600 spectrometer | 400–2500 | 750–930, 950–1030, 1040–1130 | field | [53] | USA | |||||||||||
| 2014 | |||||||||||||||||||
| 2000 | wheat | fusarium350–2500 | Specim Imspector V9 spectrometer combined with camera | 425–860 | not mentioned | lab | [ | 2009 | oil palm | tobacco | TSWV | Ocean Optics USB2000 spectrometer | 450–850 | 475.22, 489.37, 524.29, 539.65, 552.82, 667.33, 703.56, 719.31, 724.31, 758.39 | greenhouse | [54] | 500–533, 560–675, 682–733 | lab and field | [Bulgaria |
| 76 | ] | Germany | 2015 | tomato | late blight, early blight | ||||||||||||||
| 2015 | wheatSpecim Imspector V10E spectrograph combined with camera | 400–1000 | 442, 508, 573, 696, 715 | lab | fusarium | Headwall Photonics Hyperspec Model 1003B-10151 spectrometer combined with a camera[ | 520–1785 | 141155 | lab] | [77China | ] | lab | [49] | China | |||||
| Brazil | 2017 | tomato | gray mold | Specim Imspector V10E spectrograph combined with camera | |||||||||||||||
| 2018 | wheat | fusarium | Specim Imspector V10E and ImSpector N25E spectrographs380–1023 | 655, 746, 759–761 | lab | [ | 400–1000, 1000–250056] | 430–525, 560–710, 1115–2500 | greenhouse | [78]China | [79] | Germany | 2019 | citrus | citrus greening | Cubert S185 camera and ASD HandHeld 2 spectrometer | |||
| 2017 | tomato | 400–1000 | 544, 718, 753, 760, 764, 930, 938, 943, 951, 969, 985, 998, 999 | yellow leaf curl | Specim Imspector V10E spectrograph combined with camera | 450–1000field | [50] | China | |||||||||||
| 560–575, 712–729, 750–950 | lab | [ | |||||||||||||||||
| 2018 | wheat | fusarium, yellow rust | Gilden Photonics camera | 400–1000 | 650–70057] | China | lab, field | [80][81] | UK | 2020 | citrus | citrus greening | Cubert S185 camera & ASD HandHeld 2 spectrometer | 450–950, 325–1075 | 468, 504, 512, 516, 528, 536, 632, 680, 688, 852 | field | [51] | China | |
| 2017 | tobacco | TMV | Specim Imspector V10E spectrograph combined with camera | 450–1000 | 697.44, 639.04, 938.22, 719.15, 749.90, 874.91, 459.58, 971.78 | lab, greenhouse | [58][59] | 2020 | citrus | citrus greening | ASD HandHeld 2 spectrometer | 370–1000 | not mentioned | field | [52] | China |
| China | ||||||||||||||||||||||||||
| 2018 | ||||||||||||||||||||||||||
| tomato | late blight, target and bacterial spot | Spectra Vista SVC HR-1024 spectrometer | 350–2500 | 445, 450, 690, 707, 750, 800, 1070, 1200 | lab | [60] | USA | |||||||||||||||||||
| 2018 | tomato | TSWV | Specim Imspector V10E spectrograph combined with camera | 400–1000 | ||||||||||||||||||||||
| oil palm | orange spotting | ASD HandHeld 2 spectrometer | ||||||||||||||||||||||||
| 2012 | citrus | 537, 612, 638, 662, 688, 713, 763, 813, 998, 1066, 1120, 1148, 1296, 1445, 1472, 1546, 1597, 1622, 1746, 1898, 2121, 2172, 2348, 2471, 2493 | field | [44][45][46] | USA | basal stem rot | APOGEE spectroradiometer of unmentioned model | 300–1000 | ||||||||||||||||||
| 2012 | citrus (orange) | 462, 487, 610.5, 738, 749 | field | [30] | citrus greeningMalaysia | |||||||||||||||||||||
| Spectra Vista SVC HR-1024 spectrometer & Varian Cary 500 Scan | 457–921 | 650–850 | field and lab | [47] | USA | 2010 | oil palm | basal stem rot | PP Systems Unispec-SC spectrometer | |||||||||||||||||
| 2012 | 310–1130 | 670–715, 490–520, 730–770, 920–970 | field | [31][32] | Indonesia | citrus (orange) | citrus greening | Specim Aisa Eagle camera | 457–921 | 410–432, 440–509, 634–686, 734–927, 932, 951, 975, 980 | field | [48] | USA | 2011 | oil palm | basal stem rot | APOGEE spectroradiometer of unmentioned model | 350–1000 | 495, 495.5, 496, 651.5, 652, 652.5, 653, 653.5, 654, 654.5, 655, 655.5, 656, 656.5, 657, 657.5, 658, 658.5, 659, 659.5, 660, 660.5, 661, 908 | field | [33] | |||||
| 2018 | citrus | citrus greening | Malaysia | |||||||||||||||||||||||
| Specim Imspector V10E spectrograph combined with camera | 379–1023 | 493, 515, 665, 716, 739 | 2014 | oil palm | basal stem rot | ASD spectrometer of unmentioned model | 325–1040 | not mentioned | field | [34] | Malaysia | |||||||||||||||
| 2017 | oil palm | basal stem rot | APOGEE spectroradiometer of unmentioned model | 325–1000 | 495, 495.5, 496, 651.5, 652, 652.5, 653, 653.5, 654, 654.5, 655, 655.5, 656, 656.5, 657, 657.5, 658, 658.5, 659, 659.5, 660, 660.5, 661, 908 | field | [35] | Malaysia | ||||||||||||||||||
| 2019 | wheat | fusarium | ASD FieldSpec Pro spectrometer | 350–2500 | 471, 696, 841, 963, 1069, 2272 | field | [82] | China | 2017 | oil palm | basal stem rot | |||||||||||||||
| 2019 | wheatGER 1500 spectrometer | 273–1100 | 540–560, 650–780 | fusarium | Surface optics SOC710VP camerafield | 400–1000[ | 447, 539, 668, 67336 | field] | [83Malaysia | |||||||||||||||||
| ] | China | 2018 | oil palm | basal stem rot | Specim spectrograph of unmentioned model | 350–1000 | 650–750 | 700–1000field | [ | |||||||||||||||||
| 2020 | wheat | fusarium | 37 | Surface optics SOC710VP camera] | Malaysia | |||||||||||||||||||||
| 400–1000 | 560, 565, 570, 661, 663, 678 | lab | [61] | Israel | field | [84] | China | 2020 | oil palm | basal stem rot | Cubert S185 camera | 325–1075 | 800–950 | greenhouse | [38 | |||||||||||
| 2018 | potato | PVY | ASD FieldSpec 4 spectrometer | 350–2500 | 500–900, 720–1300 | field | ||||||||||||||||||||
| 2020 | wheat | fusarium | ASD FieldSpec Pro spectrometer | 350–2500] | [62Malaysia | |||||||||||||||||||||
| 350–400, 500–600, 720–1000 | ] | USA | field | [24] | China | 2014 | oil palm | orange spotting | ASD FieldSpec 4 spectrometer | 300–1050 | 400–401, 404–405, 455–499, 500–599, 600–699, 700–712 | field | [39][40] | Malaysia | ||||||||||||
| 2019 | tomato | late blight, blackleg | StellarNet Blue Wave spectrometer | 400–1000 | not mentioned | |||||||||||||||||||||
| 2007 | greenhouse, field | wheat | [ | 63] | UK | yellow rust | ASD FieldSpec Pro spectrometer | 350–2500 | not mentioned | field | [85] | China | 2019 | 400–1050 | 601–630 | field | [41] | |||||||||
| 2019 | Malaysia | |||||||||||||||||||||||||
| tobacco | TSWV | Surface optics SOC710VP camera | 400–1000 | 780–1000 | ||||||||||||||||||||||
| 2012 | lab | wheat | [ | 64] | China | yellow rust | ASD FieldSpec Pro spectrometer | 350–2500 | not mentioned | field | [86] | China | 2019 | oil palm | orange spotting | ASD HandHeld 2 spectrometer | 325–1075 | 680–780 | field | |||||||
| 2019 | potato | [ | PVY | Specim FX10 camera | ||||||||||||||||||||||
| 2014 | 42 | 400–1000 | not mentioned | ] | field | [65][43 | The Netherlands | |||||||||||||||||||
| wheat | yellow rust | ASD FieldSpec Pro spectrometer | 350–2500 | 428, 672, 1399 | field | [87] | India | 2019 | potato | early blight | Specim Imspector V10E spectrograph combined with camera | 430–900 | 550, 680, 720–750 | field | [66] | Belgium | ||||||||||
| 2019 | wheat | yellow rust | ASD FieldSpec Pro spectrometer | 350–1000 | 460–720, 568–709, 725–1000 | field | [88] | China | 2019 | tomato | bacterial spot, target spot | Resonon Pika L camera | 380–1020 | 408–420, 630–650, 730–750 | lab and field | [67] | USA | |||||||||
| 2019 | wheat | yellow rust | Specim ImSpector PFD V10E camera, Senop Oy Rikola camera | 400–1000, 500–900 | 594, 601, 706, 780, 797, 874, 881 | field | [89][90] | Germany | 2019 | pepper early | TSWV | |||||||||||||||
| 2019 | wheatSpecim Imspector V10E spectrograph combined with a camera | 400–1000 | 700–1000 | lab | [68] | Israel | ||||||||||||||||||||
| yellow rust | Cubert S185 camera | 450–950 | not mentioned | field | [91] | China | 2019 | potato | late blight | Senop Oy Rikola camera | 500–900 | 620, 724, 803 | ||||||||||||||
| 2019 | wheat | field | [ | 69] | The Netherlands | |||||||||||||||||||||
| 67 | ] | USA | ||||||||||||||||||||||||
| 75 | ] | USA | yellow rust | Headwall Photonics VNIR imaging sensor, Cubert S185 camera | 400–1000 | 538, 598, 689, 702, 751, 895 | lab, field | [92][93] | China | 2020 | tomato | yellow leaf curl, bacterial spot | Resonon Pika L camera | 380–1020 | 550–850 | lab and field | [ | 2020 | tomato early | ToCV | PP Systems Unispec-SC spectrometer | 310–1100 | 402.2, 405.5, 412.2, 415.6, 425.7, 429.0, 449.2, 556.4, 559.7, 563.0, 566.4, 676.4, 679.7, 722.9, 726.3, 862.1 | lab | [70] | Greece |
| 2020 | potato | late blight | ASD FieldSpec 4 spectrometer | 400–900 | 439–481, 554–559, 654–671, 702–709 | lab | [71] | Canada | ||||||||||||||||||
| 350–2500 | 700, 857, 970, 990, 1100, 1241, 1380, 1890, 2300 | lab | [73][ | |||||||||||||||||||||||
| 2011 | wheat | fusarium | Specim Imspector V10E spectrograph combined with camera | 400–1000 | 2020 | potato | late blight | ASD FieldSpec 4 spectrometer | 660–780 | 668, 705, 717, 740 | lab | [72] | Canada | |||||||||||||
| 2020 | potato early | late blight, early blight | Spectra Vista SVC HR-1024 spectrometer74] | USA |