Your browser does not fully support modern features. Please upgrade for a smoother experience.
Please note this is a comparison between Version 1 by Hong Chi and Version 2 by Catherine Yang.
The development of graphene and its derivatives in gas-phase biomarker detection was reviewed in terms of the detection principle and the latest detection methods and applications in several common gases, etc.
- graphene
- gas sensing
1. Nitric Oxide
Nitric oxide (NO) is synthesized by L-arginine through nitric oxide synthase (NOS) in various cells such as neutrophils, red blood cells, endothelial cells, macrophages, and nerve cells. The determination of NO content in exhaled air has been used as a marker for judging the degree of acute respiratory infection and inflammation in respiratory diseases [1][12]. The presence of NO in exhaled gases can be used for rapid detection of lung infections [2][46], including new coronary pneumonia [3][47], asthma [4][48], allergic rhinitis [5][49] severe acute respiratory syndrome (SARS) [6][50], and chronic obstructive pulmonary disease [7][51]. At the same time, continuous monitoring of NO is also essential for coronary heart disease [8][52], Alzheimer’s disease [9][53], and mental illness [10][54]. Jiang et al. reported on a chlorinated graphene FET and its application in monitoring of NO under specified physiological requirements [11][55].
Deng et al. synthesized an antimony tetroxide (Sb2O4) nanoflower/rGO nanocomposite material using a simple and environmentally friendly solvothermal method [12][57]. As shown in Figure 14a, the combination of highly electroactive Sb2O4 nanoflowers and rGO with a larger specific surface area shows a synergistic effect on the recognition of NO. It can detect the NO released by living cells in real time, effectively distinguishing normal and tumor cells. In this case, the reactive Sb4+ and rGO help to achieve rapid electron transfer and the nanoflower structure provides a three-dimensional high-speed channel for NO, making the distance across which the NO must travel to reach the reaction center very short, and thereby obtaining a high mass transfer rate.
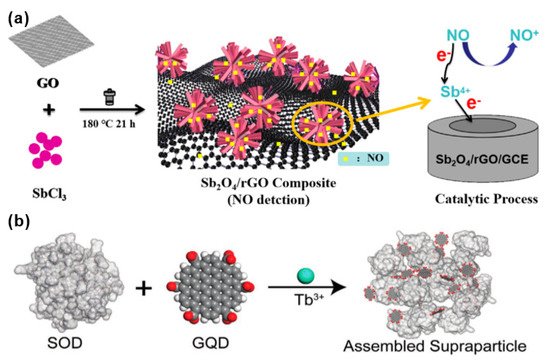
Figure 14. (a) Synthetic route of antimony tetroxide (Sb2O4) nanoflower/rGO nanocomposite [12][57]. Copyright (2021), used with permission from Elsevier. (b) Schematic diagram of the process of monodisperse superparticles (SPs) prepared by coordinating bridged graphene quantum dots (GQDs) and superoxide dismutase (SOD) using terbium ion as metal [13][59]. Copyright (2021), used with permission from Wiley.
Inspired by self-limiting nano-components, Qu et al. assembled graphene quantum dots (GQDs) and superoxide dismutase (SOD) into monodisperse superparticles (SPs) [13][59]. As shown in Figure 14b, graphene quantum dots (GQDs) and superoxide dismutase (SOD) were assembled to synthesize GQD–Tb3+–SOD SPs, and were coated on a glass plate for NO sensing test. Superoxide dismutase (SOD) can alternately catalyze the dismutation of superoxide anion free radicals (O2−), usually with copper as the active center. When Cu(II) in SOD is reduced to Cu(I), the fluorescence of the optically active component Tb3+ fluorophore is enhanced, which is tightly sandwiched by protein and GQD. Tb3+ combines graphene quantum dots (GQDs) and SOD to realize effective energy transfer, thereby “turning on” detection of NO, and realizing reliable monitoring as low as 600 molecules/mL. It is verified that the sensor can achieve ultra-sensitive detection of NO with a concentration as low as 10 × 10–12 M. The sensor opens up a new direction in using self-limiting nano-components. The high sensitivity and non-invasiveness of SP detection means it is widely used in home health monitoring.
Xu et al. constructed an ultra-sensitive NO gas sensor by long-period fiber grating (LFPG) which was covered with GO on a long-period fiber grating (LFPG) that had good sensitivity by refractive index (SRI) changes [14][60]. The GO was coated on the long-period fiber grating (LPFG) (Figure 25a). It can be seen that NO adsorption on the GO depends on two adsorption processes. NO is oxidized by epoxy groups to generate nitrogen dioxide. These complex processes cause NO to be completely removed from the GO surface. The sensor can identify 0–400 ppm NO with high sensitivity. To create more active centers, adjust the band gap of the composite material, and effectively improve the catalytic activity, Qiu et al. used metal oxide nanocrystals (ZnO) to dope redox graphene with nitrogen (N–rGO). These promote the interaction with the attached metal oxides, create more active centers for gas adsorption, and reduce the hydrolysis rate of Zn(OAc)2 by adding different amounts of NH4OH dropwise to achieve controllable nucleation. In the experiment, the volume of NH4OH was controlled to be 0.1, 0.3, and 0.5 mL, and the corresponding products were named NGZ–0.1, NGZ–0.3, and NGZ–0.5 to obtain N–rGO/ZnO (NGZ) hybrid material [15][61]. At low temperatures, the gas-sensitive response of ZnO nanocrystals on the surface of N–rGO to NO is much better than that of ZnO microcrystals aggregated or formed on the surface of N–rGO alone. The resistance of the zinc oxide channel with a heterojunction in Conduction path 1 in Figure 25b,c is much larger than that of the N–RGO channel in Conduction path 2 (R1 ≫ R2). Because metal oxide nanoparticles with a smaller particle size have a p–n heterojunction in NGZ–0.3, which has a strong adsorption effect on NO, the sensitivity of NGZ–0.3 to NO is much greater than that of NGZ–0.1 and NGZ–0.5. Table 2 summarizes the progress of NO-sensing materials, detection limits, and response/recovery time in recent years.
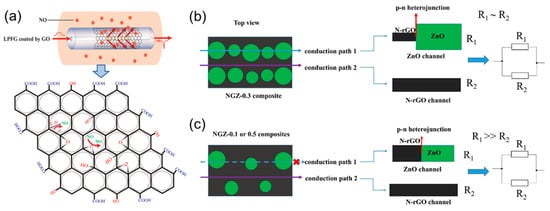
Figure 25. (a) The structure of GO–LPFG and the response mechanism to NO [14][60]. Copyright (2019), used with permission from Elsevier. (b) Physical model of NGZ–0.3 (the volume of NH4OH is 0.3 mL) composite material N–rGO/ZnO (NGZ); (c) physical model of NGZ–0.1 or NGZ–0.5 (NH4OH volume 0.1 and 0.5 mL) composite material [15][61]. Copyright (2020), used with permission from Elsevier.
Table 12. The detection range and response time of other graphene composite materials to NO, NH3 gas.
| Material | Gas | Detection Limit | Response/Restore Time | Reference | ||||
|---|---|---|---|---|---|---|---|---|
| Pd–rGO | NO | 2–420 ppb | 1000 s–1 h | [16] | [62] | |||
| Sub–graphene–hemin | NO | 0.3 nM | 47–54 ms | [11] | [55] | |||
| GQD–Tb | 3+ | –SOD | NO | 600 molecules/mL | 500 s | [13] | [59] | |
| LPFG coated with GO | NO | 0–400 ppm | 23.6 min/N.A. | [14] | [60] | |||
| N–rGO/ZnO | NO | 100 ppb | 522/303 s | [15] | [61] | |||
| 300 ppb | 478/410 s | |||||||
| 800 ppb | 284/473 s | |||||||
| Graphene/PS brush | NH | 3 | ≥4.88 ppb | 150 s/N.A. | [17] | [63] | ||
| PPy | NH | 3 | 7.6 ppm | 105/182 s | [18] | [7] | ||
| PPy/GO | NH | 3 | 0.90 ppm | 81/116 s | ||||
| PPy/rGO | NH | 3 | 0.035 ppm | 72/151 s | ||||
| PPy/srGO | NH | 3 | 0.00020 ppm | 48/234 s | ||||
| PPy–rGO | NH | 3 | 10 ppm | ~100 s | [19] | [64] | ||
| PPy/SnO | 2 | /GNR | NH | 3 | ≥0.6 ppm | ~100 s/200 s | [20] | [65] |
| MoO | x | /GFET | NH | 3 | ≥310 ppb | 356 s | [21] | [66] |
| PUF–PPy–GO | NH | 3 | 1.1–182 ppm | ~7/13 s | [22] | [67] | ||
| GO–PANI | NH | 3 | 1 ppm | ~5/10 min | [23] | [68] |
N.A.: not available.
2. Nitrogen Hydride
The production of NH3 in the human body is related to protein metabolism. Proteins are degraded into non-storable amino acids to be used or metabolized, which leads to the formation of NH3 [24][25][38,56]. Ammonia (NH3) itself is a toxic and irritating gas. Its accumulation in the human body promotes acidosis in the blood, causes enzyme denaturation, and ultimately leads to death. When the concentration of exhaled ammonia exceeds 2935 ppb, it means that the kidney urea cycle is out of balance. Due to the gas exchange between blood, alveoli, and air, a small amount of ammonia is exhaled in the breath. The main mechanism of ammonia metabolism is the excretion of the urine after the detoxification process, which is the renal urea cycle. In this process, NH3 is converted into the less toxic soluble compound urea [26][13]. If the kidneys cannot filter the urea in the blood, urea will enter the body’s gas circulation with the blood, and the NH3 concentration in the breath will increase [26][27][28][13,69,70]. This is why patients with chronic kidney disease (CKD) exhale ammonia gas.
Compared with G, oxygen-containing groups on the surface of GO can enhance the gas sensitivity by interacting with polar gas molecules. There are still some oxygen-containing functional groups on the surface of rGO. To distinguish the influence of polar water molecules on NH3 detection, Kim et al. studied the response of graphene gas sensors under two different humidity (RH%) conditions [17][63]. A passivation layer of polystyrene (PS) brush was used on the surface of silicon dioxide to cover the hydroxyl groups in SiO2/Si.
Figure 36a shows that the improvement in gas sensitivity may be attributed to the π–π stacking and the formation of hydrogen bonds between PPy and rGO, resulting in a larger surface area and fast carrier transport after the two are recombined. Shahmoradi et al. used an in-situ chemical oxidative polymerization method to prepare polypyrrole (PPy) composites with graphene oxide (GO), reduced graphene oxide (rGO), or p-benzenesulfonic acid sulfonated reduced graphene oxide (srGO) [18][7]. The sensor response process is shown in Figure 36b. The effect of the working temperature of different nanocomposite materials at four temperatures (28, 40, 50, and 60 °C) on the sensor’s performance was studied. The PPy/srGO sensor showed the highest detection sensitivity, which was 0.20 ppb~12 ppm NH3. The response principle is attributed to the charge transfer mechanism between NH3 and the nanocomposite surface. The electron transfer process of NH3 molecules to the surface of the p-type polypyrrole sensor is depleted, resulting in an increase in resistance. On the other hand, p-type rGO is donated to electrons. When the PPy/srGO sensor is exposed to NH3 gas, a hydrogen bond interaction was generated between NH3 and bare PPy and also between NH3 and srGO; thereby the electrical resistance was increased. Hsieh et al. further improved the hybrid system of PPy and graphene. They prepared a polypyrrole (PPy)/tin oxide (SnO2)/graphene nanoribbon (GNR) ternary nanocomposite by using an in-situ chemical oxidation polymerization method [20][65]. The results showed that the response sensitivity of the PPy/SnO2/GNR sensor containing 3 wt% SnO2 nanoparticles in 1 ppm NH3 is about three times that of pure PPy. Figure 6c shows that the PPy-coated SnO2 and GNR can form covalent bonds. The larger specific surface area contributed by SnO2 and GNR could further enhance the contact site with PPy and provide many adsorption sites for NH3 gas. The band gaps of PPy and SnO2 are 2.81 eV and 3.709 eV, respectively. Thus, the p–n heterojunction formed between p-type PPy and n-type SnO2 benefits the formation of a self-established depletion layer electric field at the PPy/SnO2 heterojunction.
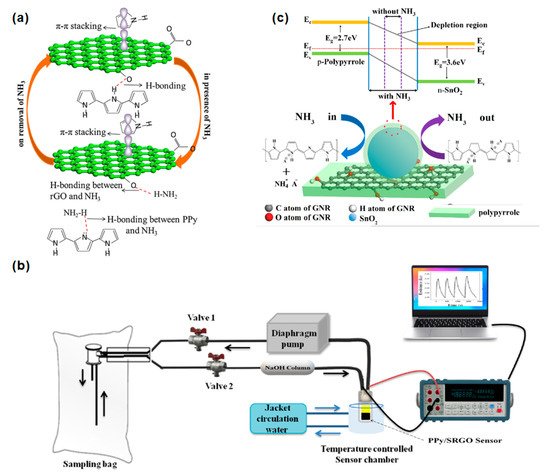
Figure 36. (a) Schematic diagram of the interaction between NH3 and PPy/rGO [19][64]. Copyright (2017), used with permission from Elsevier. (b) Device of PPy/srGO nanocomposite gas sensor [18][7]. Copyright (2021), used with permission from Elsevier. (c) The energy band diagram and sensing mechanism of the PPy/SnO2/GNR nanocomposite sensor [20][65]. Copyright (2021), used with permission from Elsevier.
The excellent sensing and recovery performance of the MoOx/GFET sensor is mainly attributed to the effective adjustment of the height of the Schottky barrier. The energy band in Figure 47a indicates the changes in hole density and Fermi energy caused by NH3 exposure. Under the bias voltage from −50 V to +75 V, the positive change in the back-gate voltage (VGS) causes the Fermi energy valence band to move upward to make it closer to the energy level of NH3, resulting in a smaller energy difference and less charge transfer between NH3 and p-type GFET sensors.
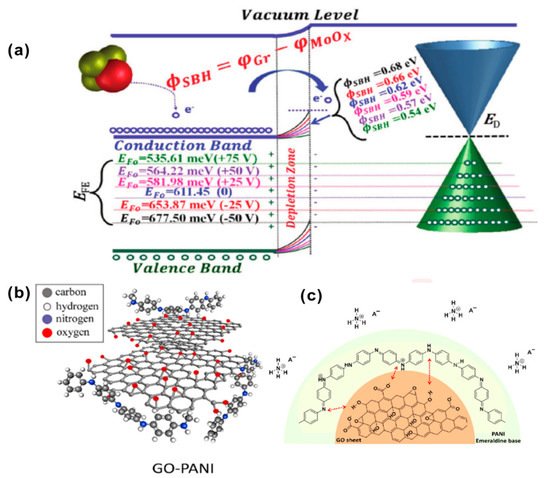
Figure 47. (a) Fermi-level tuning diagram in MoOx/graphene composite field-effect transistor sensor (D100) (back gate voltage VGS from −50 to +75 V, electron transfer from NH3 to p-type graphene) [21][66]. Copyright (2020), used with permission from Elsevier. (b) The expanded coil when PANI nanocomposites were pinned to the GO sheets; (c) the adsorption mechanism of GO–PANI in ammonia [23][68]. Copyright (2021), used with permission from Elsevier.
Javadian-Sara et al. explored a microwave-based open-loop resonator (SRR) sensor based on the nanocomposite prepared by the in-situ polymerization of polyaniline (PANI) on the surface of GO [23][68], as shown in Figure 47b. At room temperature, it has a high sensitivity of 0.038 dB ppm−1 to low concentration (1–25 ppm) ammonia, a response/recovery time of 150/400 s, and a sensitivity of 0.0045 dB ppm−1 to high concentrations (>25 ppm). As shown in Figure 47c, when the GO(10%)–PANI nanocomposite is exposed to ammonia gas, due to the acid-base interaction between PANI and ammonia gas, the PANI changes from a conductive form to a non-conductive state. Ammonia gas acts as a base to reduce the aniline ion R–NH+ carriers of PANI through deprotonation, showing a strong de-doping effect and enhancing the internal resistance of PANI. The prepared sensor can selectively detect ammonia in the atmosphere of other higher concentrations of dangerous gases and across a wider range of RH% (15–90%). The response signal can be repeated after 30 days with less than 0.32% variation.
The high efficiency of graphene-based sensor components can be achieved by designing and optimizing their preparation processes, but graphene-based sensors for the physiological analysis of ammonia in breath are still being studied.
3. Sulfide Gas
The cause of bad breath is multifactorial, involving various body organs (mouth, lungs, and stomach). About 90% of all types of bad breath can be classified as intraoral bad breath, which stems from oral-related pathological conditions (dental periodontitis and gingivitis) and physiological characteristics, especially the microbial coating on the tongue [29][30][71,72]. The microorganisms in the tongue coating produce a variety of metabolites, including volatile sulfides (VSCs), such as methyl mercaptan (CH3SH), hydrogen sulfide (H2S), and dimethyl sulfide (CH3SCH3) [31][32][33][8,73,74].
As shown in Figure 58a, the adsorption of oxygen causes electrons in the conduction band of the SnO2 QW to be deprived, causing the energy band to bend and increasing the resistance. The H2S gas can react with the oxygen adsorbed on the surface, and it is oxidized to sulfur dioxide, making the electrons return to the SnO2 QW. In this case, it helps to adjust the surface state of the band structure, so that SnO2 QWs generate more oxygen adsorption sites. At the same time, GO acts as an electron migration channel, which improves the sensitivity of selection. Shewale et al. used a simple air-jet deposition method to uniformly modify GO on copper-doped zinc oxide (CZO) nanostructured films [34][76]. As shown in Figure 58b, the 3CZO/rGO sensor doped with ZnO/rGO (mass fraction of 3 wt% copper nitrate aqueous solution) is fixed on the ceramic microheater with thermal paste. To accurately measure the temperature of the gas sensor, a highly sensitive temperature sensor is installed on the surface of the microheater. The synthesized 3CZO/rGO nanocomposite sensor shows better gas sensitivity to H2S at room temperature (24 °C) than undoped ZnO/rGO, and a better response to H2S. The response and recovery time to 100 ppm H2S are, respectively, 14 s and 32 s, which dramatically improves the potential application of nanocomposite sensors in medical diagnosis. The recent applications of other graphene and its derivatives in the detection of H2S gas biomarkers were summarized in Table 23.
Table 3.
The detection range and response/recovery time of graphene composites to H
2
S gas.
| Material | Gas | Detection Limit | Response/Recover Time (s) | References |
|---|
| SnO | 2 | @GO | H | 2 | S | 200 ppb | 9/23 (54%RH) | [35] | [75] | ||
| H | 2 | S | 6/21 (93.6%RH) | ||||||||
| ZnO/rGO | H | 2 | S | 136 ppb | 14/32 | [34] | [76] | ||||
| rGO/GaN | H | 2 | S | 100 ppm | ~800 | [36] | [77] | ||||
| (rGO) –NiO(NiOBNG) | H | 2 | S | 1 ppm | 31/49 | [37] | [78] | ||||
| H | 2 | S | 20 ppm | 38/44 | |||||||
| H | 2 | S | 50 ppm | 28/75 | |||||||
| β–Ga | 2 | O | 3 | /rGO | H | 2 | S | 3 ppm | N.A. | [38] | [79] |
| WO | 3 | /rGO | H | 2 | S | 32.7 ppb | 340/180 | [39] | [80] | ||
| GQD–SnO | 2 | QNP/ZnO | H | 2 | S | 0.1 ppm | 14/13 | [40] | [81] |
N.A.: not available.
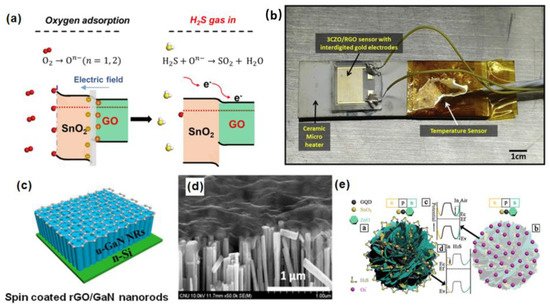
Figure 58. (a) Schematic diagram of H2S adsorption mechanism based on SnO2@GO gas sensor [35][75]. Copyright (2020), used with permission from Elsevier. (b) CZO/rGO sensor structure [34][76]. Copyright (2020), used with permission from Elsevier. (c) Schematic diagram of rGO)/GaN nanorods (NRS); (d) scanning electron microscope (SEM) image of rGO/GaN nanorod (NRS) composite material [36][77]. Copyright (2020), used with permission from Wiley. (e) Schematic diagram of band configuration at the interface of the GQD–SnO2/ZnO [40][81]. Copyright (2021), used with permission from the American Chemical Society.
Reddeppa et al. reported a rGO/GaN nanorod (NRs) hybrid system for hydrogen (H2) and hydrogen sulfide (H2S) gas sensing at room temperature [36][77]. Figure 58c shows the prepared (rGO)/GaN NRs hybrids. As shown in Figure 58d, the surface of the GaN nanorods has a wavy structure without the rGO film, and the spin-coated reduced graphene oxide layer does not penetrate between the nanorods. Compared with pure GaN NRs, rGO/GaN NRs have better gas sensitivity.
4. VOCs
Volatile organic compounds (VOCs) can be generated through various biochemical pathways. The detection of VOC biomarkers can be realized by measuring changes in the electrical, optical, chemical, and chromatic properties of sensitive materials that interact with VOC molecules [41][83]. Probiotics can regulate intestinal problems and maintain the body’s intestinal homeostasis. It is possible to diagnose the balance of human probiotics by detecting changes in the concentration of trimethylamine (TMA) in exhalation [42][9]. Yu et al. reported the real-time monitoring of TMA in respiration based on the 11–mercaptoundecanoic acid (11–MUA)—Au nanoparticles (AuNPs)/rGO composite material microgravimetric method [43][84]. The sensor shows that the lower limit of detection is 5 ppm, and the response time is 30 s. Hexanal and 5-methylundecane are biomarkers of multiple sclerosis (such as Alzheimer’s disease (AD) and Parkinson’s disease (PD)) [44][85]. Mazzatenta et al. reported the real-time detection of AD fingerprints in exhalation. A significant change in the accumulated VOC fingerprints was detected in the breath of an AD patient [45][86]. The recent applications of other graphene and its derivatives in the detection of organic volatile gases that can be used as markers for cancer and other diseases were summarized in Table 34.
Table 34.
The detection range and response/recovery time of graphene composite materials to VOC gases.
| Materials | Gas | Detection Limit | Response/Recovery Time (s) | References |
|---|
| Au NPs–rGO | TMA | ≥5 ppm | ~30 | [43] | [84] | ||||||
| C | 60 | –g–CNT | ethanol | ≥400 ppb | ~300/400 | [46] | [11] | ||||
| methanol | ≥400 ppb | ~300/400 | |||||||||
| acetone | ≥400 ppb | ~300/400 | |||||||||
| chloroform | ≥400 ppb | ~300/400 | |||||||||
| toluene | ≥400 ppb | ~300/400 | |||||||||
| cyclohexane | ≥400 ppb | ~300/400 | |||||||||
| C | 60 | –g–rGO | ethanol | ≥400 ppb | ~300/400 | [46] | [11] | ||||
| methanol | ≥400 ppb | ~300/400 | |||||||||
| acetone | ≥400 ppb | ~300/400 | |||||||||
| chloroform | ≥400 ppb | ~300/400 | |||||||||
| toluene | ≥400 ppb | ~300/400 | |||||||||
| cyclohexane | ≥400 ppb | ~300/400 | |||||||||
| (Parylene C and GO) MS | toluene | 100–300 ppm | 164/412 | [47] | [87] | ||||||
| eG | acetaldehyd | ≥10 ppm | N.A. | [48] | [88] | ||||||
| GO thin film | ethanol | >80 ppm | N.A. | ||||||||
| rGO/SnO | 2 | acetone | 0.25–30 ppm | 24/30 (5 ppm) | [49] | [89] | |||||
| Sn | x | Ti | 1−x | O | 2 | /GO | toluene | 100 ppb | N.A. | [50] | [90] |
| acetone | 200 ppb | N.A. | |||||||||
| Ag/Fe | 3 | O | 4 | /rGO | acetone | 35.81–50 ppm | ~50/70 | [51] | [91] | ||
| SiNW/rGO | acetaldehyd | 1 ppm | 30/180 | [52] | [92] | ||||||
| cyclohexane | 1 ppm | 30/60~120 |
N.A.: not available.
Ghazi et al. developed a GO microfluidic gas sensor by: (1) 3D printing microchannels coated with a 5-µm-thick parylene carbon layer (propylene polymer). Then, the xylene was used to provide a chemically inert barrier layer. (2) The modified microchannel was coated with GO to improve the specific surface area to volume ratio of the micro-features [47][87]. The performance was improved. The sensing setup of the microfluidic gas sensor is shown in Figure 69a. Compared with ordinary gas sensors, its selectivity to toluene, ethanol, methanol, pentanol, propanol, and hexane increased by 64.4% on average (Figure 69b).
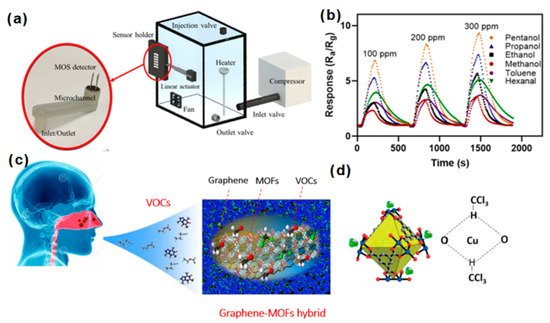
Figure 69. (a) Schematic illustration of the microfluidic gas sensor; (b) the sensing intensity of the microfluidic gas sensor for different VOCs [47][87]. Copyright (2022), used with permission from the American Chemical Society. (c) Response of graphene and MOF hybrid nanocomposite on exhaled gas; (d) the schematic diagram of the hydrogen bond affinity between copper benzene–1,3,5–tricarboxylate (Cu–BTC) and chloroform molecules [53][93]. Copyright (2020), used with permission from the American Chemical Society.
It is understood that the abnormal concentrations of toluene exhaled by lung cancer patients are in the hundreds of ppb, whereas the normal concentration is about 1–18 ppb. Pargoletti et al. synthesized a SnxTi1−xO2/GO–based material through a simple hydrothermal method, where x is the content ratio of tin [50][90]. When using 32:1 SnO2/GO and 32:1 TiO2/GO, there is excellent selectivity to acetone at a level of 100 ppb. However, when compared with titanium, when a solid solution with a higher tin content (such as 32:1 Sn0.55Ti0.45O2/GO) is used, it shows a higher performance for the larger non-polar molecule toluene at 350 °C. Tung et al. prepared three different graphene-MOF hybrid nanocomposites, including
Coppere–benzene–1,3,5–tricarboxylate (PG–Cu BTC)), zirconium 1,4–dicarboxybenzene 1,4–dicarboxylate (PG–UIO 66) and 2-methylimidazole zinc salt (PG–ZIF 8). They used this for chemoresistance sensing of VOC biomarkers [53][93]. As shown in Figure 69c, the PG–Cu–BTC sensor was tested against VOC biomarkers, and it showed good selectivity to chloroform. The selectivity principle (Figure 69d) is attributed to the hydrogen bond between the chloroform molecule and Cu-BTC.
Diabetes mellitus (DM) is a metabolic disease characterized by high blood sugar caused by insufficient insulin secretion (type I DM), insufficient insulin action (type II DM), or both. Due to hyperglycemia conditions (high blood sugar levels when fasting GI is greater than 7 mmol/L), the excess sugar cannot be metabolized, which induces the decarboxylation of acetoacetate and the dehydrogenation of isopropanol. Large amounts of isopropanol in the liver can produce acetone [54][94]. The acetone produced in the blood can diffuse through the lungs to the airways, because acetone has a blood/air partition coefficient of 341 at body temperature, and diffuses through urine. Therefore, diabetes can be diagnosed by testing the concentration of acetone in the breath at present [55][95]. Studies have determined that the average concentration of acetone in the breath of healthy people is 300–900 ppb, and the abnormal concentration of acetone in the breath of diabetes patients exceeds 1800 ppb.