Increasing demand pressures on the fibre supply are forcing manufacturers to explore using new species in plywood. Here authorswe investigated aspen and black alder, alone and in combination with birch faces, and with different veneer thicknesses in plywood production. The aim of this study was to evaluate the effect of different veneer thicknesses, lay-up systems, and hardwood veneer combinations on plywood mechanical properties. Impacts on modulus of rupture (MOR), modulus of elasticity (MOE), glue consumption, and density properties were observed. All process parameters were the same as for pure birch plywood. Not surprisingly, birch plywood had the highest MOR and MOE, followed by aspen and black alder. Aspen had the highest glue consumption and birch the lowest, when applied with a spreader roll, but the common practice of using relatively thick 2.6 mm aspen veneers resulted in the lowest glue consumption per mm of product. The effects of wood species and veneer thickness on MOR, density, and glue consumption were analysed for panel thicknesses from 6.5 to 18 mm to guide manufacturers in choosing their species and construction to optimize cost, MOR and stiffness, weight, and glue consumption. In conclusion, birch gave the best strength properties while aspen gave the best price and weight combination.
1. Introduction
Plywood is the second highest volume wood panel product in the world
[1]. In Estonia, timber and wood-based products are one of the biggest contributors to the economy, accounting for 10% of gross domestic product (GDP) and 5% of the workforce. In the Baltic and Nordic regions of Europe, silver birch is the most common species in plywood production. About 51% of Estonian territory is covered by forest, of which 29.9% is birch, 4% is aspen and 2.2% is black alder, the species investigated here
[2]. The main wood species utilised by plywood manufacturers in Northern Europe are spruce, pine, and birch. These species have been used for many decades due to the availability and high quality of the wood material. However, climate change and efficient utilisation of biomass, e.g., low-quality wood species, will drive the veneer-based product industry to seek out other sources and species. Aspen and black alder are not commonly used in the production of plywood, either as sole-species or mixed-species products. In the past, their relatively lower availability and quality compared to birch made their utilisation not feasible. Moreover, these species have commonly lower density
[3], and lower density has been shown to decrease the mechanical properties of wood
[4]. However, these species have lower log prices, and especially for aspen, lower density provides the possibility of lower cost and lower weight products.
Utilisation of hardwood species by the veneer-based industry has been described by
[5] in an extended literature review. However, in that review, the focus was on North American, Asian, and Australian hardwood species and on laminated veneer lumber (LVL). More recent research has been focused also on aspen and black and grey alder species. Rohumaa et al.
[6] showed that these species could be successfully bonded and combined with each other under current plywood manufacturing conditions. Moreover, Kallakas et al.
[7] showed that birch, aspen, and alder species could be combined by different lay-up systems in order to manipulate the strength properties of the final product. Previous studies also show that veneers from different wood species have different roughness, even if they are prepared under the same conditions
[6]. In order to form a successful bondline, the contact between the surfaces should be sufficient and overcome the roughness
[8]. Commonly, in the case of rough veneer, the plywood manufacturers increase the adhesive spread rate and press pressure, but the effectiveness of this technique has not been confirmed
[9]. The reason could be related to veneer processing conditions
[10][11][12][13][10,11,12,13], which also affect lathe check formation. Commonly, thicker veneer has deeper lathe checks
[13], which affect the adhesive consumption
[14] and bonding quality of the plywood
[12]. However, previous research on aspen and alder veneers did not evaluate the effect of veneer thickness and adhesive consumption on plywood mechanical properties.
2. Glue Consumption and Density
Glue was applied to all veneers under the same conditions and with the same machine settings. The lowest glue consumption was 152 g/m
2 with birch plywood, and the highest was 196 g/m
2 with aspen containing 2.6 mm veneers, as shown in
Table 14.
Table 14.
Glue consumption per glue line (last number shows veneer thickness in mm).
| Plywood Type |
Average Glue Consumption (g/m | 2 | ) |
Standard Deviation (g/m | 2 | ) |
| Birch 1.5 |
152 |
7 |
| −21% |
−18% |
−4% |
−20% |
|
−15% |
−23% |
−62% |
−25% |
−17% |
|
Black Alder 1.5 |
156 |
10 |
| 9 |
−32% |
−27% |
|
−16% |
−15% |
−20% |
−24% |
−21% |
|
−37% |
−18% |
−14% |
Aspen 1.5 |
177 |
16 |
| 12 |
−33% |
−25% |
−31% |
−18% |
−25% |
|
−26% |
| −18% |
For MOE, all results followed the same pattern as MOR. With increasing thickness, MOE decreased in the grain direction and increased in the cross direction. In the grain direction, average MOE results for all thicknesses included were 10,737 N/mm
2 for aspen, 12,447 N/mm
2 for birch, 8707 N/mm
2 for black alder, and in cross direction, average MOE results for all thicknesses included were 5490 N/mm
2 for aspen, 6201 N/mm
2 for birch, and 4429 N/mm
2 for black alder. For aspen plywood with 2.6 mm veneers, MOE was 11,270 N/mm
2 in the grain direction and 3013 N/mm
2 in the cross direction. In MOE, results were not significantly different for combi aspen and aspen plywood panels, but combi black alder plywood gave higher results (10,985 N/mm
2) in the grain direction, while there was no significant change in the cross direction (4180 N/mm
2).
The correlation between glue consumption and MOR varied from very weak (0.05) in birch to a moderate 0.58 in combi black alder, as can be seen from
Table 36. However, only the combi black alder correlation was strong enough to be statistically significant (
p < 0.05), even though most sets had 24 data points.
Table 36. Glue consumption—MOR correlation coefficients.
| Plywood Type |
Correlation Coefficient |
2/√n |
| Birch 1.5 mm |
0.05 |
0.41 |
| Black Alder 1.5 mm |
0.14 |
0.50 |
| −16% |
−48% |
| Aspen 1.5 mm | −26% |
−26% |
|
| 0.10 |
Aspen 2.6 |
195 |
7 |
| C-Black Alder 1.5 |
156 |
8 |
| C-Aspen 1.5 |
187 |
8 |
| C-Aspen 2.6 |
185 |
6 |
Birch, black alder, and combi black alder plywood (which has birch face veneers) had the most similar glue consumption. Aspen 1.5 mm veneer consumed 15.8% more glue than the reference birch, while 2.6 mm aspen veneer consumed 28.3% more. For combi plywood, glue consumption followed the pattern of core veneers, where adhesive was applied.
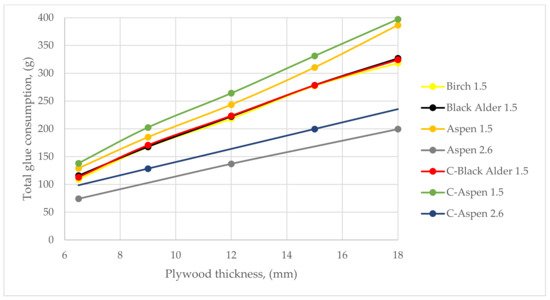
As shown in
Figure 1, total glue consumption at a given thickness was highest for combi aspen and aspen 1.5 mm veneer plywood. Black alder, combi alder, and birch plywood were very similar to each other. The lowest glue consumption was with 2.6 mm aspen plywood and 2.6 mm aspen combi plywood, with 34%–40% lower consumption compared to birch and close to 50% less than 1.5 mm veneer aspen or combi-aspen plywood.
Figure 1. Total glue consumption per panel vs. plywood thickness for all plywood types. (Last number shows veneer thickness in mm).
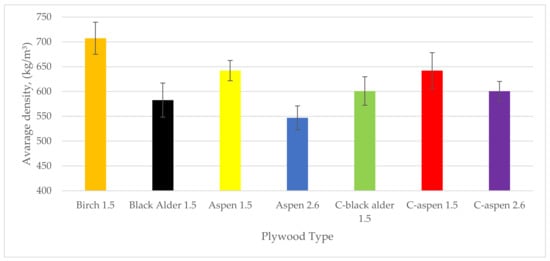
Panel densities are given in
Figure 2. Birch plywood had the highest density (707 kg/m
3) while black alder plywood had the lowest of those made with 1.5 mm veneers (583 kg/m
3). As expected, using birch face veneers with lower density cores increased average panel density. Aspen 2.6 mm veneers produced plywood panels with significantly lower density than those with 1.5 mm veneers, including the lowest density plywood panels in the study, aspen 2.6 mm at 549 kg/m
3.
Figure 2.
Average densities according to plywood type (lines on bars show standard deviations).
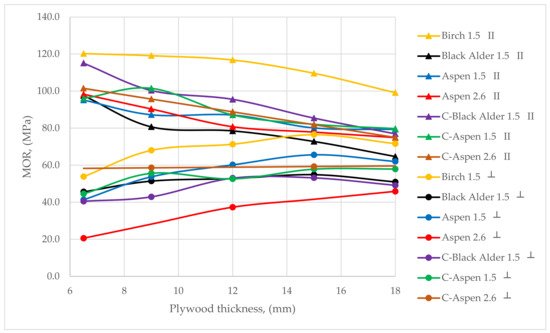
3. Bending Strength (MOR) and Modulus of Elasticity (MOE)
Several trends in MOR are apparent in
Figure 3. First, as panel thickness increased, MOR in the grain direction decreased and increased in the cross direction. As a result, the MOR in the grain and cross direction started to converge at the high thicknesses. The highest MOR was observed in pure birch plywood using 1.5 mm veneers at all thicknesses (from 120 N/mm
2 for 6.5 mm to 99.1 N/mm
2 for 18 mm) and lowest in the plywood with only black alder 1.5 mm veneers (from 97.5 N/mm
2 for 6.5 mm to 64.7 N/mm
2 for 18 mm). In the cross direction, birch plywood had the highest MOR for all thicknesses (from 53.8 N/mm
2 for 6.5 mm to 71.6 N/mm
2 for 18 mm), and aspen plywood with 2.6 mm veneers had the lowest (from 20.6 N/mm
2 for 6.5 mm to 45.9 N/mm
2 for 18 mm).
Figure 3. For different plywood types and thicknesses, MOR vs. thickness, in grain (II) and cross (┴) direction. (Note: the same colour is used for both in grain and cross direction (lower values) for each plywood type).
When comparing MOR, all plywood panels showed lower strength than birch, as summarized in
Table 25. The lowest relative (and absolute) strength was for 6.5 mm plywood from 2.6 mm pure aspen in the cross direction, because this panel contains only one cross veneer, placed at the neutral axis.
Table 25.
Strength decrease relative to standard birch plywood at each thickness.
| Plywood Thickness |
Grain Direction |
Cross Direction |
| B. Alder |
Aspen |
C-Alder |
C-Aspen |
B. Alder |
Aspen |
C-Alder |
C-Aspen |
| 1.5 |
1.5 |
2.6 |
1.5 |
1.5 |
2.6 |
1.5 |
1.5 |
2.6 |
1.5 |
1.5 |
2.6 |
| 6.5 |
−19% |
| 0.41 |
| 15 |
−34% |
−27% |
|
−22% |
−25% |
−25% |
−28% |
−14% |
|
−30% |
−24% |
−22% |
| Aspen 2.6 mm |
0.26 |
0.41 |
18 |
−35% |
−20% |
−24% |
−22% |
−20% |
|
−29% |
−13% |
−36% |
−31% |
| C-Black Alder 1.5 mm |
0.58 |
0.41 | −19% |
|
| Average |
−30% |
−24% |
| C-Aspen 1.5 mm |
0.27 | −24% |
−16% |
−21% |
−23% |
−25% |
−17% |
−49% |
−30% |
−21% |
0.41 |
| C-Aspen 2.6 mm |
−0.52 |
0.71 |