Your browser does not fully support modern features. Please upgrade for a smoother experience.
Please note this is a comparison between Version 1 by songtao Dong and Version 2 by Bruce Ren.
In this work, a novel heterojunction based on ZnSnO3/ZnO nanofibers was prepared by a simple electrospinning method. The crystal, structural, and surface compositional properties of ZnSnO3 and ZnSnO3/ZnO composite nanofibers were investigated by X-ray diffractometer (XRD), scanning electron microscope (SEM), transmission electron microscope (TEM), X-ray photoelectron spectrometer (XPS), and Brunauer–Emmett–Teller (BET). Compared to pure ZnSnO3 nanofibers, the ZnSnO3/ZnO heterostructure nanofibers had high sensitivity and selectivity response with the fast response toward ethanol gas at low operational temperature.
- electrospinning
- ZnSnO3/ZnO nanofibers
- sensing performance
- n-n heterojunction
1. Introduction
In recent years, with the increasing demand for the detection of toxic gases, volatile organic compounds, and clinical gas analysis, gas sensor research has become more extensive. High sensitivity, fast response, excellent selectivity, and long-term stability are the basic parameters of the highly sensitive gas sensors [1]. Semiconductor metal oxide gas sensors have attracted widespread attention due to their advantages such as fast response, low cost, simple structure, and good compatibility. Semiconductor metal oxide materials (e.g., NiO [2], SnO2 [3][4][3,4], ZnO [5], CuO [6], etc.) are widely used for their high performance, cost-effectiveness, and excellent gas-sensing properties. Still, these binary oxide materials operate at high temperatures, so the search for a sensing material with low operating temperature and high sensitivity has become a focus of current research.
At present, ternary transition metal oxides as new gas-sensitive materials have received widespread attention due to their excellent gas-sensitive properties, structural stability, especially their unique energy band structure, and unique physical and chemical properties. However, due to its low exposure area and low electron transfer, many ternary metal oxides tend to show lower gas sensitivity [7]. Among the ternary tin-based metal oxides, ZnSnO3 is a typical perovskite structure oxide material with Zn at the A-site and Sn at the B-site. Compared to ZnO and SnO2, ZnSnO3 has been widely used in gas sensors for its high chemical sensitivity and excellent electrical properties [8]. The spatial arrangement of the atoms in the ZnSnO3 system is an octahedron. The unique crystal structure of ZnSnO3 has a lot of oxygen vacancies, providing more oxygen adsorption sites, which can promote the reaction with reducing gases, thus improving gas sensitivity [8]. Many studies have focused on single-component ZnSnO3 as a gas sensing material. Wang et al. [9] reported that the sensing response to 100 ppm H2S of hollow, cubic-structured ZnSnO3 samples were up to 1418 at an optimum operating temperature of 335 °C. ZnSnO3 nanomicrospheres were prepared by the hydrothermal method, which had high selectivity for n-butanol at 200 °C [10]. Wang et al. found that ZnSnO3 samples prepared by co-precipitation and heat treatment had a high sensing response to ethanol, reaching 147 [11]. Researchers have also designed heterogeneous structures to improve the gas-sensing performance, such as ZnSnO3/TiO2, SnO2/TiO2, WO3/SnO2, and ZnSnO3/ZnO [12][13][14][15][12,13,14,15]. To further improve the gas-sensitive performance of ZnSnO3, Yu et al. [16] compounded ZnSnO3 with CuO and found a sensing response to ethanol of up to 131. Zhang et al. [17] and Cheng et al. [18] reported that ZnSnO3 was compounded with SnO2; due to the excellent physical and chemical properties of both SnO2 and ZnSnO3, the gas-sensitive properties of the SnO2/ZnSnO3 composite were significantly improved compared to both SnO2 and ZnSnO3 materials. The cubic ZnSnO3/ZnO heterostructure showed a much improved response to 50 ppm triethylamine compared to pure ZnSnO3 (Ra/Rg = 21) [15]. These results indicated that heterostructures composed of MOx and ZnSnO3 had great potential for gas-sensing applications.
Currently, researchers have prepared ZnSnO3 nanofibers with different morphologies (e.g., spherical, polyhedral, etc.) [19][20][19,20], but there are few reports on nanofiber samples with ZnSnO3-based heterojunctions. The electrospinning method can obtain nanofiber materials with high specific surface area and different morphologies. Based on the above considerations, ZnSnO3 nanofibers and ZnSnO3/ZnO composite nanofibers were synthesized by electrospinning in this paper. The results of gas-sensitive performance of ZnSnO3 nanofibers and ZnSnO3/ZnO nanofibers showed that the ZnSnO3/ZnO nanofibers had a lower operating temperature (225 °C), a sensitivity response of 19.6 at 50 ppm in ethanol atmosphere, and better stability than ZnSnO3. A possible enhanced gas-sensing mechanism was proposed.
2. Experimental Section
2.1. Material Preparation
A combination of electrospinning and calcination was used to prepare ZnSnO3/ZnO nanofibers. The experimental procedure was as follows: First, appropriate amounts of stannous chloride (SnCl2·2H2O) and zinc chloride (ZnCl2) were dissolved in a mixed solution of 8 g N, N-dimethylformamide (DMF) and 12 g anhydrous ethanol under constant stirring so that the molar ratio of Sn4+ to Zn2+ was 1:1.2. Next, 2 g of polyvinylpyrrolidone (PVP; average molecular weight of 1,300,000 g·mol−1) was added and stirred thoroughly to finally obtain the precursor solution required for the electrospinning method. Then, the electrospinning precursor solution was loaded into a plastic syringe with a 22-gauge needle, and the advance rate of the syringe pump was set at 0.4 mL·h−1. A voltage of 15 kV was applied between the needle and the collector, and a layer of aluminum foil was wrapped around the rotating receiver 20 cm from the needle to collect the fibers. The collected precursor fibers were calcined in air at 450 °C for 2 h to obtain ZnSnO3/ZnO nanofibers.
2.2. Characterization
The physical phases of the calcined samples were analyzed by X-ray powder diffractometer (XRD, Bruker D8 Advance, Bruker, Billerica, MA, USA) using a copper target Kα line with a scanning range of 20–60° and a scanning speed of 6°/min. The field-emission scanning electron microscopy (FESEM; Merlin Compact, Carl Zeiss AG, Oberkochen, Germany) and transmission electron microscope (TEM; JEOL 2100F, JEOL Ltd., Tokyo, Japan) were used to characterize the morphology of the samples. Thermogravimetric (TG) tests were carried out by a thermal analysis system (Diamond TG/DTA, Perkin Elmer S. A., Waltham, MA, USA) to determine the calcination temperature of the precursors. The weight of the sample was 4–6 mg during the test, and it was heated to 600 °C at a heating rate of 15 °C/min. The elemental composition and valence states in the material were characterized using an X-ray photoelectron spectrometer (Thermo Scientific K-Alpha, XPS, Thermo Fisher Scientific, Waltham, MA, USA). The specific surface area of the prepared nanofibers was tested by Brunner–Emmet–Teller (BET, Micromeritics ASAP 2020, Micromeritics Instrument Corporation, Norcross, GA, USA).
2.3. Gas-Sensitive Performance Measurement
A 200 mg sample of ZnSnO3/ZnO nanofibers was mixed well with 0.2 mL of deionized water in an agate mortar and ground to a paste. Then, the ground paste sample was uniformly coated on the surface of the Ag-Pd forked finger electrode on an Al2O3 substrate and dried for a certain period of time to obtain the gas-sensitive element required for the test. Before testing, the dried gas-sensitive components were aged in the air for 10 h. The sensitivity response, operating temperature, and stability of the preparations were tested on the CGS-1TP Intelligent Gas Sensitive Analysis System (Beijing Elite Technology Co., Ltd., Beijing, China).
3. Results and Discussion
3.1. Microstructure and Morphology
To determine the calcination temperature of the ZnSnO3 precursor obtained by electrospinning methods, TG tests were carried out on the ZnSnO3 precursor under an air atmosphere in the temperature range of 30–600 °C with a heating rate of 15 °C/min; the results are shown in Figure 1a. Figure 1a shows an 8 wt % drop in sample mass at 300 °C. This is due to the evaporation of organic solvents and the evaporation of gases and moisture adsorbed on the surface of the ZnSnO3 precursor. The sharp decrease in sample mass around 350 °C can be attributed to the decomposition of the precursor, while the significant drop in the curve around 400 °C can be attributed to the decomposition of PVP. In addition, no significant weight changes are observed above 450 °C, which proves that all organic matter in the precursor decomposes at 450 °C and that calcination of the precursor at temperatures higher than 450 °C is sufficient. Figure 1b shows the XRD results of the ZnSnO3 and ZnSnO3/ZnO precursors after 2 h of calcination at 450 °C. A comparison with the standard card (PDF No. 28–1486) shows that the XRD diffraction peaks at 2θ of 26.5°, 33.7°, 37.7°, 51.6°, and 54.6° correspond to the (012), (110), (015), (116), (018), and (214) crystal planes of the ZnSnO3, respectively. The remaining XRD diffraction peaks are compared with the standard card (PDF No. 65–3411) and are found to correspond to (100), (101), (102), and (110) crystal planes at 2θ of 31.7°, 36.3°, 47.5°, and 56.6°, respectively. The XRD diffraction peak corresponding to the standard card (PDF No. 65–3411) is the diffraction peak of ZnO. The results show that ZnSnO3 and ZnSnO3/ZnO nanofibers are successfully synthesized after calcination in air at 450 °C for 2 h.
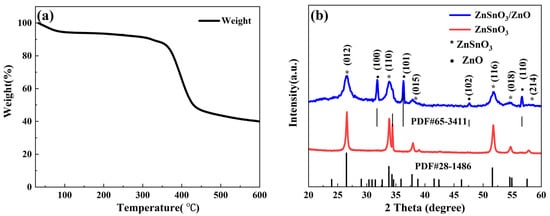
Figure 1. (a) TG results of ZnSnO3 precursors; (b) XRD patterns of ZnSnO3 and ZnSnO3/ZnO calcined at 450 °C.
Figure 2a,b show the SEM results of the ZnSnO3 samples prepared after calcination at 450 °C for 2 h in an air atmosphere. From Figure 2a, the ZnSnO3 samples after calcination at 450 °C for 2 h in an air atmosphere are coarse and uniformly fibrous, with no breakage of the continuous fibers. The average diameter of the ZnSnO3 sample is about 300–400 nm, as shown in Figure 2b. Figure 2c,d show the SEM results of ZnSnO3/ZnO samples prepared after calcination at 450 °C for 2 h in an air atmosphere. As can be seen in Figure 2c, the ZnSnO3/ZnO samples exhibit uniformly coarse and fine fibers with no fracture in the fiber continuity. The average diameter of the ZnSnO3/ZnO nanofibers is even smaller, around 200 nm, as shown in Figure 2d. The TEM image in Figure 2d indicates that the ZnSnO3/ZnO nanofibers have a hollow structure. According to the results of Li et al. [21], the morphology of nanofibers or nanotubes is mainly dependent on the calcination temperature. During calcination, PVP is gradually removed as the temperature increases. The decomposition of the drug and the evaporation of the solvent will generate a variety of gases. When the calcination temperature reaches 450 °C, the rate of gas production from the decomposition of pharmaceuticals is too fast, and the pressure difference between the interior and exterior of the nanofibers is more considerable, so the hollow structure is formed [21]. The above experiments show that the diameter of the ZnSnO3/ZnO nanofibers obtained by compounding ZnSnO3 with ZnO is significantly reduced compared to the ZnSnO3 nanofiber samples. The BET analysis shows that the specific surface area of the ZnSnO3/ZnO nanofibers (31.24 m2·g−1) was substantially larger than that of pristine ZnSnO3 nanofibers (20.15 m2·g−1), as shown in Figure 2e,f.
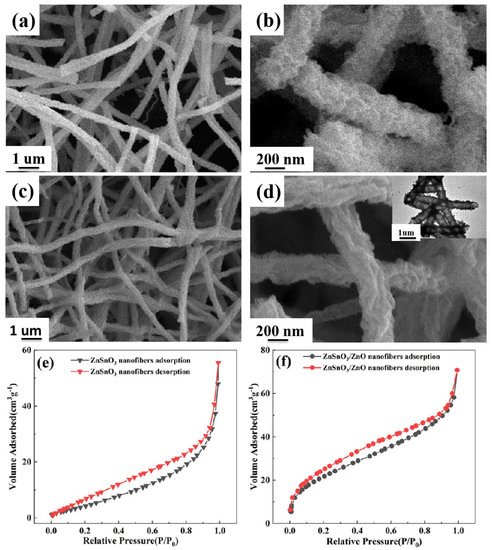
Figure 2. SEM images of ZnSnO3 and ZnSnO3/ZnO: (a,b) ZnSnO3, (c,d) ZnSnO3/ZnO, the inset in (d) TEM image of ZnSnO3/ZnO; (e,f) N2 adsorption–desorption isotherms of ZnSnO3 and ZnSnO3/ZnO nanofibers.
XPS is carried out to study the elemental composition and valence states in ZnSnO3/ZnO, and the results are shown in Figure 3. Figure 3a shows the full XPS spectrum of the ZnSnO3/ZnO nanofibers; thwe researchers ccan observe that the obtained ZnSnO3/ZnO nanofibers contain the elements Zn, Sn, C, and O. The peak at 284.8 eV corresponds to the spin-orbit peak of C 1s. The broad XPS spectrums of the Zn 2p range, Sn 3d, and O 1s range are shown in Figure 3b–d. In the case of the Zn 2p spectrum, the Zn 2p peak can be distributed into two signals, as shown in Figure 3b. The Zn-2p3/2 and Zn-2p1/2 signals are focused at 1021.1 eV and 1044.1 eV, respectively, which indicates that the chemical valence of Zn in the system is +2 [22]. As shown in Figure 3c, the two peaks at 486.8 and 495.1 eV correspond to the Sn 3d5/2 and Sn 3d3/2 spin-orbit peaks, respectively. The bimodal spin-orbit shows a split value of approximately 8.3 eV, indicating the presence of Sn4+ cations [23]. The O 1s spectrum of the ZnSnO3 and ZnSnO3/ZnO is illustrated in Figure 3d,e, which is deconvolved into three characteristic peaks by Gaussian fitting [16][24][16,24]. The three fitting peaks are attributed to three essential oxygen species [25], which are denoted as OL, OV, and OC, respectively, corresponding to O2− species in the lattice oxygen species, vacancy oxygen species (VOS), and chemically adsorbed or dissociated oxygen species, respectively [26]. The three characteristic peaks of O 1s in the ZnSnO3 nanofibers are located at 530.06 eV, 531.65 eV, and 533.13 eV. In contrast, the distinct peaks of O 1s in the ZnSnO3/ZnO nanofibers are located at 529.99 eV, 531.33 eV, and 532.27 eV, which can be ascribed to the three significant oxygen species, represented as OL, OV, and OC, respectively [17][27][17,27]. It must be pointed out that the gas-sensing properties may be highly dependent on the type of VO (vacancy oxygen) present on the semiconductor surface [28]. The proportion of oxygen species in the obtained ZnSnO3 and ZnSnO3/ZnO nanofibers are shown in Figure 3f and Table 1. The results of Figure 3f and Table 1 clearly indicate that compared with the percentage of Ov of ZnSnO3 nanofibers, that of ZnSnO3/ZnO nanofibers is substantially larger.
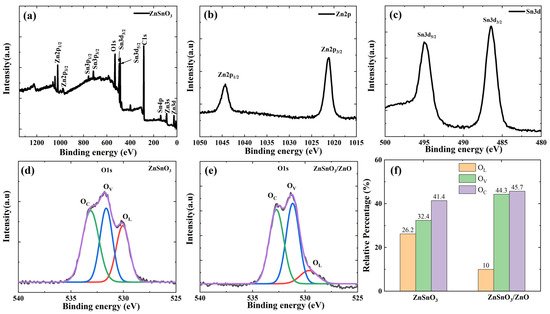
Figure 3. XPS spectra of ZnSnO3/ZnO nanofibers: (a) a survey spectrum, high-resolution spectra for (b) Zn 2p, (c) Sn 3d, (d) O 1s (of ZnSnO3), (e) O 1s (of ZnSnO3/ZnO), (f) fitting results of O 1s XPS spectra of ZnSnO3 and ZnSnO3/ZnO.
Table 1. The proportion of oxygen species in obtained ZnSnO3 and ZnO/ZnSnO3 nanofibers.
| Sample | O | L | (%) | O | V | (%) | O | C | (%) |
|---|---|---|---|---|---|---|---|---|---|
| ZnSnO | 3 | 26.2% | 32.4% | 41.4% | |||||
| ZnSnO | 3 | /ZnO | 10% | 44.3% | 45.7% |
3.2. Gas-Sensitive Performances of ZnSnO3/ZnO Nanofibers
It is well known that changes in operating temperature can highly influence the gas-sensing performances of sensing materials. To verify this, the response of the ZnSnO3 nanofibers and ZnSnO3/ZnO composite nanofibers toward 50 ppm ethanol gas is tested at different temperatures, and the results are shown in Figure 4. For n-type devices, the response value (S) of the reducing gas sensors are defined as S = Ra/Rg, where Ra is the resistance of the sensor in air, and Rg is the resistance of the device in the target gases.
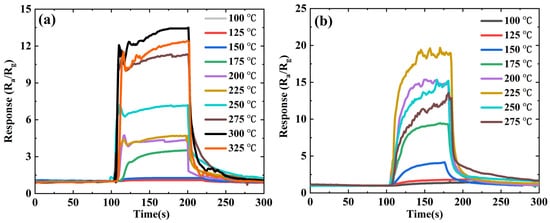
Figure 4. Response of ZnSnO3 and ZnSnO3/ZnO toward 50 ppm ethanol at different temperatures: (a) ZnSnO3; (b) ZnSnO3/ZnO.
Figure 4a shows that the response of the ZnSnO3 sample increases with increasing temperature until the temperature rises to 300 °C; the maximum response value is 13.4. Then, as temperature increases, the response decreases. Figure 4b shows the sensing response of the ZnSnO3/ZnO composite nanofibers toward 50 ppm ethanol gas at different temperatures. The results show that the optimum operating temperature and the maximum sensing response value for ZnSnO3/ZnO composite nanofibers are 225 °C and 19.6, respectively. The optimum operating temperature of the ZnSnO3/ZnO composite nanofibers is significantly lower than that of the ZnSnO3 nanofibers. The sensing response has also been improved, with a 46.3% increase in the sensing response.
To further investigate the gas-sensing performance of the ZnSnO3/ZnO composite nanofibers, the response of the ZnSnO3 and ZnSnO3/ZnO nanofibers in the different concentrations of ethanol and the stability of the response to 50 ppm ethanol was tested at the optimum operating temperature, respectively. The results are shown in Figure 5. As shown in Figure 5a, the response of the ZnSnO3 nanofibers increases with increasing ethanol concentration because with increasing ethanol concentration, more ethanol molecules react with the oxygen ions adsorbed on the surface of the material, resulting in a higher carrier concentration and thus a subsequent increase in the response of the material. Figure 5b shows that the response of the ZnSnO3/ZnO composite nanofibers increases with increasing ethanol concentration. In contrast, the response of the ZnSnO3/ZnO samples is higher than that of the ZnSnO3 samples at the same concentration of ethanol.
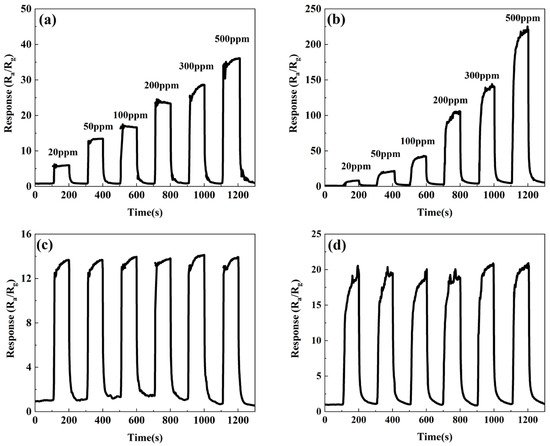
Figure 5. Response of ZnSnO3 and ZnSnO3/ZnO to different concentrations of ethanol at the optimal working temperature: (a) ZnSnO3; (b) ZnSnO3/ZnO; the stability of response to 50 ppm ethanol at optimum operating temperature: (c) ZnSnO3; (d) ZnSnO3/ZnO.
Figure 5c,d show the response stability of the ZnSnO3 sample and the ZnSnO3/ZnO samples under ethanol atmosphere at 50 ppm, respectively. As can be seen from Figure 5c,d, the ZnSnO3 and ZnSnO3/ZnO samples show no significant fluctuations in response after six repeated exposures to ethanol at 50 ppm, indicating that both the ZnSnO3 and ZnSnO3/ZnO samples have good stability. The above experimental results show that the ZnSnO3/ZnO samples have a lower working temperature, higher response, and better stability for ethanol atmosphere than that of the ZnSnO3 samples.