Based on literature review, expert consensus, and the fuzzy analytic hierarchy process, researchers developed an innovative smart city evaluation framework. In the framework, an index comprising three dimensions, i.e., smart economy, smart society, and smart environmental protection, as well as several attributes for these dimensions for smart city evaluation were established.
1. Introduction
The development of smart city is a crucial strategy for China’s new urbanization. Starting from the interpretation of smart city, current study first introduced the definition of smart city based on previous research, and explored four characteristics of smart cities, i.e., the interconnection, fusion, cooperation, and application of urban information system. The increasing maturity of technologies such as 5G and IoT has facilitated the development of smart cities. However, evaluation frameworks for smart cities require updating and innovation. Thus, a comprehensive smart city evaluation framework was established based on the current requirements for smart city development. The goals of the framework are to evaluate the effects of smart city in different regions, improve the deficiencies in smart city research, and provide support for the future city development and planning. In current study, the cities in Jiangsu Province, China, were assessed using the developed innovative index framework for smart city evaluation in the 5G era. A fuzzy analytic hierarchy process (AHP) was employed to integrate expert opinions to select the evaluation criteria [13][1]. In the discussion of results, some suggestions for smart economy, smart society, and smart environmental protection policies were proposed to promote the efficient development of smart cities in Jiangsu Province.
2. Analysis of Index Weights
First, the indexes were literately reviewed and summarized at an in-depth interview phase of same expert groups. After the experts reached a consensus, the key indexes were determined and the hierarchical structure was established. Then, the hierarchical levels of the systematical structure were ascertained with the information provided by AHP, and the weights of different criteria at the same level with great differences but correlations were calculated, thereby providing the basis for decision-makers in selection and decision making. All of these can help decision-makers to make the best decision. In current study, the weight of each factor in the hierarchical structure was obtained, and the schemes were sorted to judge their pros and cons.
In order to solve the transitivity problem in pairwise comparison during expert opinion survey, the confidence degree of the consistency test with AHP was determined via one-to-one in-depth interview. The smart city evaluation framework was divided into target, dimension, and index layers, and the evaluation factors were subjected to pairwise comparisons to obtain the importance weighting of each factor in the previous level, and a judgment matrix was established. Subsequently, the results of the personal linguistic scale survey were fuzzified, and the final weight values of each evaluation factor were acquired.
Smart economy had the largest weight (0.427), followed by smart society (0.339) and smart environmental protection (0.234); thus, smart economy was more important than either smart society or smart environmental protection. Therefore, a better smart economy in a city indicates that the smart city has a higher level. For smart economy, smart society, and smart environmental protection, the factors of GDP per capita, opening and sharing of government information and resources, and green coverage in built-up areas had the largest weights of 0.229, 0.187, and 0.098, respectively.
By comparing the various factors and indexes, the overall weight ranking was: GDP per capita (0.229) > opening and sharing of government information and resources (0.187) > state of technological innovation (0.109) > green coverage in built-up areas (0.098) > science and technology expenditures (0.090) > state of IoT development (0.087) > environmental protection (0.078) > 5G coverage (0.066) > harmless treatment rate of domestic refuse (0.058).
The linear weighted summation method was used in current study to calculate the comprehensive index values of the standardized results and the weights obtained by the FAHP. Finally, the comprehensive values for the evaluation of smart city in each prefecture-level city of Jiangsu were obtained.
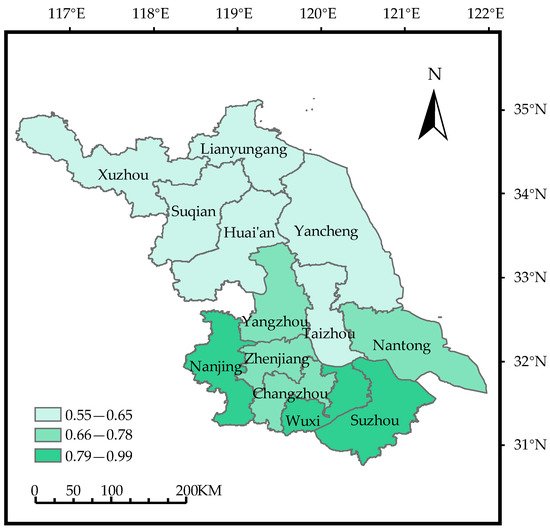
Figure 1 reveals that Nanjing, Wuxi, and Suzhou had the highest scores; Yangzhou, Zhenjiang, Changzhou, and Nantong had slightly lower scores; and Xuzhou, Lianyungang, Suqian, Huai’an, Yancheng, and Taizhou had the lowest scores. Overall, the state of smart city development in Jiangsu’s prefecture-level cities is directly proportional to the level of regional economic development. Clear regional divisions are present between southern, central, and northern Jiangsu, and the government should speed the construction in central and northern Jiangsu while developing southern Jiangsu to promote the balanced development of smart cities in the province.
Figure 1. Comprehensive evaluation analysis.
According to the comprehensive ranking obtained by FAHP, Suzhou, Nanjing, Wuxi, and Changzhou are at the forefront of smart city development in Jiangsu.
2.1.1. Suzhou, Nanjing, Wuxi, and Changzhou
Suzhou is a national high-tech industrial base and is one of the crucial central cities in the Yangtze River Delta city cluster. Adjacent to Shanghai, it performs industrial transfer from Shanghai and connects to its industries. Additionally, transportation, government policy, and tourism industry have facilitated the development of Suzhou. Nanjing, as the provincial capital, has undergone rapid development due to its advantageous geographical location, scientific educational resources, and policy support. The swift development of the high-tech industry and economy has accelerated the development of Nanjing. Furthermore, the cultural atmosphere due to Nanjing’s numerous universities is also unique to the city. Wuxi, adjacent to Suzhou, is located at the center of the Suzhou–Wuxi–Changzhou metropolitan area. It has substantial natural resources, transportation facilities, high-tech companies, and cultural and educational resources. Finally, Changzhou, which is bordered by Wuxi in the east and Nanjing in the west, enables industrial transfer and connections between the Yangtze River Delta cluster, the Suzhou–Wuxi–Changzhou metropolitan area, and Nanjing, further promoting the rapid development of Changzhou.
2.1.2. Nantong, Yangzhou, Zhenjiang, and Taizhou
Nantong, Yangzhou, Zhenjiang, and Taizhou, the four central regions of Jiangsu, scored lower than the four cities in southern Jiangsu in the smart city evaluation. Nantong, also known as “northern Shanghai”, has excellent developmental potential as a national pilot smart city. Yangzhou is part of the Nanjing metropolitan circle and the Yangtze River Delta city cluster, and has stable economic development driven by the economies of Shanghai and Nanjing. Zhenjiang is located in south-central Jiangsu with Nanjing in the west, Changzhou to its south, and Yangzhou in the north; thus, it is a crucial transportation hub in east China. However, the domestic refuse treatment in Zhenjiang is poor, and its level of smart city development requires improvement. Located in central Jiangsu, Taizhou is an essential part of the Yangtze River city cluster and is the gateway to central Jiangsu. Due to its distance from Shanghai and Nanjing, the development and construction speed in Taizhou is slower than that in southern Jiangsu, and its smart city development could be improved substantially.
2.1.3. Xuzhou, Yancheng, Huai’an, Suqian, and Lianyungang
Smart city development in Xuzhou, Yancheng, Huai’an, Suqian, and Lianyungang clearly lags southern Jiangsu. Following the implementation of government informatization, numerous departments of Xuzhou have achieved efficient internal management; however, their information systems are independent, leading to difficulties optimizing the use of its information resources. In the 5G era, Yancheng should focus on improving connectivity through 5G construction projects and accelerating smart city development by applying these networks. The smart city development in Huai’an also lags among the cities in Jiangsu. Huai’an’s green coverage in built-up areas is the lowest among the cities in Jiangsu, highlighting the necessity of efforts to improve smart environmental protection. The key to building a smart city is the economy because economic improvements lead to improved material wealth and living standards. The economic development of Suqian is also relatively low in Jiangsu. Smart city development in Suqian could be enhanced by promoting economic development and GDP per capita growth. The informatization level of Lianyungang is relatively low. In the process of building a smart city, applying modern information technology and informatization in ports to improve their operational efficiency is necessary. Moreover, Lianyungang should improve its technological innovation and increase its investment in science and technology.
2.2. Subitem Analysis of Smart Economy Indexes
2.2.1. GDP per Capita
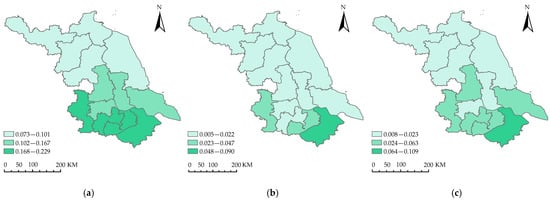
The southern Jiangsu region is located at the core area of the Yangtze River Delta. It is geographically close to Shanghai and its cities are advantaged by their proximity to current major city. The central Jiangsu region is located in the subcentral region of the Yangtze River Delta Economic Zone along the northern bank of the lower reaches of the Yangtze River; southern Jiangsu and Shanghai are immediately across the river. The northern Jiangsu region is located at the edge of the Yangtze River Delta Economic Zone, and is thus less affected by Shanghai, the core city of the economic zone (Figure 2a).
Figure 2. Sub-item analysis of the smart economy indexes. (a) GDP per capita; (b) Science and technology expenditures; (c) State of technological innovation.
2.2.2. Science and Technology Expenditures
Science and technology expenditures reflect the expenditures for all scientific and technological activities of enterprises, such as applications of scientific research and experimental results, scientific and technological education and training, and other related services. Suzhou had the highest science and technology expenditures, followed by Wuxi and Nanjing; other regions had inadequate expenditures. Overall, science and technology expenditures are directly proportional to regional economic development (Figure 2b).
2.2.3. State of Technological Innovation
Technological innovation requires a favorable cultural environment. The southern Jiangsu region has a strong cultural atmosphere and high technological innovation; the northern region has relatively lower innovation. Moreover, the education system also affects the state of technological innovation. Nantong, the prefecture-level city with the strongest education programs in Jiangsu, also has higher technological innovation. Due to the economic development, cultural atmosphere, and educational support in northern Jiangsu, its technological innovation is inferior to that of southern Jiangsu (Figure 2c).
2.3. Subitem Analysis of Smart Society Indexes
2.3.1. Opening and Sharing of Government Information and Resources
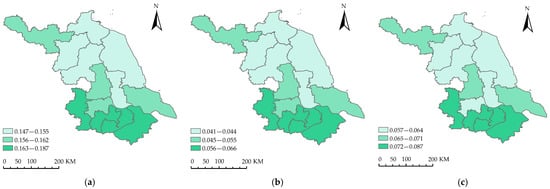
Opening and sharing of government information and resources is the principles of integrating resources, promoting sharing, and strengthening security. Nanjing, Changzhou, Wuxi, and Suzhou have strong resource integration and sharing capacities; Xuzhou, Yangzhou, and Nantong are slightly weaker in these aspects. Lianyungang, Suqian, Huai’an, Yancheng, Taizhou, and Zhenjiang perform poorly in the aforementioned aspects, and the government should improve the opening and sharing of information resources (Figure 3a).
Figure 3. Subitem analysis of the smart society indexes. (a) Opening and sharing of government information and resources; (b) 5G coverage; (c) State of IoT development.
2.3.2. 5G Coverage
Research and development and the wide application of the new generation of information technology have elevated the innovation capacities of cities. Figure 5b reveals that Nanjing, Changzhou, Wuxi, and Suzhou have focused more on 5G construction, whereas Xuzhou, Yangzhou, Zhenjiang, and Nantong have not made a large investment into these technologies. Further investment in 5G construction is particularly required in Lianyungang, Suqian, Huai’an, Yancheng, and Taizhou.
2.3.3. State of IoT Development
The goal of constructing and developing IoT is to provide full sensing and efficient management and supply excellent services in accordance with the sustainable urban development philosophy. IoT technology is more widely used in Nanjing, Changzhou, Wuxi, and Suzhou; however, Xuzhou, Yangzhou, and Nantong have less 5G development. Further improvements in IoT deployments are required in Lianyungang, Suqian, Huai’an, Yancheng, Taizhou, and Zhenjiang (Figure 3c).
2.4. Subitem Analysis of Smart Environmental Protection Indicators
2.4.1. Green Coverage in Built-Up Areas
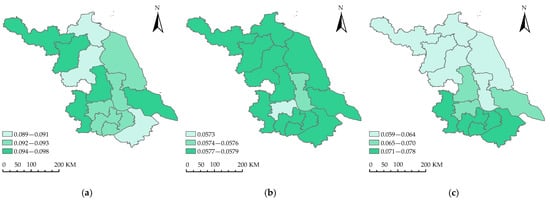
Green coverage in built-up areas refers to the percentage of green coverage in built-up areas in cities. According to Figure 4a, Xuzhou, Suqian, Yangzhou, Nanjing, and Nantong have a relatively higher green coverage, followed by Yancheng, Taizhou, Zhenjiang, Changzhou, and Wuxi. Lianyungang, Huai’an, and Suzhou have the lowest green coverage in built-up areas.
Figure 4. Sub-item analysis of the smart environmental protection index. (a) Green coverage in built-up areas; (b) Harmless treatment rate of domestic refuse; (c) Environmental protection.
2.4.2. Harmless Treatment Rate of Domestic Refuse
Harmless treatment rate of domestic refuse refers to the percentage of the amount of urban refuse that is treated in a harmless manner in relation to the total amount of urban domestic refuse. The general requirement for harmless treatment rate of domestic refuse is ≥85%. Figure 4b shows that all prefecture-level cities in Jiangsu meet the aforementioned standard.
2.4.3. Environmental Protection
Environmental protection in smart cities involves the use of IoT technology for environmental management and decision making in a targeted and responsive manner. According to Figure 4c, Nanjing, Changzhou, Wuxi, and Suzhou had superior results for environmental protection, followed by Yangzhou, Zhenjiang, and Nantong. By contrast, Xuzhou, Lianyungang, Suqian, Huai’an, Yancheng, and Taizhou performed relatively poorly in environmental protection; thus, the governments of these cities should make further improvement in this aspect.
3. Conclusion
Among the dimensions of smart economy, smart society, and smart environmental protection, smart economy had the highest weight, indicating that this dimension can best reflect the smart city level. Accordingly, its indexes also substantially reflect the development level of smart cities.
The development of smart cities is affected by numerous indexes, in which the GDP per capita, opening and sharing of government information and resources, and the state of technological innovation have the greatest weights. Economic improvements should be a major focus of currently developing smart cities, and the opening of government resources and technological innovation should be a secondary goal.
Despite the overall high level of smart city evaluation in Jiangsu, large regional differences were observed. The development of southern Jiangsu is greater than that of central and northern Jiangsu; northern Jiangsu was the least developed. Thus, southern Jiangsu should exercise its influence to assist cities in other regions. Moreover, cities in central and northern Jiangsu should innovate and expand construction to meet their individual needs, learn from the development models of leading cities, and accelerate their smart city development.
In actual applications, AHP may produce some unreasonable phenomena such as the reversion of evaluation results due to the limitations in expert group thinking or the difficulty in information acquisition. The opinions of different experts or scholars should be integrated and served as the evaluation basis in decision making. In some cases, decision-makers differ greatly in terms of the cognition of various decision-making attributes and some evaluators cannot reflect the evaluation results because of low weights. The calculated geometrical average is no longer suitable and the decisions cannot really reflect actual condition. The limitations of the present research can be improved by future researchers with more qualitative in-depth interview.