COVID-19 is an inflammatory disease caused by SARS-CoV-2 and can manifest as various symptoms ranging from mild symptoms or asymptomatic cases to severe pneumonia that can progress to acute respiratory distress syndrome (ARDS) and death. The entry describes a study assessed the utility of various inflammatory markers in predicting mortality among hospitalized patients with COVID-19.
1. Introduction
COVID-19 has a three-phase progression: initial disease caused by active infection, a second pulmonary phase, and, when severe, a third phase described by hyper-inflammation, cytokine storm, elevated biomarker levels of cardiac injury, and significant morbidity and mortality [10]. Serum biochemical analysis and blood count analysis are commonly used blood tests, which could be faster, easier to use, and low-cost techniques that can facilitate the diagnosis and prognosis of this disease [11]. From these routine tests, inflammatory markers have been used for predicting the severity of COVID-19 such as neutrophil to lymphocyte ratio (NLR), derivate neutrophil to lymphocyte ratio (dNLR), monocyte to lymphocyte ratio (MLR), and platelet to lymphocyte ratio (PLR) [11,12]. NLR and PLR are biomarkers reflecting systemic inflammation, neutrophil and platelet activation, and are associated with increased mortality in cardiovascular disease and poor prognosis in various cancers or in polycythemia vera [13,14,15]. In addition, a higher NLR, and decreased PLR were predictive of poor survival in patients with myelofibrosis [16]. Derived neutrophil-to-lymphocyte ratio (dNLR) is a potential new biomarker for systemic inflammation, defined as the absolute neutrophil count (ANC)/white cell count (WBC)—absolute neutrophil count (ANC), and has prognostic value in patients with several types of cancer [17,18,19]. Unlike NLR, dNLR includes monocytes and other granulocytes by using the difference between WBC and neutrophils in the denominator. Poorly differentiated and immature neutrophils can be released into a pro-inflammatory environment, which rapidly increases neutrophil generation, thus dNLR is likely to reflect this negative inflammation more comprehensively [17,19]. The systemic inflammatory response index (SIRI) may also reflect the host’s immune and inflammatory balance [20]. In addition, systemic immune-inflammation index (SII), defined as platelet count × NLR, is effective in reflecting inflammatory status, being a basic biomarker for predicting the prognosis [12]. The current study assesses the utility of various inflammatory markers in predicting mortality among hospitalized patients with COVID-19.
2. Participants Characteristics
A total of 108 patients diagnosed with COVID-19 were enrolled in the study and followed up during hospitalization. The average hospitalization duration was 11.89 (SD: 6.56) days. The mean (SD) age of patients was 63.31 (14.83) years, and more than half were men (51.9%). The overall number of in-hospital deaths was 17 (15.7%). Compared to patients in the survivor cohort, in-hospital dead patients were significantly older, but no significant difference was observed in terms of gender. The most common comorbidity was hypertension (70.4%), followed by other heart diseases (47.2%) diabetes (46.3%), and chronic lung disease (21.3%). Except for heart disease, there was no statistically significant difference in the comorbidity frequency between surviving and dead patients. The laboratory data of all patients on admission are shown in Table 1. Several variables were significantly associated with poor outcomes, dead patients had lower lymphocyte and platelet counts, and higher NLR, dNLR, MLR, and SIRI.
Table 1. Baseline characteristics and laboratory test results in 108 hospitalized patients with COVID-19.
| |
Total |
Survivors
91 (84.3%) |
Deaths
17 (15.7%) |
p | Value |
The adjusted OR in each of the NLR, d-NLR, MLR and SIRI.
| Variables |
Adjusted OR * |
p Value |
| Age |
(Mean ± SD) |
63.31 ± 14.83 |
62.02 ± 14.73 |
70.18 ± 13.83 |
0.03 |
| 4.11 ± 4.67 |
| 7.02 ± 6.72 |
| 0.03 |
| O |
| 2 |
| Saturation * |
| 91.96 ± 6.16 |
| 92.26 ± 5.96 |
| 90.35 ± 7.13 |
| 0.24 |
| Hospitalization length |
11.89 (6.56) |
12.96 |
6.18 |
<0.001 |
3. Using Optimal Cut-Off Values of Inflammatory Markers to Predict Mortality in Patients with COVID-19
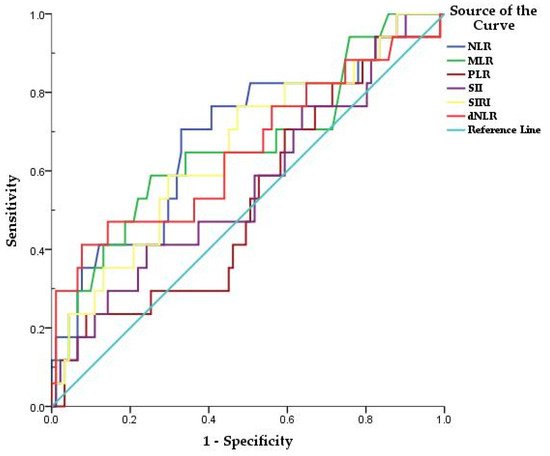
Receiver operating characteristic (ROC) curves of NLR, dNLR, MLR, PLR, SII, and SIRI were created to determine whether the baseline of these biomarkers was predictive mortality in patients with COVID-19 (Figure 1). The areas under the curve (AUC) of NLR, dNLR, MLR, SIRI were above 0.6 (Table 2). The optimal cutoff obtained from Youden’s index is listed in Table 2. PLR and SII had AUC <0.6 (0.525 and 0.564 respectively) and no statistical significance (p > 0.05) being excluded.
Figure 1. Receiver operating characteristic (ROC) curves of NLR, DNLR, MLR, PLR, SII, and SIRI in predicting death, in patients with COVID-19.
Table 2. Receiver operating characteristics (ROC) curves, prognostic accuracy of inflammatory markers, and optimal cutoff.
| Variables |
Area |
Std. Error |
| NLR |
| Comorbidities |
No. (%) |
|
|
|
|
| dNLR |
0.652 |
0.082 |
0.047 |
0.491 |
0.813 |
41% |
92% |
9.6 |
4. Association of Inflammatory Biomarkers Results with The COVID-19 Mortality
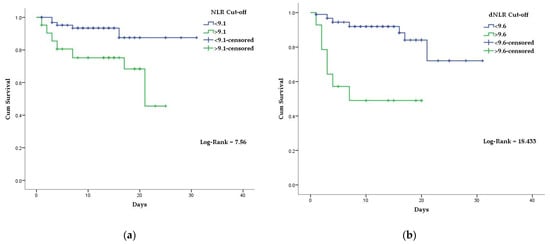
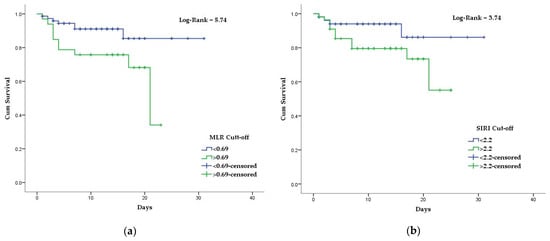
Kaplan–Meier curves and the univariate Cox regression model were created, using the established NLR, dNLR, MLR, and SIRI cutoff points. Mean survival time for COVID-19 patients above the stated NLR, dNLR, MLR, and SIRI cutoff values were 18.2 days, 11.4 days, 17.1 days, and 19.5 days, respectively. In comparison, the mean survival time for COVID-19 patients with bellow the stated NLR, dNLR, MLR, and SIRI cutoff values were 28.3 days, 26.5 days, 27.7 days, and 28.0 days, respectively (Figure 2 and Figure 3). Differences in survival for patients above the baseline reported NLR, dNLR, and MLR compared to those below the baseline were highly statistically significant (p < 0.001 for each). However, the differences in survival for patients with SIRI values above the stated cutoff compared to those below the cutoff were not statistically significant (p = 0.05).
Figure 2. Kaplan–Meier survival curves of hospitalized COVID-19 patients: (a) according to established NLR cutoff values; (b) according to established dNLR cutoff values.
Figure 3. Kaplan–Meier survival curves of hospitalized COVID-19 patients: (a) according to established MLR cutoff values; (b) according to established SIRI cutoff values.
Furthermore, univariate Cox regression analysis showed that NLR, dNLR, and MLR were independent predictors of in-hospital mortality (Table 3).
Table 3. Hazard ratios of the indexes obtained by univariate Cox regression analysis.
| Variables |
HR (95%CI) |
p | Asymptotic Sig. |
95%
Confidence
Interval |
Sensitivity |
Sensibility |
Cut-Off |
| Value |
Lower |
Upper |
|---|
| NLR |
0.689 |
0.074 |
0.014 |
4.14 | 0.544 |
0.833 |
70% |
67% |
9.1 |
| MLR |
0.661 |
| NLR |
3.85 (1.35–10.95) |
0.01 |
| 0.078 |
0.036 |
0.508 |
0.813 |
58% |
74% |
| dNLR | 0.69 |
| 0.002 |
6.4 (2.40–17.18) |
<0.001 |
| dNLR |
14.09 |
0.001 |
Diabetes |
50 (46.3%) |
40 (44.0%) |
10 (58.8%) |
0.29 |
| SIRI |
0.655 |
0.074 |
0.042 |
0.511 |
0.800 |
76% |
52% |
2.2 |
| MLR |
3.05 (1.16–8.05) |
0.02 | Hypertension |
| MLR |
3.29 |
0.04 |
76 (70.4%) |
62 (68.1%) |
14 (82.4%) |
0.38 |
| SIRI |
3.06 |
0.08 |
Heart diseases |
51 (47.2%) |
38 (41.8%) |
13 (76.5%) |
0.01 |
| Chronic lung diseases |
23 (21.3%) |
17 (18.7%) |
6 (35.3%) |
0.19 |
| Complete blood count |
(Mean ± SD) |
|
|
|
|
| White blood cell (×10 | 12 | /L) |
8.71 ± 5.74 |
8.71 ± 5.76 |
8.73 ± 5.81 |
0.98 |
| Neutrophil count (×10 | 9 | /L) |
6.96 ± 4.36 |
6.75 ± 4.18 |
8.06 ± 5.19 |
0.25 |
| Lymphocyte count (×10 | 9 | /L) |
0.98 ± 0.78 |
1.03 ± 0.82 |
0.73 ± 0.44 |
0.03 |
| Monocyte count (×10 | 9 | /L) |
0.47 ± 0.32 |
0.47 ± 0.32 |
0.51 ± 0.33 |
0.64 |
Hemoglobin
(g/dL) |
13.15 ± 1.78 |
13.27 ± 1.64 |
12.50 ± 2.36 |
0.10 |
Platelet count
(×10 | 9 | /L) |
242 ± 109 |
252 ± 112 |
192 ± 79 |
0.03 |
| Inflammatory markers |
|
|
|
|
| NLR |
9.18 ± 6.7 |
8.31 ± 5.74 |
13.83 ± 9.23 |
0.001 |
| MLR |
0.58 ±0.44 |
0.53 ± 0.39 |
0.83 ± 0.59 |
0.01 |
| PLR |
327 ± 72 |
324 ± 219 |
345 ± 235 |
0.71 |
| dNLR |
5.16 ± 3.76 |
4.77 ± 3.45 |
7.07 ± 4.64 |
0.01 |
| SII |
2280 ± 1950 |
2183 ± 1847 |
2798.± 2429 |
0.23 |
| SIRI |
4.57 ± 5.12 |
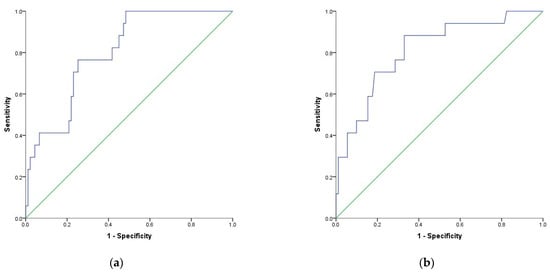
Additionally, multivariate logistic regression was performed to test the discrimination ability of NLR, dNLR, MLR, and SIRI (above or below cutoff values) as prognostics factors of mortality adjusted for age, comorbidities, COVID-19 severity, and sex. Results showed an aOR of 4.77 for NLR above 9.1 of 14.09 for dNLR above 9.6 of 3.29 for MLR above 0.69 and 3.06 for SIRI above 2.2 (Table 4). The AUC for logistic regression models used are 0.788, 0.812, 0.779, and 0.763, respectively (Figure 4 and Figure 5).
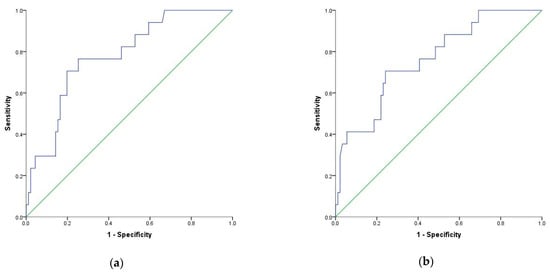
Figure 4. Receiver operating characteristic (ROC) curve for logistic regression models: (a) NLR (above or below 9.1) as a prognostic factor of mortality adjusted to age, sex and comorbidities index; (b) dNLR (above or below 9.6) as a prognostic factor of mortality adjusted to age, sex and comorbidities.
Figure 5. Receiver operating characteristic (ROC) curve for logistic regression models: (a) MLR (above or below 0.69) as a prognostic factor of mortality adjusted to age, sex and comorbidities index; (b) SIRI (above or below 2.2) as a prognostic factor of mortality adjusted to age, sex and comorbidities.
factor of mortality adjusted to age, sex and comorbidities.
* Adjustment for age, comorbidities, and sex. Each of NLR, MLR, dNLR, and SIRI were included in four different models for aOR calculation.
In conclusion, NLR, dNLR, MLR determined at hospital admission had a high value in predicting death among patients with COVID-19. Future clinical research efforts should examine strategies to reduce the effects associated with elevated levels of these indexes in order to improve treatment and reduce mortality.