A dependence of Brinell hardness and thermal diffusivity tensor components upon humidity for common pine wood is found. The results of the measurement of Brinell hardness, microhardness, Young’s modulus, and main components of thermal diffusivity tensor for three perpendicular cuts are found to be correlated. It is shown that the mechanical properties correlate better with the ratio of longitude to transversal thermal diffusivity coefficients than with the respective individual absolute values. The mechanical characteristics with the highest correlation with the abovementioned ratio are found to be the ratio of Young’s moduli in longitude and transversal directions. Our technique allows a comparative express assessment of wood mechanical properties by means of a contactless non-destructive measurement of its thermal properties using dynamic thermal imaging instead of laborious and material-consuming destructive mechanical tests
1. Introduction
It is well known that some mechanical properties of materials can be linked with simple relations due to their similar dependence on material nano- and microstructure. For instance, the hardness
H of ductile metals depends upon the yield stress σ
y, as
H ≈ 3σ
y, while for hard and superhard metals and alloys, it depends upon the shear modulus
G, as
H ≈ 0.15
G [1]. There is reason to believe that similar relations could link mechanical and thermophysical properties (TPP) of materials belonging to the same type. In particular, thermal conductivity λ and diffusivity
a [2][3][4][2,3,4] of wood and other anisotropic composite materials depend on density, porosity, humidity
[5][6][7][5,6,7], and specifics of interconnections between microstructural units of the material as hardness, Young’s modulus, and strength do
[8][9][10][8,9,10]. Once revealed, such relations could allow switching from laborious and material extensively destructive mechanical tests to non-destructive measurements of TPP using express methods, as described in
[11][12][13][11,12,13]. Typically, they require around 1 min per measurement and do not demand for cutting samples of any specific geometry. Such approach could be used to estimate relative mechanical properties, sorting, and grading of materials and products made of wood, fiber-reinforced composites etc.
There is a lot of information concerning the mechanical and thermal properties of natural
[6][8][10][6,8,10] and modified
[14] wood, wood-based layered materials
[3][15][16][3,15,16], as well as composites reinforced with artificial
[5][9][5,9] and natural organic fibers
[17][18][19][17,18,19]. For example, it is found that the thermal conductivity of bamboo measured by the classical stationary method along the fibers λ
l exceeds the transversal one λ
n by nearly 2 times
[20], and both increase linearly with material density. In
[21], the mapping of the thermal conductivity of bamboo cellular structure at the nano- and microscale was carried out by means of scanning thermal microscopy. It provided information about the relative thermal conductivity of different layers of the cell wall and revealed that the relative thermal conductivity λ* significantly depended upon the angle between the microfibers forming the specific layer of cell wall and cell long axis. Thermal conductivity and diffusivity measurements of birch wood in longitude and transverse directions were reported and discussed in
[4]. Instances of correlations between thermal conductivity and stiffness of specific layers of the cell wall can be implicitly found in
[22].
However, the mechanical and thermal properties are measured in separate tests executed on different samples and are not related to each other, except for several papers that use thermal non-destructive testing to estimate structural damage of wood
[23][24][25][23,24,25], defects
[26][27][26,27], porosity
[28], and anisotropy
[29][30][29,30] of composites and their possible impact on material mechanical properties. In
[31], a micromechanical model for the prediction of effective thermal conductivity in two- and three-phase composites is proposed.
2.Relationship between Thermal Diffusivity and Mechanical Properties of Wood
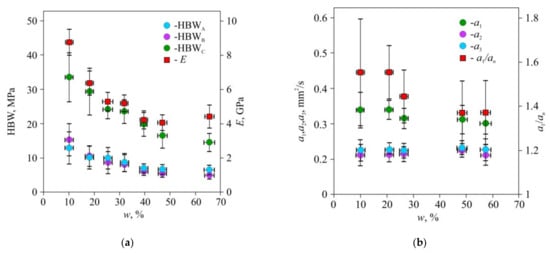
In the first stage of the experiments,
thwe
researchers sstudied Brinell hardness HBW, Young’s modulus
E (
Figure 1a), and the main components
a1,
a2, and
a3 of thermal diffusivity tensor (
Figure 1b) dependencies in common pine wood on its humidity
w. The absolute and relative values of
a1,
a2, and
a3 are affected by
w differently. The
a1 component displayed significant dependence on
w along the fibers, while across the fibers, the dependence of the components
a2 and
a3 upon
w was weak, and they were statistically indistinguishable. Hence, it was reasonable to introduce the averaged value
an = (
a2 +
a3)/2 of thermal diffusivity normal to the fibers. The relative values
al/
an that characterize thermal diffusivity anisotropy were even more sensitive to humidity change than the absolute ones (
Figure 1b).
Figure 1. Dependency of Brinell hardness HBW and Young’s modulus E (a), thermal diffusivity coefficients a1, a2, a3, and a1/an ratio (b) upon humidity w of pine wood. HBWA, HBWB, HBWC-Brinell hardness on radial, tangential, and cross-fiber cuts. E—Young’s modulus across the fibers measured by three-point bending; a1, a2, a3—tangential, radial, and cross-fiber coefficients of thermal diffusivity; an = (a2 + a3)/2.
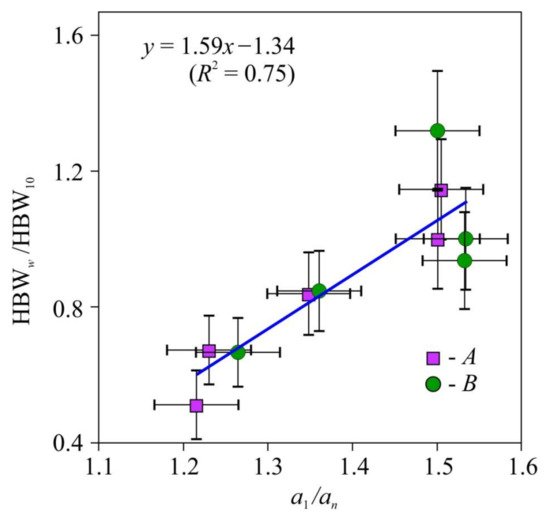
The values of hardness HBW normalized to the hardness HBW
10 at
w =10% for the lateral and radial faces were statistically indistinguishable too (
Figure 2); therefore, they were approximated as a single set by the following linear function (HBW/HBW
10) = 1.59(
al/
an) − 1.34 with the coefficient of determination
R2 = 0.75. The hardness measured on the face perpendicular to the fibers was found to be independent of tensor
aii components, so that it could be used for method and equipment calibration.
Figure 2. Dependence of the relative macrohardness HBWw/HBW10 of pine wood upon thermal diffusivity anisotropy—a1/an. HBW—Brinell hardness (12.7 mm sphere diameter, 1 mm indentation depth), a1, an—thermal diffusivity coefficients along and across the fibers. HBWw/HBW10—HBW values on the faces А and B.
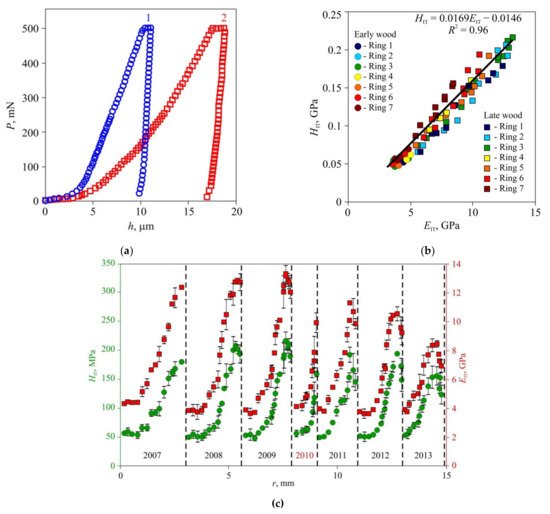
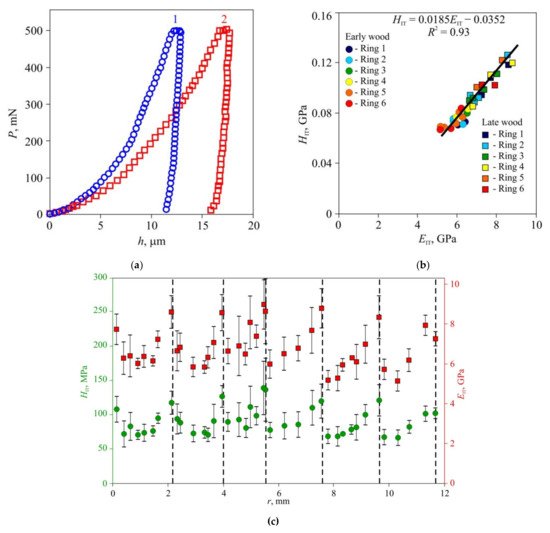
In the second stage of the experiments, microhardness and Young’s modulus in early and late wood layers, Brinell hardness HBW, and thermal diffusivity tensor main components were measured in dried wood of all three species (
Figure 3,
Figure 4 and
Figure 5). Typical
P–h curves recorded in NI for the three wood species are shown in
Figure 3a,
Figure 4a and
Figure 5a. Wood of all three species displayed pronounced periodicity of local mechanical properties (
Figure 3c,
Figure 4c and
Figure 5c). Locations of abrupt changes of
HIT and
EIT coincided with the boundaries of annual growth rings found using an optical method. Changes of
HIT and
EIT in transition regions between early and late wood in each growth ring were found to be gradual in pine and lime but stepped in oak.
HIT and
EIT were linked by a linear relation with the same slope
m = 0.017 ± 0.002 for all three species (
Figure 3b,
Figure 4b and
Figure 5b). In other words, the ductile ratio DR =
EIT/HIT for all studied species appeared to be around 60, which is typical of many wood species. For example, the DR for eucalyptus is between 54 and 68
[32][45], with an average of 61.
Figure 3. Effective microhardness HIT and Young’s modulus EIT in annual rings of pine wood, (a) Typical P–h diagrams for late (1) and early (2) wood; (b) dependence of hardness HIT upon Young’s modulus EIT for seven sequential growth rings; (c) spatial distribution of hardness HIT and Young’s modulus EIT across sequential growth rings r. The positions of ring boundaries are shown by dashed lines. The corresponding years for the growth rings are shown below the data points. An extraordinary dry year is indicated in red.
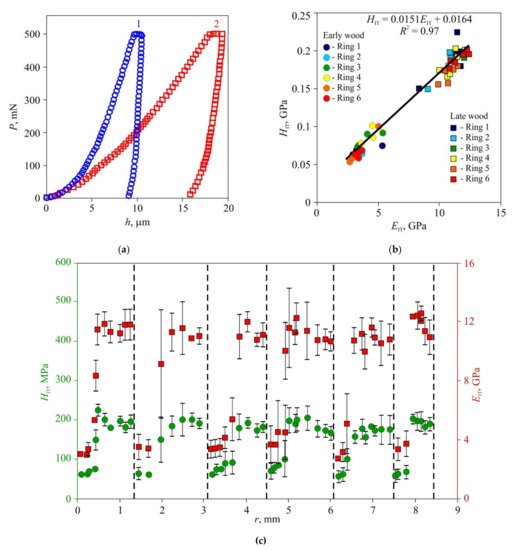
Figure 4. Effective microhardness HIT and Young’s modulus EIT in annual rings of oak wood, (a) Typical P–h diagrams for late (1) and early (2) wood; (b) dependence of hardness HIT upon Young modulus EIT for seven sequential growth rings; (c) spatial distribution of hardness HIT and Young modulus EIT across sequential growth rings r. The positions of ring boundaries are shown by dashed lines.
Figure 5. Effective microhardness HIT and Young’s modulus EIT in annual rings of lime wood, (a) Typical P–h diagrams for late (1) and early (2) wood; (b) dependence of hardness HIT upon Young’s modulus EIT for seven sequential growth rings; (c) spatial distribution of hardness HIT and Young’s modulus EIT across sequential growth rings r. The positions of ring boundaries are shown by dashed lines.
The values of
HIT and
EIT of the EW layer differed only slightly (within 10–15%) both within each ring and for different rings, despite the growth conditions differing significantly. For instance, in 2010, there was a severe drough, so that the width of the growth ring in pine wood was less than half its normal value; however, there was no discernible effect on
HIT and
EIT of EW. The lateral sizes of cells corresponding to different years had no visible difference too, but the wall thickness did differ. Therefore, the variation of the annual growth ring width was attributed to the different number of cells in the layer, while the size and mechanical properties of each cell remained almost the same. Effective hardness and Young’s modulus of the LW layers were several times higher than those of the EW layers due to higher cell wall thickness and lower lumen area.
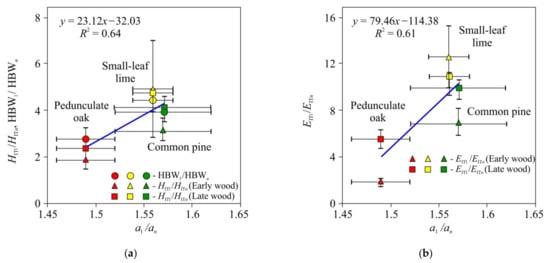
In the third stage of the experiments, tensor
aij components and Brinell hardness HBW were measured for the three wood species. Effective values of
HIT,
EIT, HBW, and thermal diffusivity anisotropy are presented in
Table 1. As can be seen, all mechanical characteristics correlated with the ratio of the main components of the thermal diffusivity tensor, and for
E, such correlation was about three times stronger than for
HIT or HBW (
Figure 6). It should be mentioned that the mechanical and thermal properties were correlated in all three studied species with significantly different microstructures.
Figure 6. Dependencies of the physico-mechanical properties HIT1 /HITn, HBW1/HBWn (a), and EIT1/EITn (b) upon thermo-physical characteristics (a1/an) for common pine, pedunculate oak, and small-leaf lime.
Table 1.
Measured micro-/macromechanical and thermal physical properties of wood of the three studied species.
| Type of Wood |
Micromechanical Properties (Obtained by
Nanoindentation with Pmax = 500 mN) |
Macromechanical Properties |
TPP |
| EIT1, GPa |
EITn, GPa |
EIT1/EITn |
HIT1, MPa |
HITn, MPa |
HIT1/HITn |
HBW1, MPa |
HBWn, MPa |
HBW1/HBWn |
a1/an |
| Common pine (Pinus sylvestris L.) |
| Early wood |
4.39
± 0.04 |
0.44
± 0.04 |
10
± 1 |
57
± 2 |
14
± 1 |
4.0
± 0.5 |
42 ± 2 |
11 ± 1 |
3.9 ± 0.7 |
1.57 ± 0.05 |
| Late wood |
12.4
± 0.7 |
1.8
± 0.2 |
7
± 1 |
180
± 10 |
58
± 4 |
3.1
± 0.4 |
| Pedunculate oak (Quercus robur L.) |
| Early wood |
3.1
± 0.2 |
1.7
± 0.2 |
1.9
± 0.3 |
64
± 3 |
34
± 5 |
1.9
± 0.4 |
67 ± 4 |
24 ± 3 |
2.8 ± 0.5 |
1.49 ± 0.03 |
| Late wood |
11.1
± 0.8 |
2.0
± 0.2 |
5.6
± 0.8 |
190
± 20 |
80
± 8 |
2.4
± 0.4 |
| Small-leaf Lime (Tilia cordata Mill.) |
| Early wood |
6.7
± 0.1 |
0.61
± 0.08 |
11
± 2 |
75
± 4 |
16
± 3 |
5
± 1 |
39.4 ± 1.5 |
8.9 ± 0.6 |
4.4 ± 0.5 |
1.56 ± 0.02 |
| Late wood |
8.6
± 0.8 |
0.68
± 0.08 |
13
± 3 |
120
± 20 |
24
± 7 |
5
± 2 |