Wilson’s disease (WD) is a rare, recessively inherited deficit of copper transportation [1,2,3] leading to increased serum levels of free copper and progressive copper intoxication of multiple organs [4]. In the central nervous system (CNS) the basal ganglia, the cerebellum as well as brainstem nuclei are mainly disturbed [5]. A broad spectrum of neurological symptoms as parkinsonian gait, tremor, dysarthria, dystonia, and chorea results [6]. Relative frequencies of initial neurological symptoms have been reported in several large case series [7,8,9] and vary widely [6]. The reported rates for abnormal gait e.g., vary between 10 [9] and 75% [10,11].
Neurological symptoms and brain dysfunction respond to copper elimination therapy [12,13]. In a study on the prognostic significance of neurologic examination findings in Wilson disease [6] initial gait abnormalities turned out to predict the change of the used total neurological score the best. However, there was no correlation between initial and final gait scores, indicating variable response of gait abnormalities to therapy. In a recent study on the spectrum of neurological symptoms in long-term treated WD-patients [14] only 20% of the patients had a clinically manifest abnormality of gait.
1. Introduction
Gait is a complex bipedal motor task which is under the control of several CNS structures, especially the basal ganglia, the cerebellum and the brainstem nuclei
[1][2][3]. Therefore, gait disturbances have to be expected in neurological WD. Quantitative measurement of free walking confirms persistent gait abnormalities in long-term treated neurological WD
[4]. These WD-patients who were diagnosed at the age of 22 in the mean walked slower than age-and sex-matched controls, but the temporal pattern controlled by the spinal and brainstem central pattern generators of walking turned out to be unimpaired
[1][4]. In another study on gait disturbances in WD frequent falls were reported in a series of about 100 WD-patients
[5]. In contrast to the mildly affected WD-patients mentioned before these patients were diagnosed at the age of 36 in the mean. This underlines the impact of early diagnosis and early onset of therapy on outcome, especially on gait in WD.
Running is an even more complex bipedal motor task than free walking
[6]. In contrast to walking, the center of gravity is only intermittently supported by one leg during running. These stance phases are separated by intervals during which both legs are in the air. This implies that the musculature of one leg and especially the forefoot has to manage the complex motor task to take over the entire body weight without any help of the other side and to push immediately back to the other side thereafter. Our hypothesis, therefore, is that running is frequently disturbed in WD even in long-term treated patients with mild gait impairment.
So far little is known about the ability of patients with long-term treated WD to perform sports activities. However, this is an important aspect of quality of life for these young patients who are severely affected when they are diagnosed.
In general, clinical studies on running of neurological patients are rare
[6][7]. During clinical neurological examination, running is usually not tested. Therefore, it does not surprise that no study on running in Wilson´s disease is available so far.
2. Demographical Data of Patients and Controls
WD-patient and control group were perfectly sex-matched (11 females and 19 males) and did not significantly differ in age, body height and body weight (see
Table 1). WD-patients had a mean age at diagnosis of 22 years (SD: 6.8 years). Duration of treatment varied between 31 and 376 months.
Table 1. Comparisons of demographical data of WD-patients and controls.
| Parameters |
|
WD-Patients
n = 30 |
Control Subjects
n = 30 |
p Value |
| age (years) |
mean (SD)
range |
34.2 (11.0)
15–56 |
32.8 (8.3)
14–51 |
p = 0.571
n.s. |
| sex |
m/f |
19/11 |
19/11 |
p = 1.0
n.s. |
| body height (cm) |
mean (SD)
range |
177.8 (10.3)
156–196 |
176.9 (9.5)
160–194 |
p = 0.73
n.s. |
| body weight (kg) |
mean (SD)
range |
72.7 (1.5)
48–126 |
73.6 (14.8)
51–105 |
p = 0.83
n.s. |
mean = mean value; SD = standard deviation; n.s. = not significant.
3. Inability to Run of WD-Patients
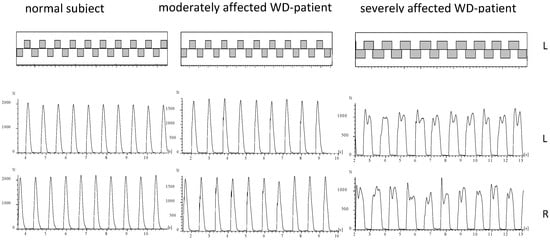
During running of a normal subject or mildly affected WD-patient the ground is touched alternatingly with the right and the left foot (
Figure 2). The time periods of ground contact are separated by time periods during which both legs are in the air (
Figure 2; upper part). In five WD-patients no segment could be detected fulfilling our criteria of running (comp. Methods; NO-RUN-group; see
Table 2). These patients were females with only one exception, tended to be more severely affected (TSC in
Table 2), and had a significantly (p < 0.03) higher N-MotS (
Table 2). The GRF-curves of these patients (an example is presented on the right sides of
Figure 2 and
Figure 3) had a double peak and a shape which is typically recorded during walking
[1]. Step frequency of running (cadence = NST/DUR) could be determined for all patients and was not significantly reduced to 2.60 s compared to 2.68 s in the controls.
Figure 2. About 10 running steps of the right and the left leg are presented for a normal subject (left side), a moderately affected WD-patient (middle part) and of a severely affected WD-patient (right side). In the upper part the temporal pattern of foot contacts is shown. In the lower part the corresponding GRF-curves are presented. The GRF-curves of the moderately affected patient (middle part) reveals clear impact peaks. The GRF-curves of the severely affected patient (right side) have double peaks as observed during walking.
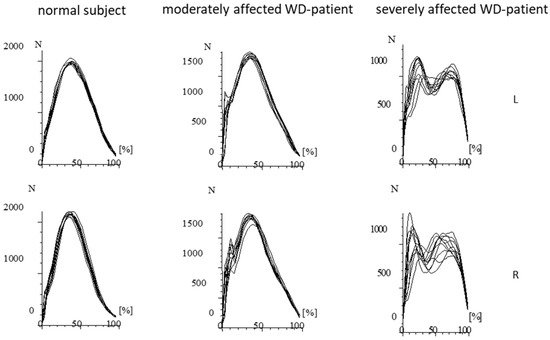
Figure 3. Superposition of the GRF-curves presented in Figure 2 after time normalization. The RF-curves of the normal subject are highly reproducible and performed with little variation. In the moderately affected patient, the variability of the GRF-curves is much higher. Impact peaks can clearly be distinguished. In the severely affected patient, double peaks consistently occur. (N = Newton; L = left foot; R = right foot).
Table 2. Comparisons of clinical data of the RUN- and NO-RUN-group.
| Parameters |
RUN Group |
NO-RUN-Group |
p Value |
| sex distribution |
m/f |
18/7 |
1/4 |
p = 0.054; n.s. |
| DUR (in second) |
mean (SD) |
17.5 (7.0) |
14.5 (1.7) |
p < 0.02 |
TSC |
mean (SD) |
4.2 (3.2) |
7.0 (6.2) |
p = 0.14; n.s. |
| NST |
mean (SD) |
MotS |
mean (SD) |
3.5 (2.4) |
4.8 (4.2) |
p = 0.34; n.s. |
| N-MotS |
mean (SD) |
0.7 (1.2) |
2.2 (1.9) |
p < 0.03 |
TSC = total score; MotS = motor score; N-MotS = non-motor score; mean = mean value; SD = standard deviation
4. Comparison of Running Parameters in the RUN-Group and the Controls
Speed of running was 2.28 m/s (=40 m/DUR) in the mean in the RUN-group (n = 25) and significantly (p < 0.02) lower than in the controls (2.76 m/s). Time needed to run 40 m (DUR) was significantly longer (p < 0.02), number of steps needed to run 40 m (NST) was significantly higher (p < 0.02), “active” peak amplitudes (PA) of both sides were significantly lower (right leg: p < 0.02; left leg: p < 0.04), variability of time to peak (PTSD) was significantly higher for both legs (right leg: p < 0.01; left leg: p < 0.04) and duration of foot ground contact (DFC) was significantly longer for the right leg (p < 0.05) than in the controls (see Table 3).
Table 3. Comparisons of running data of WD-patients and controls.
| Parameters |
RUN-Group |
Control Subjects |
p Value |
| 45.5 (14.2) |
38.9 (4.9) |
p < 0.02 |
| DFC (in second) |
mean (SD) |
RL: 0.36 (0.12)
LL: 0.35 (0.12) |
RL: 0.31 (0.03)
LL: 0.31 (0.03) |
p < 0.05
p = 0.06; n.s. |
| PA (in N) |
mean (SD) |
RL: 1579 (418)
LL: 1553 (457) |
RL: 1843 (429)
LL: 1785 (399) |
p < 0.02
p < 0.04 |
| PTSD (in ms) |
mean (SD) |
RL: 16.1 (14.2)
LL: 16.8 (19.5) |
RL: 9.2 (2.5)
LL: 9.1 (2.6) |
p < 0.01
p < 0.04 |
mean = mean value; SD = standard deviation; DUR = time in seconds to run 40 m; NST = number of steps to run 40 m; DFC = duration of foot ground contact in seconds; PA = peak amplitude in N; PTSD = variability of time to peak in ms (see Methods); RL = right leg; LL = left leg).
5. Influence of Severity of WD on Running Parameters
After the RUN-group had been split-up according to severity into the MIL-, MOD-, and SEV-subgroup an ANOVA did not reveal any influence of severity of WD on any running parameter.
6. Correlations between Clinical Scores and Running Parameters
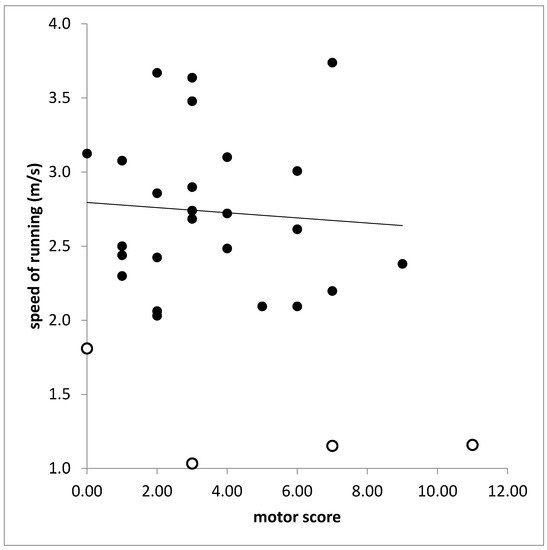
In the RUN-group (n = 25) motor score (MotS) did not correlate with any running parameter. With most of the running parameters also the total score (TSC) did not correlate. This is demonstrated for the correlation between speed of running (SPR) and TSC in Figure 4. The total score (TSC) was significantly correlated only with PTSD on the left side (r = 0.389, p < 0.037). However, when SPR was also calculated for the attempts of running of the NO-RUN-group and SPR was correlated for all patients (n = 30) with TSC a significant correlation was found (r = 0.437; p < 0.026).
Figure 4. Missing correlation between speed of running (ordinate) and total score (TS). Open symbols indicate patients who belonged to the NO-RUN-group.
However, the non-motor score (N-MotS) was significantly correlated with number of steps (NST: r = 0.577, p < 0.001), time needed to run 40 m (DUR: r = 0.643, p < 0.001), running speed (SPR: r = 0.643; p < 0.001), duration of foot contact (DFC: RL: r = 0.569, p < 0.001; LL: r = 0.457; p < 0.013), time to peak of the left leg (PT: RL: r = 0.221, p < 0.186, n.s.; LL: r = 0.407, p < 0.028), and variability of time to peak of both legs (PTSD: RL: r = 0.462, p < 0.012; LL: r = 0.502, p < 0.006).
7. Correlation between Laboratory Findings and Running Parameters
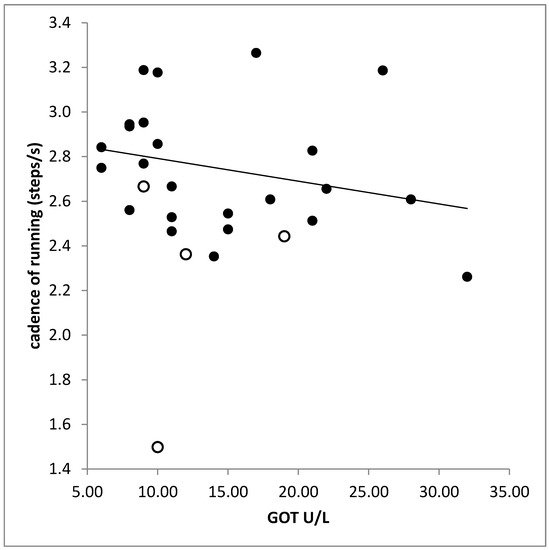
No significant difference was found between the laboratory findings in the RUN-and the NO-RUN-group. There was a significant correlation between liver enzymes (GPT, GOT) and cadence (GPT: r = −0.397, p < 0.033; GOT: r = −0.506, p < 0.005; Figure 5). The higher the serum level of creatinine the higher was the variability of time to peak (PTSD: r = 0.530; p < 0.003; right leg).
Figure 5. Significant negative correlation between cadence (step frequency of running) and the serum level of the liver enzyme GOT. Open symbols indicate patients who belonged to the NO-RUN-group.
8. Conclusions
In contrast to the hypothesis mentioned in the introduction, that involvement of the basal ganglia, the cerebellum and the brainstem nuclei will lead to a frequent impairment of running in WD only 16% of the long-term treated WD-patients were unable to run. This is relevant knowledge for WD-patients and their treating physicians to increase adherence to therapy.
The CDG® system was sensitive enough to demonstrate the negative influence of unspecific non-motor symptoms on running in WD. But no correlation was found between running parameters and the WD-specific motor score. Therefore, running does not seem to be sensitive enough for monitoring WD-therapy.