Customer segmentation analysis is an important way to better understand customers in an era of increasingly fierce competition. Many market segmentation methods classify consumers according to criteria such as socio-economic, demographic, and psychographic factors, but previous studies have shown that these segmentation bases are of limited value in investigating consumer behavior, given that other factors influence customer behavior in service settings, such as customers’ emotions and affect [22]. In this vein, given that emotions differ among different customers, the conceptualization of using emotion as a segmentation variable has received considerable theoretical support; in turn, emotions could be used as the basis for market segmentation [23].
1. Introduction
In recent years, with the improvements in living standards as well as the increase in disposable material wealth, there is an increase in leisure consumption. Furthermore, the increase in work- and life-related stress has led people to take time for leisure activities in order to relieve fatigue and relax. Foot bath spas, including foot baths, tuina, and massage spas, are an excellent way to relax the body and mind, improve sleep quality, and reduce tiredness. Foot bath spas are also a popular spa project among Chinese people, especially those who are under pressure from work and life. As a significant sector of leisure consumption, the spa industry has attracted great attention. Although the spa industry was hit hard during the COVID-19 pandemic, a report by the Global Wellness Institute indicates that the industry is expected to recover fast, with the market hypothesized to grow by 17% annually through 2025
[1]. Faced with such promising growth potential, spa businesses need to seize the opportunity to develop appropriate marketing strategies to promote sustainable development. Kauffmann et al.
[2] indicate that the long-term sustainability of enterprises depends, to a great extent, on their ability to properly meet consumer demands.
Consumer reviews play an invaluable role for businesses in obtaining consumer feedback to facilitate marketing campaigns
[3]. In the past, organizations collected public or customer opinions through surveys, opinion polls, and focus groups
[4]. With the increasing use of social media, a large number of people are willing to share their views and opinions online, which has altered customer relationship management and customer behavior analysis
[5]. The explosive growth of online reviews provides promising alternative data sources to identify customer needs
[6][7][6,7]. Thereby, spa businesses can effectively monitor customers through online reviews. However, analyzing the textual content such as online reviews and microblog posts is challenging because they are written in natural language
[8]. As one of the common data analytic technologies, sentiment analysis is often used to analyze textual data on the Internet. Extracting customer sentiment from online reviews can help businesses obtain customer attitudes and feedback on services or products.
There are numerous previous studies
[9][10][11][12][13][9,10,11,12,13] related to sentiment analysis of online reviews. However, most of these studies divided sentiment into only two or three categories (neutral, negative, or positive), which may not reflect emotional intensity well. Moreover, their research focused on the overall or aspect sentiment of the whole period or all the customers, and did not consider dynamic change in sentiment at different times and in different regions. Furthermore, even for the same product, service, or topic, sentiment tendency and focus may be different at different time points. Some researchers
[3][14][15][3,14,15] have considered the time attribute; for example, Ibrahim and Wang
[16] combined sentiment and time series analyses to identify the critical time points that lead to significant deviations in sentiment trends of five online retailers, so as to provide a deeper understanding of online retail customer behavior. However, few studies consider the effects of special time points, such as festivals and holidays, on customer sentiment and make quantitative analyses. Customers will show different consumption psychology and demand during different leisure holidays. Correctly grasping public festival sentiment is conducive to better cultural development and economic decisions
[17].
From the perspective of foot bath spa businesses, this study proposed a novel general framework is proposed and related sentiment analysis methods to explore leisure consumption sentiment towards different holidays and different cities, in which online review data from the Meituan social media platform are utilized to find swing characteristics of sentiment to support developing a new customer segmentation strategy for customers.
2. High-Frequency Emotion Words
The word cloud visualization is an excellent way to communicate the findings
[18][44]. Hence,
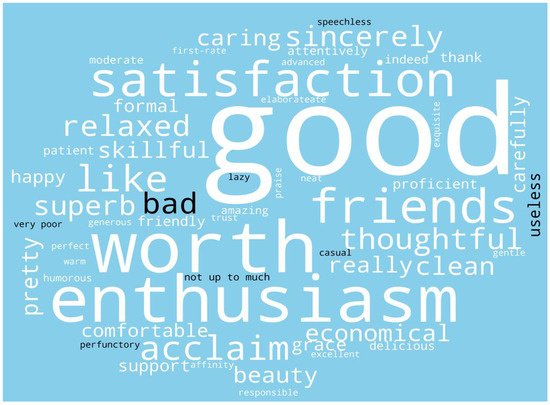
in a this paper, a word cloud was used to roughly reflect the positive and negative tendency of leisure consumption sentiment. The polarity of emotion words is the basis for judging whether an emotion word is positive or negative.“−1” means negative and “+1” means positive.
After word segmentation and emotion words extraction, researchers counted the word frequency of emotion words and then ranked them.
Table 1 shows the examples of negative and positive words in the top 50 emotion words based on word frequency ranking. Due to some words having the same word frequency, their rankings are the same. For instance, “优雅 (grace)” and “支持 (support)” have the same word frequency of 388, so they are both ranked 23rd. Researchers obtained a total of 56 words and then drew the emotion word cloud, as shown in
Figure 1. In the figure, black indicates negative words while white indicates positive words. Most high-frequency words are positive, and the proportion of negative words is relatively small, which means customers in these three cities are generally satisfied with their spa experience during the data collection period, so their sentiment tendencies are overall active. Online ratings are often regarded as proxies of customer satisfaction
[19][20][45,46], so this result is also in line with the average rating score, where the average rating score is above 4.2.
Figure 12. Emotion word cloud.
Table 1. Examples of positive and negative words in the top 50 emotion words.
| |
Polarity |
Examples (Order by Weight) |
Number |
| Negative words |
−1 |
不好 (bad)、不行 (useless)、不怎么样 (not up to much)、随便 (casual)、无语 (speechless)、敷衍 (perfunctory)、稀烂 (very poor)… |
8 |
| Positive words |
+1 |
不错 (good)、值得 (worth)、热情 (enthusiasm)、满意 (satisfaction)、朋友 (friends)、喜欢 (like)、好评 (acclaim) … |
48 |
3. The Variation in Leisure Consumption Sentiment towards Different Holidays and Different Cities
Researchers obtained the daily sentiment scores of each city and constructed three DSTS, pointing to Guangzhou, Shanghai, and Wuhan, respectively. Then, researchers analyzed the time series data through Prophet Model and decomposed the holiday component.
At first, New Year’s Day, Spring Festival, Valentine’s Day, Tomb-Sweeping Day, Christmas Day, and other holidays were chosen for analysis. The time window was set according to the statutory leave of festival or festival time, and the pre-holiday and post-holiday was set to 10 days. After analyzing and filtering, four holidays with significant emotional fluctuation were left: Spring Festival, Dragon Boat Festival, National Day, and Christmas Day.
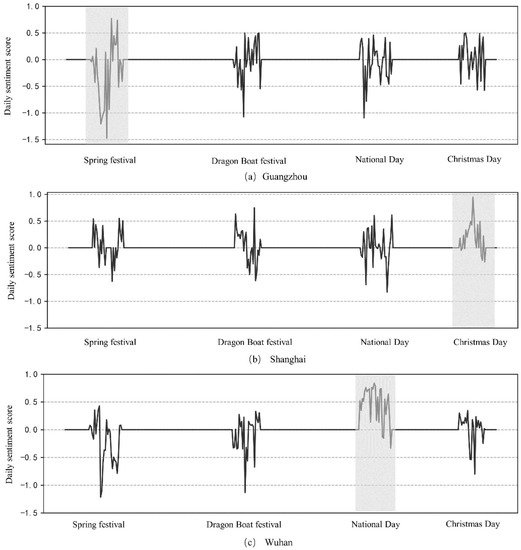
Figure 2a–c show the characteristics of consumption sentiment variations in four festivals in three different cities: The y-axis is the predicted value of daily sentiment score caused by holiday effects, and the x-axis represents the different holidays. The negative daily sentiment score indicates that consumption sentiment is negative; otherwise, it is the opposite. The greater the absolute value of y, the more significant the sentiment holiday effects. For a more intuitive display, gray color blocks were added to holidays with the most apparent sentiment fluctuations. From
Figure 2, it is easily observed different sentiment fluctuations for each holiday and each city.
Figure 2.
The variations in consumption sentiment in different holidays and different cities.
There are many significant characteristics. Firstly, from the perspective of festivals, consumption sentiment shows negative fluctuations during the Spring Festival and Dragon Boat Festival, but the negative fluctuations during the Spring Festival are even greater. This may be related to the lack of massage technicians during the Spring Festival and the lack of attention to festival customs. Consumption sentiment on National Day and Christmas shows positive fluctuations. This may be because the National Day holiday is sufficient, giving spa customers more choices, and as China gradually moves towards internationalization, spa merchants are paying more and more attention to Christmas.
Secondly, from the perspective of cities, consumption sentiment in Guangzhou and Wuhan shows obvious negative fluctuations during the Spring Festival. This may be related to the shortage of employees caused by many migrant workers returning to their hometowns on vacation. In Shanghai, consumption sentiment shows significant positive fluctuations during the Christmas period. As an international metropolis, Shanghai’s spa businesses may pay more attention to Christmas than other cities.
4. Customer Segmentation Based on Consumption Sentiment Tendency Prediction
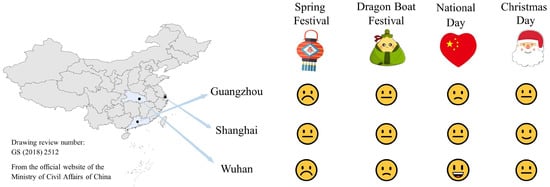
To show the difference more intuitively, based on the above line chart, researchers innovatively adopted emoticon face graphs to show the consumption sentiment tendencies of different holidays and different cities, as shown in
Figure 3.
Figure 3. The emoticon face graph of consumption sentiment tendencies.
The emoticon face is generated and marked according to the predicted effect values of consumption sentiment. Three steps can be conducted: First, compute the mean of the predicted effect values of each holiday in each city; secondly, select the maximum and minimum values of the mean and then divide the interval; and thirdly, match the emoticon face for each interval. The detailed description is shown in
Table 2.
According to the statistical data of the Local Bureau of Statistics, the per capita disposable income of urban residents in Guangzhou
[21][47], Shanghai
[22][48], and Wuhan
[23][49] were CNY 65,052, CNY 76,437, and CNY 51,706, respectively in 2019, which were higher than the national average
[24][50] of CNY 42,359. It means that the residents of these three cities have the financial ability to engage in leisure activities. However, from
Figure 3, researchers can observe that in these three cities, the proportion of non-smiling faces (10/12; 10 and 12 represent the number of non-smiling faces and the total number of emoticons in
Figure 3, respectively) is significantly higher than that of smiling faces (2/12). This shows that the customers are not very satisfied with the spa services they received during the holidays.
The high average rating score and the majority of positive words shown in
Figure 1informed good customer satisfaction. However, comparing the emoticon face graphs of consumption sentiment tendencies in
Figure 3, it is implied that customer satisfaction is varied in different holidays and different cities. The overall customer sentiment obtained by traditional methods cannot effectively obtain the fine-grained differences in customer satisfaction, resulting in insufficient understanding of customers and the market.
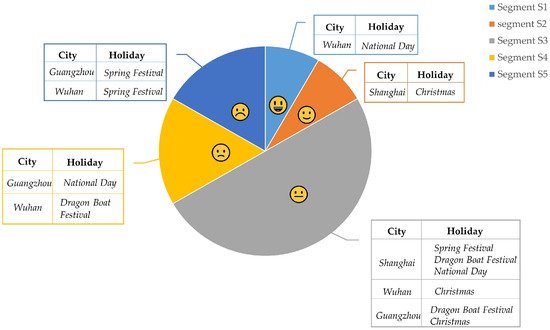
Therefore, it is necessary to segment customers to provide more targeted services. Therefore, researchers proposed the segmentation rules based on the city-holiday emoticon face patterns, where each city-holiday emoticon face represents a customer group with a kind of sentiment tendency shown in
Table 2 during a city’s holiday. As a result, researchers can segment spa customers into five segments according to the city-holiday emoticon face patterns, as shown in
Figure 4. For instance, Segment S1 represents customers whose consumption sentiment shows a highly positive tendency.
Figure 4. Customer segmentation based on city-holiday emoticon face patterns.
From the above results, it can be seen that the novel general framework and related sentiment analysis methods proposed in this paper can effectively understand the fine-grained consumption sentiment, assist in optimizing customer segmentation, and enable leisure service vendors to formulate more precise marketing strategies. For example, for Segment S5, spa merchants in Guangzhou and Wuhan should pay attention to the negative tendency of customer sentiment during the Spring Festival, ensure that there are sufficiently skilled massage technicians on duty, and provide festive services, such as gifting customers with New Year’s Zodiac dolls. For Segment S2, it is suitable for spa merchants in Shanghai to pay attention to the festivals with national attributes while improving the service level during the Christmas period.