Pig manure (PM) is often highly enriched in heavy metals, such as Cu and Zn, due to the wide use of feed additives. To study the potential risks of heavy metal accumulation in the soil and rice grains by the application of PM and other organic manure, a four-year field experiment was conducted in the suburb of Shanghai, southeast China. The contents of Cu, Zn, Pb, and Cd in the soils and rice plants by the treatments of PM and fungal culturing residues (FCR) show a trend of annual increase. Those in the soils and rice by the PM treatment are raised even more significantly. Cu and Zn contents in the soil and rice roots by the PM are significantly higher than those by the non-fertilizer control (CK) during the four years, and Pb and Cd also significantly higher than CK in the latter two years.
1. Introduction
Excessive application of chemical fertilizers often leads to agricultural diffuse pollution, causing the eutrophication of surface water and contamination of groundwater
[1]. In recent decades, the replacement of chemical fertilizers by organic manure has been highly encouraged in China. The number of live pigs attained 680 million in China in 2016
[2]. PM is not only an important source of organic manure but also a link to the circulation of the livestock-soil-plant system
[3]. Long-term application of PM significantly increases the contents of organic matter and nutrients in soils
[4].
To prevent pigs from infecting intestinal pathogen and supplement nutrients, some trace elements such as Cu, Zn, Fe, and Mn are often added into livestock feed
[5], thus causing the enrichment of heavy metals in the PM
[6][7][6,7]. According to the investigations, the rates of livestock manures with Cd and Pb content exceeding the safe limits of organic fertilizers are 12.3% and 2.6%, and those with Cu and Zn exceeding the limits are 53.9% and 45.7%, respectively
[8]. Long-term application of livestock manures hence often leads to the accumulation of heavy metals in agricultural soils
[9][10][9,10]. PM is particularly highly enriched in Cu and Zn
[11][12][13][14][15][16][17][11,12,13,14,15,16,17]. These in the PM released from an intensively raising farm in China attain as high as 1726 mg/kg and 1506 mg/kg, respectively
[18]. The application of PM often causes the contamination of heavy metals and antibiotics in soils
[19][20][19,20].
Rice is the staple food of nearly half of the world’s population
[21]. The rice grain, however, is inclined to accumulate Cd and other toxic metals, even growing on Cd-low soils. Therefore, it never seldom occurs that Cd content in the rice in the market exceeds the safe limit (0.2 mg/kg)
[22][23][22,23]. Whether long-term application of PM influences the contents of Cd and other toxic heavy metals in rice grains should be paid close attention to.
In this study, a field experiment of application of PM and two FCR are carried out in the suburb of Shanghai for four consecutive years from 2017 to 2020. The contents of Cu, Zn, Pb, and Cd in the soils, rice plants, and grains by the different fertilizer treatments are detected to study the effects of the application of PM and FCR on the accumulation of toxic heavy metals in rice grains and to evaluate its potential edible risks.
2. Enhancements of Soil Nutrients by Application of PM and FCR
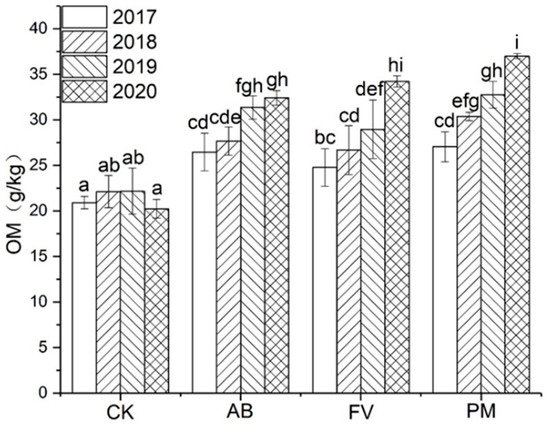
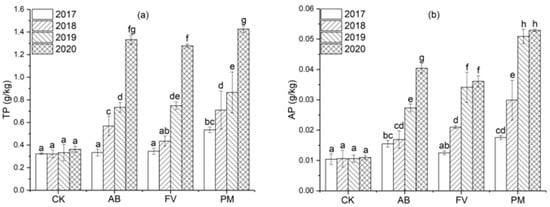
Soil fertility is gradually improved after the application of PM and FCR. The content of OM in the soils of AB, FV and PM increases by 38.0%, 34.2%, and 48.9% on annual average during the four years; TN, 25.1%, 38.4%, and 37.1%; AN, 23.0%, 21.2%, and 33.8%; TP, 121.6%, 109.4%, and 163.9%; AP, 135.0%, 143.2%, and 254.7%; TK, 37.1%, 49.2%, and 62.3%; AK 93.0%, 60.6%, and 93.6%, respectively. During the four experimental years, the content of OM in the soils of PM is significantly higher than that of AB, FV, and CK (
Figure 1). The application of PM and FCR increases the content of soil OM and improves soil quality significantly
[24][25][24,25]. The effects of PM application on the improvement of soil fertility are even more significant
[26]. The excessive application of PM, however, often causes the accumulation of P in soils (
Figure 23) and increases the risk of agricultural diffuse pollution
[27].
Figure 1. Effects of the different fertilizer treatments on the content of OM in the soils. All the data are expressed as means ± SD; n = 3. Different letters on data in the same group indicate a significant difference between them at p < 0.05 level.
Figure 2. (a) Effects of the different fertilizer treatments on the content of TP in the soils; (b) Effects of the different fertilizer treatments on the content of AP in the soils. Data are expressed as means ± SD; n = 3. Different letters on data in the same group indicate a significant difference between them at p < 0.05 level.
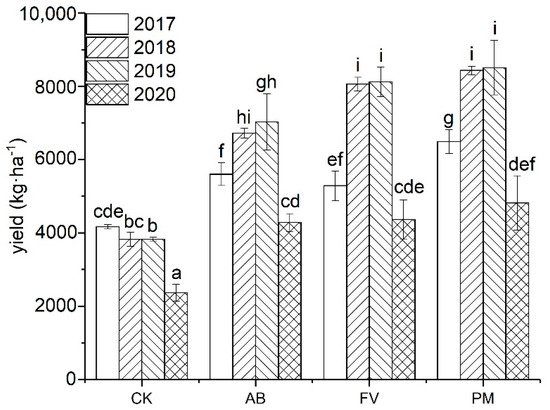
Correlating with the annual enhancement of soil nutrients, the yield of rice grain of AB, FV, and PM increases by 40.0%, 45.1%, and 49.8%, on annual average, respectively. There is a significant positive correlation between the content of OM in the soils and the yield of rice grains (r = 0.886,
n = 12;
p < 0.01), further suggesting that the application of organic manure has contributed to the yield increase. The effects of yield increase by PM are even more significant as PM contains high content of nutrients
[28][29][28,29]. Moreover, higher content of Zn in PM may also contribute to yield increase
[30][31][30,31]. Over the first three years, the grain yield by the AB, FV, and PM continuously increases, and that of PM is significantly higher than of AB and FV, which is consistent with the previous results
[32][33][34][32,33,34]. In the fourth year, the yield of rice grain of the treatments, however, is significantly reduced (
Figure 35), which may be related to the unsuitable climatic conditions and high incidences of rice pests and diseases this year.
Figure 3. Yield of rice grains by the different fertilizer treatments during the four experimental years. Data are expressed as means ± SD; n = 3. Different letters on data in the same group indicate a significant difference between them at p < 0.05 level.
3. Accumulation of Heavy Metals in the Soils Caused by Application of PM and FCR
Feed additives commonly used in pig breeding often contain a certain amount of heavy metals, such as Cu, Zn, Fe, and Mn, which are used to prevent diseases, supplement nutrients and improve the growth of pigs
[35][36][37][35,36,37]. The heavy metals added into feed are finally mostly released with dung
[37][38][37,38]. PM is thus often highly enriched in Cu and Zn
[39][40][39,40] and sometimes even contains toxic metals or metalloids such as Cd and As
[41][42][41,42]. Toxic heavy metals in organic fertilizers that are made from animal manures therefore often exceed the safe limits
[43]. The contents of Cu and Zn in 117 samples of organic fertilizers in northern China are 75.2 mg/kg and 581.9 mg/kg on average, respectively
[44]. Cu content in the PM used in this study is 5.5 and 20.8 times that of FV and AB, and Zn content 4.4 and 16.3 times that of FV and AB, respectively (
Table 1. The contents of Pb and Cd in the PM are also significantly higher than those in the two FCR (
p < 0.05) (
Table 1).
Table 1.
Nutrient and heavy metal content of PM and FCR in field experiments. Data are means ± SD, n
= 3. Different letters indicate significant differences between treatments at p < 0.05 according to the Duncan test.
| Organic Fertilizer |
pH |
OM (%) |
Water Content (%) |
TN (g/kg) |
TP (g/kg) |
TK (g/kg) |
Cu (mg/kg) |
Zn (mg/kg) |
Pb (mg/kg) |
Cd (mg/kg) |
| FV |
5.50 ± 0.11 |
71.75 ± 0.89 |
77.66 ± 0.13 |
20.34 ± 0.26 |
10.20 ± 0.09 |
3.07 ± 0.07 |
8.00 ± 0.81c |
33.46 ± 5.95c |
0.52 ± 0.16 c |
0.15 ± 0.05 c |
| AB |
5.85 ± 0.16 |
36.49 ± 0.63 |
75.63 ± 0.12 |
19.24 ± 0.31 |
4.36 ± 0.05 |
2.65 ± 0.15 |
30.09 ± 0.49b |
123.72 ± 6.52b |
1.71 ± 0.43 b |
0.30 ± 0.05 b |
| PM |
6.99 ± 0.19 |
33.81 ± 0.55 |
12.04 ± 0.15 |
21.05 ± 0.18 |
15.43 ± 0.16 |
3.76 ± 0.21 |
166.76 ± 19.99a |
544.74 ± 75.48a |
3.20 ± 0.14 a |
0.43 ± 0.03 a |
< 0.05 according to the Duncan test.
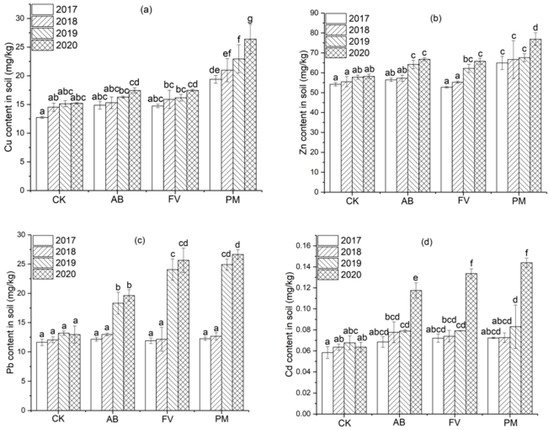
The inputs of heavy metals into the soils through the application of PM and FCR are much higher than the outputs by the uptake of rice plants, resulting in the annual increase in Cu, Zn, Pb, and Cd contents in the soils for the consecutive four years (
Figure 410). The contents of Cu and Zn in the PM soil are significantly higher than CK (
p < 0.05) during the four years, and the contents of Pb and Cd in the PM soil are also significantly higher than CK (
p < 0.05) in the latter two years. The contents of Zn and Pb in the AB and FV soils are significantly higher than CK (
p < 0.05) in the latter two years, and Cd content in the AB and FV soils is also significantly higher than CK (
p < 0.05) on the fourth years, which is, however, still much lower than in the PM soil (
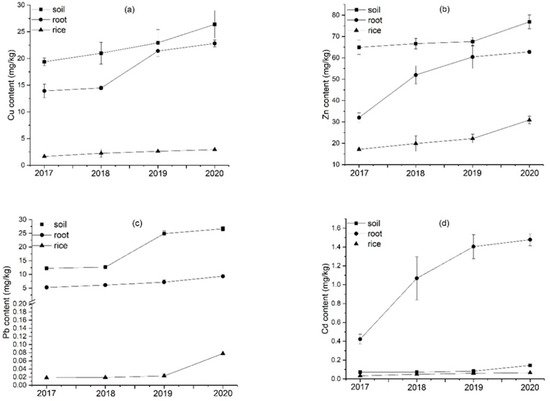
Figure 56). This suggests that the contents of heavy metals in the soils are significantly raised by the application of PM and FCR, and those by the application of PM are more significant. Cu content in the soils of PM annually increases by 8.3%, 9.3%, and 15.0%; Zn content by 2.6%, 1.4%, and 13.7%; Pb content by 3.5%, 96.5%, and 7.0%; Cd content by 0.4%, 14.4%, and 73.3%, respectively.
Figure 410. (a) Annual increasing rates of Cu content in the soils, rice roots, and brown rice by the application of PM during the four experimental years; (b) annual increasing rates of Zn content in the soils, rice roots, and brown rice by the application of PM during the four experimental years; (c) annual increasing rates of Pb content in the soils, rice roots and brown rice by the application of PM during the four experimental years; (d) annual increasing rates of Cd content in the soils, rice roots, and brown rice by the application of PM during the four experimental years. Data are expressed as means ± SD; n = 3.
Figure 5. (a) Cu content in the soils by the different fertilizer treatments during the four experimental years; (b) Zn content in the soils by the different fertilizer treatments during the four experimental years; (c) Pb content in the soils by the different fertilizer treatments during the four experimental years; (d) Cd content in the soils by the different fertilizer treatments during the four experimental years. Data are expressed as means ± SD; n = 3. Different letters on data in the same group indicate a significant difference between them at p < 0.05 level.
Pb and Cd are even more rapidly accumulated in the soils than Cu and Zn. The contents of Pb and Cd in the PM soil in the fourth year are 2.2 and 2.0 times that on the first year, while Cu and Zn in the fourth year are 1.4 and 1.2 times that on the first year (
Figure 410). It may be because both Cu and Zn are nutrient elements and highly taken up by crops, while Cd and Pb are toxic to and less assimilated by crops and thus are mostly adsorbed by soil particles. Cd is easily accumulated in soil by fertilizer application
[45]. Cd in the cultivated layers of soil is significantly raised after the application of PM for 10 years
[42][46][42,46]. The high content of P in PM may also contribute to the accumulation of toxic metals in the soil as the combination of P with Cd and Pb
[47][48][47,48].
The content of OM in the soils is significantly correlated with that of Cu, Zn, Pb, and Cd in the soils (r = 0.856, 0.803, 0.928, 0.973,
n = 12;
p < 0.01), further suggesting that the accumulation of heavy metals in the soils is mainly attributed to the application of organic manure. On the other hand, the high content of OM is beneficial to the accumulation of heavy metals due to the function of chelation
[49][50][51][52][49,50,51,52]. The higher the content of OM in the soil is, the more Cd is accumulated in the soil
[53].
The contents of Cu and Zn in the PM are over the safe limits of organic fertilizers; Pb and C dare below the safe limits (Cu < 100; Zn < 500; Cd < 3; Pb < 100) specified by the China national standards (NY-525-2012)
[54]. The risks of heavy metal accumulation caused by the long-term application of PM and FCR can never be neglected. Long-term application of livestock manure, especially PM, is one of the important reasons for the accumulation of heavy metals in farmland
[10][25][55][56][10,25,55,56]. The application of PM results in the enhancement of Cu, Zn, Pb, and Cd contents in soils
[57][58][59][57,58,59]. In this study, the annual increments of Cu, Zn, Pb, and Cd in the soil are 2.33, 3.97, 4.80, and 0.024 mg/kg on annual average, respectively. According to the rates of increase, the contents of Cu, Zn, Pb, and Cd in the soil will exceed the safe limits (Cu ≤ 100 mg/kg; Zn ≤ 250 mg/kg; Pb ≤ 140 mg/kg; Cd ≤ 0.60 mg/kg) according to the China national standards (GB15618-2018)
[60] after the application of PM for 35, 47, 27, and 22 years.
4. Distribution of Heavy Metals in Rice Plants
Roots are the passageway of heavy metals from the soil into crops. The contents of Cu, Zn, Pb, and Cd in the rice roots are significantly positively correlated with those in the soils in each experimental year (r = 0.723, 0.707, 0.983, 0.944,
n = 12;
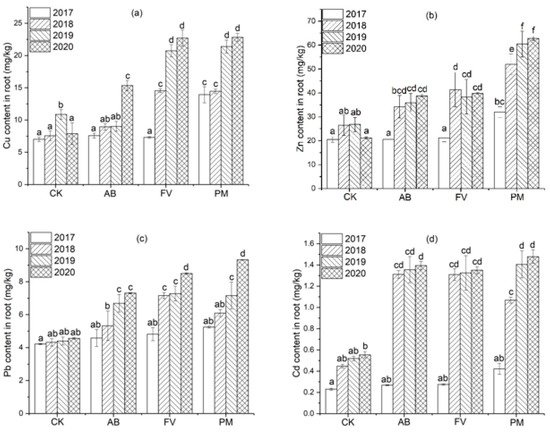
p < 0.05), also suggesting that the enhancement of heavy metals in the rice roots is caused by their accumulation in the soils. The contents of Cu, Zn, Pb, and Cd in the rice roots of the three treatments show an annual cumulative trend (
Figure 69). The contents of Cu and Zn in the rice roots of PM are significantly higher than CK (
p < 0.05) during the four years, the content of Pb in the PM rice roots is significantly higher than CK (
p < 0.05) in the latter two years, and Cd in the PM rice roots is significantly higher than CK (
p < 0.05) in the latter three years. Cu content in the AB rice roots is significantly higher than CK (
p < 0.05) in the fourth year, and that in the FV rice roots is significantly higher than CK (
p < 0.05) in the latter two years. The content of Zn in the rice roots of AB and FV is significantly higher than CK (
p < 0.05) in the latter three years, Pb content in the rice roots of AB and FV is significantly higher than CK (
p < 0.05) in the latter two years, and Cd in the AB and FV roots is also significantly higher than CK (
p < 0.05) in the latter two years (see
Figure 7). The contents of heavy metals in the roots of AB and FV, however, are still much lower than those of PM, also suggesting that the application of PM and FCR have made heavy metals accumulate in the rice roots, and the accumulation by the PM is even more significant. Cu content in the rice roots of PM annually increases by 3.8%, 47.9% and 6.7% from 2018 to 2020; Zn by 62.3%, 16.2%, and 4.0%; Pb by 16.3%, 17.4% and 30.4%; Cd by 153.1%, 31.4% and 5.2%, respectively (
Figure 7). Especially, Cd content in the rice roots of PM on the fourth year attains as high as 1.48 mg/kg, which is 3.5 times that on the first year and also one order magnitude that in the soils. This suggests that Cd can be actively taken up by the rice roots from the soils.
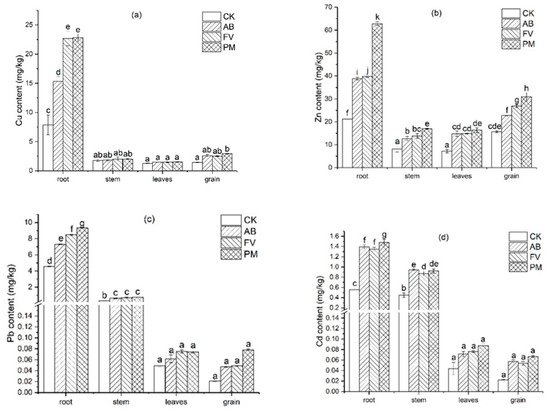
Figure 6. (a) Distribution of Cu content in the rice plants on the fourth experimental year; (b) distribution of Zn content in the rice plants on the fourth experimental year; (c) distribution of Pb content in the rice plants on the fourth experimental year; (d) distribution of Cd content in the rice plants on the fourth experimental year. Data are expressed as means ± SD; n = 3. Different letters on data in the same group indicate a significant difference between them at p < 0.05 level.
Figure 7. (a) Cu content in the rice roots by the different fertilizer treatments during the four experimental years; (b) Zn content in the rice roots by the different fertilizer treatments during the four experimental years; (c) Pb content in the rice roots by the different fertilizer treatments during the four experimental years; (d) Cd content in the rice roots by the different fertilizer treatments during the four experimental years. Data are expressed as means ± SD; n = 3. Different letters on data in the same group indicate a significant difference between them at p < 0.05 level.
Heavy metals taken up by the rice roots are partially translocated to the aerial parts. The contents of Cu, Zn, Pb, and Cd in the aerial parts of the rice plants of PM in the fourth year are 22.0%, 50.5%, 8.9%, and 42.2% of the total, respectively. Both Cu and Zn are essential elements for crops and are inclined to be translocated to the rice shoots, thus showing higher rates in the aerial part. Cd and Pb are not only non-essential but also toxic to crops and thus are mostly trapped in the crop roots.
Cu and Zn contents in the different tissues of rice plants are in the decreasing order of roots > grains > stems > leaves and Pb and Cd in the decreasing order of roots > stems > leaves > grains, which are consistent with many previous studies
[23][61][23,61]. Cu and Zn are mostly accumulated in the roots, reduced in the stems and leaves, and again raised in the rice grains. This indicates that both Cu and Zn, as nutrient elements, can be actively taken up by rice seeds, while Pb and Cd are mainly retained in the rice roots and stems (
Figure 69). Only a small amount of Pb is translocated into rice grains, and a relatively higher amount of Cd is translocated into rice grains (
Figure 69), which coincides with many previous studies
[62][63][62,63]. Cd content in the roots and brown rice of PM on the fourth year attains 1.48 mg/kg and 0.066 mg/kg, and Pb content 9.33 mg/kg and 0.078 mg/kg, respectively. The ratio of Cd content in the roots, stems, leaves, and brown rice is 24:16:2:1, compared with that of Pb being 152: 12: 2: 1. This also suggests that Pb is mostly retained in the roots, and Cd is relatively easily translocated into the rice grain.
5. Risk of Heavy Metal Contamination in Rice Grain Caused by Application of PM and FCR
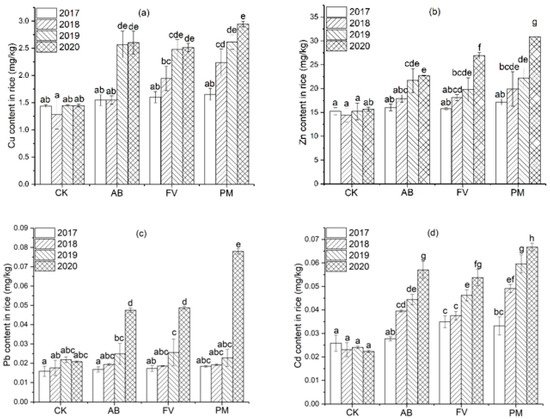
The contents of Cu, Zn, Pb and Cd in the brown rice of the fertilizer treatments in each experimental year are positively correlated with those in the soils (r = 0.836, 0.745, 0.874, 0.949;
n = 12;
p < 0.01) and rice roots (r = 0.843, 0.930, 0.926, 0.968,
n = 12;
p < 0.01). The contents of Cu and Zn in the brown rice of PM, FV, and AB in the latter two years are significantly higher than CK (
p < 0.05) (
Figure 8). Moreover, Cu content in the brown rice of PM, FV, and AB in the latter two years is significantly higher than that in the first two years (
p < 0.05). Pb content in the brown rice of PM, AB, and FV in the fourth year is significantly higher than CK (
p < 0.05), and Cd content in the brown rice of PM and FV in the four years is significantly higher than CK (
p < 0.05). Likewise, the contents of Cu, Zn, Pb, and Cd in the brown rice of AB and FV are much lower than those of PM. Heavy metals in the brown rice of the PM treatment are annually raised more significantly than those of AB and FV (
p < 0.05) (
Figure 8). For example, Cu content in the brown rice of PM attains 2.94 mg/kg in the fourth year, which is 2.0, 1.1, and 1.2 times that of CK, AB, and FV, respectively. This also suggests that the application of PM and FCR has already posed a risk of heavy metal accumulation in brown rice, and the risk caused by the application of PM is much higher.
Figure 8. (a) Cu content in the brown rice by the different fertilizer treatments during the four experimental years; (b) Zn content in the brown rice by the different fertilizer treatments during the four experimental years; (c) Pb content in the brown rice by the different fertilizer treatments during the four experimental years; (d) Cd content in the brown rice by the different fertilizer treatments during the four experimental years. Data are expressed as means ± SD; n = 3. Different letters on data in the same group indicate a significant difference between them at p < 0.05 level.
A root/rice ratio of Cd content in the PM rice plants is 22.1, and that of Pb is 119.7, suggesting that Cd is more easily translocated into the rice grains and Pb is mostly retained in the rice roots, which is consistent with many previous studies
[64][65][66][64,65,66]. It was also reported that 10% of rice samples randomly collected in the market in China exceed the safe limit of Cd content (Cd ≤ 0.2 mg/kg) specified by the China national standards
[67]. Cd accumulation in soil has posed a threat to human health through the food chain
[68][69][68,69].
The contents of heavy metals in the brown rice of the treatments for the consecutive four years are still below the safe limits, specified by the China national standards (GB 2762-2017, NY861-2004)
[70][71][70,71]. Zn in rice grains inhibits the further uptake of Cd by grains to protect itself from toxicity
[72][73][72,73]. The high contents of Cu and Zn in rice grains reduce the mobility of Pb and Cd in rice plants
[74].
However, Cu content in the brown rice of PM increases by 35.5%, 16.7%, and 12.7% annually from 2018 to 2020; Zn increases by 15.7%, 11.5%, and 39.2%; Pb increases by 4.4%, 18.8% and 141.9%; Cd increases by 48.0%, 21.3%, and 12.0%, respectively (
Figure 410). The amount of annual increase in Cu, Zn, Pb, and Cd in the brown rice of PM is 0.43, 4.56, 0.019, and 0.011 mg/kg on average, respectively. If continuously increasing at the rates, the contents of Cu, Zn, Pb, and Cd in the rice grains will exceed the safe limits (NY861-2004, Cu ≤ 10 mg/kg; Zn ≤ 50 mg/kg; Pb ≤ 0.40 mg/kg; Cd ≤ 0.20 mg/kg)
[71] after 20, 8, 21 and 16 years of the application of pig manure, respectively. Long-term application of PM to paddy fields raises the risk of Cd contamination of rice
[75]. The risk of heavy metal accumulation in rice grains by long-term application of PM and FCR, therefore, can never be neglected.
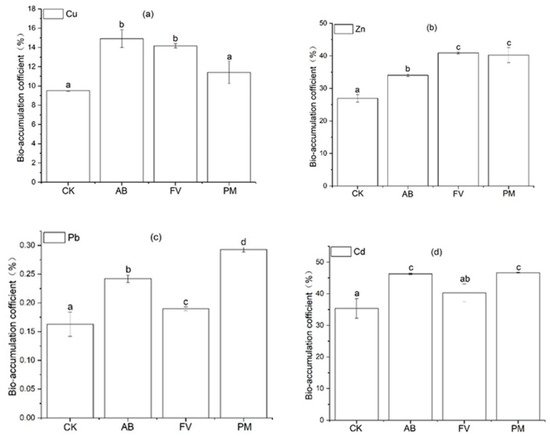
The bioaccumulation coefficients (BAC) in rice, brown rice/soils ratios of heavy metals were calculated. Cd is much mobile in grain plants and can be actively taken up by grain
[76][77][78][76,77,78]. The BAC of Cd in the rice grains is the highest (
Figure 911). Cu and Zn are two essential elements for plants and can also be easily taken up and transferred to rice grain. Thus, the BAC of Cu and Zn in the grains is also high. Pb is mostly retained in the roots, and its BAC is the lowest. The BAC of heavy metals for the AB, FV, and PM treatments are mostly significantly higher than CK (
p < 0.05), suggesting that the applications of PM and FCR increase the risk of heavy metal accumulation in rice grains. Moreover, the BAC of Pb in the PM grains is significantly higher than that in CK, AB, and FV (
p < 0.05), the BAC of Zn in the PM and FV grains significantly higher than that in CK and AB, and the BAC of Cd in the PM and AB grains significantly higher than that in CK and FV (
p < 0.05), further suggesting that the application of PM more easily leads to the accumulation of heavy metals in rice grains.
Figure 911. (a) BAC of Cu in the brown rice of the different treatments; (b) BAC of Zn in the brown rice of the different treatments; (c) BAC of Pb in the brown rice of the different treatments; (d) BAC of Cd in the brown rice of the different treatments. Data are expressed as means ± SD; n = 3. Different letters on data in the same group indicate a significant difference between them at p < 0.05 level.