Land use efficiency is a highly debated issue at an international level as several aspects can contribute to defining the concept of “efficiency”. However, if the term is contextualized in the field of urban development, this is closely linked to the concept of “public value”. The terms “land take” and “public value capture” (or often “land value capture”) as well as their use in different contexts have been discussed by scholars in the scientific literature in recent years. Marquard et al. (2020) argued towards bridging both notions of land consumption and LT. They proposed ways of addressing current ambiguities and suggested prioritizing the term “land take” in the EU context. Thus, the conceptual clarity around land consumption and LT has enhanced and a precondition for solidly informing respective policies and decisions provided. Barbosa et al. (2016) concluded that the implementation of the 2020 land take milestone will foster more efficient use of land and minimize negative impacts on non-artificial land uses. Colsaet et al. (2018) provided a systematic review on drivers of LT and urban land expansion. In this regard, they summarized the causal relationships between land take and different explanatory factors.
Scholars concluded that “the effect of many factors however remains relatively undocumented or controversial in the reviewed literature, including widely used policy instruments”. Hendricks (2020) emphasized “public value capture” as one of the key factors of responsible land management and that smart instruments are needed for a successful implementation. He also characterized PVC as an essential phenomenon to improve the refinancing of public infrastructure and keep the necessary budget for other important duties such as social care.
- land take
- land use efficiency
- Public value capture
- GIS
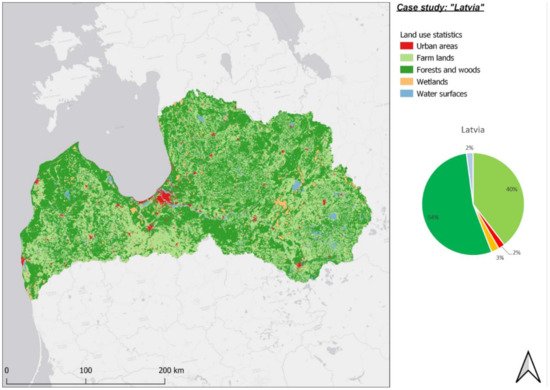
1. Low Level of Land Take: Latvia
2. Average Level of Land Take: Italy
Starting from the end of the Second World War, it is possible to create a parallelism between the main Italian regulatory developments in urban planning and the phenomena that have occurred to understand the rationale that binds these two types of events. This aspect also let to analyze the different types of development that can be found by analyzing the growth of Italian settlements over the last 70 years. It is viable to see that the first generation of regulatory plans that marked the growth of settlements in the second half of the twentieth century were created to try to regulate the expansion of cities, especially industrial ones which, had seen an exponential growth of the resident population and must equip themselves with new residential areas to accommodate the new classes arriving in search of work. To understand the interest of Lombardy as a case study, it is necessary to see it within the Italian context. Official data taken from ISPRA (the Higher Institute for Environmental Protection and Research) shows that in 13 regions, the land consumed exceeds 5%, with the highest percentage values in Lombardy (which, with the latest revisions that exclude certain types of land consumption, stands at 12.05%) [7][25]. Naturally, both the different regional morphology and the historical and peculiar evolution of the territory must be considered in interpreting the relevance of the values found. The comparison between geographical areas confirms the highest values of land consumed for the two Northern areas, which are the only ones above the national percentage. Lombardy also holds the record in absolute terms, with over 288 thousand ha of its territory artificially covered (13.4% of Italian artificial areas is in this region), against the 7000 ha of Valle d’Aosta which is the Italian region with less amount of land consumed [7][25]. As a parameter to compare the development of the different Lombard municipalities, the level of urbanization of the territory was chosen (Figure 5), in other words, for each municipality it was possible to measure the amount of man-made soil in relation to the extent of the municipal area. In detail, three distinct levels of analysis were carried out: the first involves the absolute value of urbanized land, the second relates the land consumed to the extent of the municipality while the third analyzes land consumption by referring to certain historical thresholds.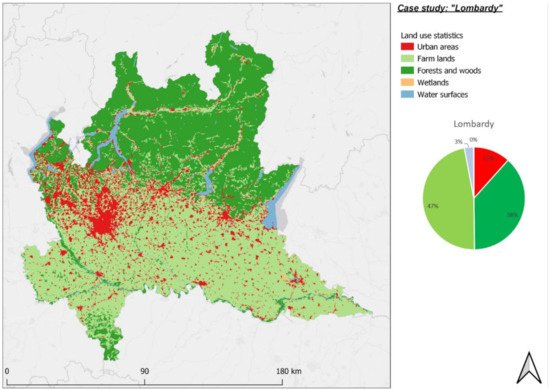
3. High Level of Land Take: The Flanders Region (Belgium)
Since the federalization of Belgium in 1980, the country has been divided into three regions: Flanders, Wallonia, and central Brussels. These three regions have a very different spatial condition; Brussels, as Europe’s capital, has internationalized and is largely urbanized (approx. 1.2 million residents), Flanders also has a high population concentration but little urban concentration, and Wallonia has a low population concentration and most of the Belgian forests. The difference in the artificial surface is remarkably large within the country: whereas the total built-up area in Belgium covers 21%; that of the Flemish region is 33% and still increasing [8][26]. The Flemish and Brussels regions are part of the urban concentration in Western Europe consisting of Greater London, Paris-Ile de France, Lille-Roubaix, the Dutch Randstad, and the German Ruhr. In contrast to these neighboring metropolitan areas and despite a high population density (487 inhabitants per km2, 2020), the building density in Flanders is rather low due to scattered building, ribbon development and urban sprawl. The flat landscape of the Flemish region is highly degraded and fragmented by small developments and urban sprawl, which leads to a lower measurement of LT by the EEA. Identical observations as Decoville and Schneider and Barbarosa have made for Luxembourg and Malta can be made for Flanders; because the CLC maps artificial areas of at least 25 ha, much of the urban sprawl is overlooked and not measured. According to CLC the artificial surface covers 27% of the Flemish territory (370,379 ha). Since 2013, the Flemish government has been monitoring land use and LT every 3 years with more detailed GIS maps [8][26]. The Land Use Map (Landgebruikskaart) is a grid measurement at a resolution of 10 m × 10 m that classifies the land use in 18 categories (agriculture, pasture, forests, and other land-use types). The most recent measurements [8][26] show a LT of 33 % (453,488 ha) or 6% more than measured by CLC (Figure 6). Furthermore, 51% of the territory is occupied by agriculture and pasture and 16% by forest and nature. The share of nature is especially difficult to measure due to high fragmentation and overlap of nature with other land uses.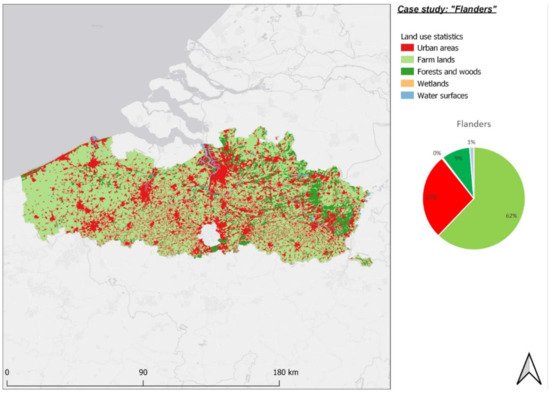
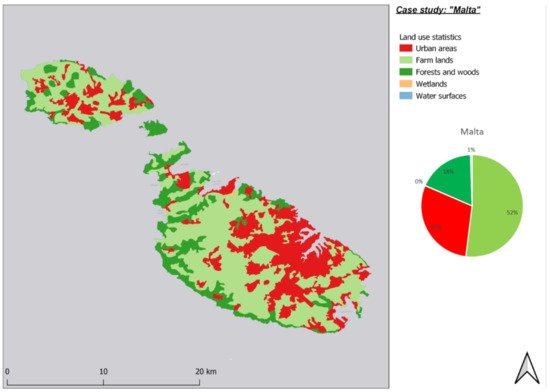
4. High Level of Land Take: Malta
Malta has strong land-use pressures and high land use intensity given its inherently small size, growing population, and very high population density [9][27] At 1595 people per sq.km [3][21]), Malta’s population density is the highest in the EU. Artificial surfaces total 29.9% of the land cover in Malta. Altogether, 51.7% is dedicated to agriculture and farmland, whilst around 16% is composed of natural, wetland and woodland [10][28] (Figure 7).