Your browser does not fully support modern features. Please upgrade for a smoother experience.
Please note this is a comparison between Version 2 by Vivi Li and Version 3 by Vivi Li.
Using drugs to treat COVID-19 symptoms may induce adverse effects and modify patient outcomes. These adverse events may be further aggravated in obese patients, who often present different illnesses such as metabolic-associated fatty liver disease. In Rennes University Hospital, several drug such as hydroxychloroquine (HCQ) have been used in the clinical trial HARMONICOV to treat COVID-19 patients, including obese patients. The aim of this enstrudy is to determine whether HCQ metabolism and hepatotoxicity are worsened in obese patients using an in vivo/in vitro approach.
- molecular networking
- hydroxychloroquine
- drug metabolism
- HepaRG
- COVID-19
- fatty liver
1. Introduction
Coronavirus disease 2019 (COVID-19) outbreak is caused by infection with severe acute respiratory syndrome coronavirus 2 (SARS-CoV-2 virus). Symptoms of COVID-19 include acute respiratory infection (fever, cough, and shortness of breath), which can lead to acute respiratory distress syndrome (ARDS) and requires specific management in the intensive care unit (ICU) [1]. The pathophysiology of SARS-CoV-2 infection is close to SARS-CoV-1 infection, characterized by damage to the airways with aggressive inflammatory responses [2]. Although most patients are asymptomatic, some patients also show signs of hepatotoxicity, including an increase of transaminases (alanine aminotransferase (ALT) and aspartate aminotransferase (AST)) and γ-glutamyltransferase (GGT) [3][4]. Moreover, studies suggest that the presence of the ACE2 receptor on cholangiocytes could label them as potential targets for SARS-CoV-2 infection and induce disturbances in the bile acid metabolism [5]. In addition to liver damage, some articles have also reported an increased incidence of acute kidney injury as a result of COVID-19, which could be due to a systemic inflammatory reaction and also to the direct presence of SARS-CoV-2 in kidney tissue [6]. An increase in mortality has been observed in patients with kidney dysfunction, but the exact cause cannot be clarified [7][8].
The liver and kidney are highly sensitive to hypoxia and, moreover, the significant inflammation linked to the acute respiratory infection could induce a major production of pro-inflammatory cytokines deleterious for their functions (an event also referred to as the “cytokine storm”) [9]. In addition, a higher frequency of hepatic steatosis has been found in COVID-19 positive individuals [10][11], and liver injury and obesity are frequently reported in patients with severe COVID-19 symptoms [12]. These comorbidities are often correlated with metabolic-associated fatty liver disease (MAFLD), and may be expose to impaired drug metabolism and subsequent drug-induced liver injury [13]. Thus, hepatic and renal alterations can be induced by both COVID-19 and drug-induced toxicity. Several treatments are currently being considered to fight SARS-CoV-2. These treatments are known (or suspected) to induce liver damage in some COVID-19 patients [3]. Among these drugs, hydroxychloroquine (HCQ) has been evaluated in the English clinical trial “Recovery” [14] and the French clinical trial “Discovery” [15].
HCQ is a 4-aminoquinoline marketed as Plaquenil®, and is used in the treatment for malaria and rheumatic and inflammatory diseases (rheumatoid arthritis and lupus erythematosus). HCQ has anti-inflammatory and analgesic actions, which may be of benefit during SARS-CoV-2 infection. Interestingly, recent studies hypothesizes that HCQ modifies endosomes pH and inactivates viruses during their infections [16][17]. The cytochromes P450 2D6 and 3A4 (CYP2D6 and CYP3A4) participate in the N-dealkylation of HCQ to the active metabolite, desethylhydroxychloroquine (DHCQ), as well as in the generation of the inactive metabolites, desethylchloroquine (DCQ), and bidesethylchloroquine [18][19]. DHCQ is the main metabolite found in the blood and urine [20][21]. Chloroquine has demonstrated antiviral effects, in particular on the viral replication of several coronaviruses, including SARS-CoV and MERS-CoV [21][22]. HCQ inhibits infection of Vero6 cells by SARS-CoV-2 in vitro with an absence of toxicity up to 100 µM [17]. However, recent studies showed inconsistent results regarding HCQ efficacy to treat COVID-19 [14][23]. In this context, the question of impaired HCQ metabolism and pharmacokinetics under certain pathological conditions arises, and could provide valuable information explaining the differences in efficacy observed in vitro and in patients [24]. Thus, HCQ metabolism studies in COVID-related pathological conditions would be of particular interest.
Recently, molecular networking has emerged as a powerful tool in order to explore metabolism, either in vivo or in vitro. This bioinformatics tool allows for the organization and representation of untargeted tandem mass spectrometry (MS/MS) data in a graphical form [25]. Each detected ion can be linked to other compounds according to their spectral similarities, thus facilitating metabolite identification [26]. Moreover, by providing valuable insights into sample-to-sample comparison, the molecular networking approach offers relevant information concerning metabolic profiles [26][27]. As in vitro cellular models are relevant to study drug metabolism in normal and pathological conditions, molecular networking might be a promising tool to compare the metabolic profiles of COVID-19 treatment between these conditions.
2. Cytotoxicity and Metabolism of Hydroxychloroquine
RPTEC and HepaRG cells were treated for 48 h with HCQ (0.0001 to 10 µM). The highest HCQ concentration tested was two-fold above the maximal EC50 observed during clinical evaluation of the HCQ antiviral activity. The cytotoxicity of HCQ was evaluated with both XTT and NRU assays, and showed no cytotoxic effects on both cell lines (Figure 1A).
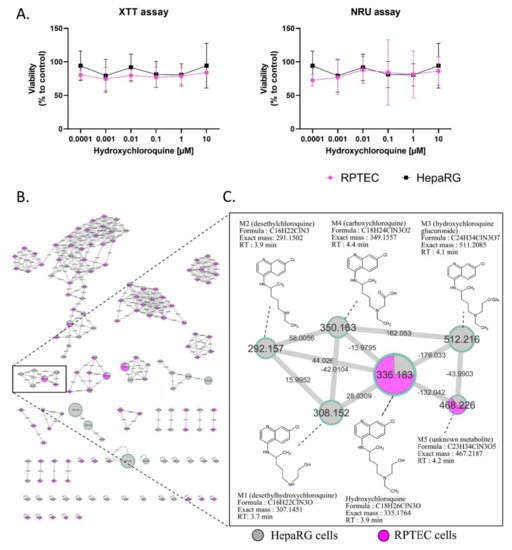
Figure 1. Cytotoxicity and visualization of in vitro HCQ metabolism using molecular networking. Differentiated HepaRG and RPTEC were incubated with HCQ (10 µM) for 48h (at least three experiments in both cell lines). (A) Cytotoxicity was evaluated using XTT and NRU assays. Cell viability was calculated compared to control conditions after 48 h of treatment. (B) The molecular network. Each cell type is depicted in a specific color: HepaRG cells in grey and RPTEC in pink. (C) Details of the specific HCQ-containing cluster. Nodes are labelled with the exact protonated mass (m/z) and the links are labelled with the exact mass shift. Proposed metabolites of HCQ structure are linked to the corresponding nodes.
No changes in RPTEC and HepaRG morphology were noticed in bright field microscopy (data not shown) compared to the control condition. Based on the absence of toxic effects at the highest concentration tested, HCQ metabolite screening was performed with 10 µM HCQ. Culture media analysis using untargeted liquid chromatography high resolution mass spectrometry (LC-HRMS/MS) screening allowed us to generate a multi-matrix molecular network (Figure 1B,C). All MS/MS data acquired during the analysis are displayed, and a specific color was assigned to each cell culture type (HepaRG cells in grey and RPTEC in pink). Nodes were linked together according to their MS/MS spectral similarities (Figure 1B). Multi-matrix molecular network visual analysis found a cluster containing HCQ (m/z 336.183, RT: 3.9 min), linked to five other nodes (M1: m/z 308.152 (RT: 3.7 min), M2: m/z 292.157 (RT: 3.9 min), M3: m/z 512.216 (RT: 4.1 min), M4: m/z 350.163 (RT: 4.4 min), and M5: m/z 468.226 (RT: 4.2 min)) (Figure 1C). Four of these nodes are linked to HCQ, with well-established biotransformation mass shifts of 28.031, 44.0261, 176.033, and 13.9795, corresponding to deethylation, deacetylation + dehydrogenation, glucuronidation, and C terminal oxidation + dehydrogenation, respectively (Supplementary Table S1). The identification step revealed that these compounds could correspond for M1 (m/z 308.152) to DHCQ, for M2 (m/z 512.216) to DCQ, for M3 (m/z 511.208) to glucuronide, and for M4 (m/z 349.155), a new metabolite identify as carboxychloroquine (Figure 1C). Interestingly, these four putative metabolites were only found in theHepaRG cell supernatant. In addition, the M5 (m/z 468.226) node was linked to HCQ with a mass shift of + 132.042, corresponding to the addition of a C5H8O4 group. This compound was found in both RPTEC and HepaRG cells. The LC-HRMS/MS parameters of these different compounds are presented in Supplementary Table S2. Taken together, these results suggest that (i) HCQ is not cytotoxic in non-pathological in vitro renal and liver tissue models, and (ii) that RPTEC is a low metabolizer of HCQ, conversely to differentiated HepaRG cells. As a result, only differentiated HepaRG cells were kept to further explore HCQ metabolism in pathological conditions.
3. In Vivo Metabolism of Hydroxychloroquine
In order to compare our in vitro findings to the in vivo data, we performed a sample-to-sample comparison using molecular networking, including a blood sample of COVID-19 patient treated by HCQ and our culture media of differentiated HepaRG incubated by HCQ (10 µM) for 48 h (Figure 2). The HCQ-containing cluster visual analysis revealed that all putative metabolites (M1 to M5) found in our in vitro experiment were present in the patient’s blood sample, highlighting the relevance of the HepaRG cell model in HCQ metabolism study. Among all of the metabolites, the M5 plasma level was, however, very low in this patient.
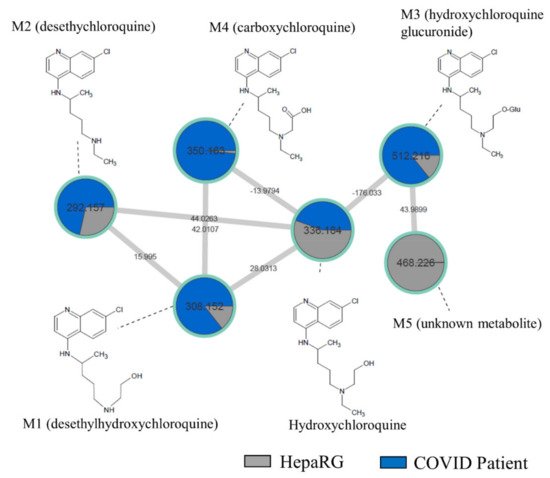
Figure 2. Molecular network comparing metabolites from a non-steatotic COVID-19-positive patient treated with HCQ and “healthy” HepaRG cells. HepaRG cells (grey) were incubated with HCQ (10 µM) for 48 h. The non-steatotic COVID-19-positive patient (dark blue) was treated with HCQ for 4 days at 400 mg/day. Nodes are labelled with the exact protonated mass (m/z) and the links are labelled with the exact mass shift. Proposed metabolites of HCQ structure are linked to the corresponding nodes.
4. Fatty Acid Treatment Induces a Change in HCQ Metabolism and Toxicity
HepaRG cells were treated for 10 days with HCQ (0.001 to 100 µM) with or without a mixture of 150 µM of stearic acid and 150 µM of oleic acids. This fatty acids mixture induced a metabolic associated fatty liver disease syndrome in HepaRG cells, characterized by modulation of major CYP activities and the accumulation of intra cellular triglycerides, as previously described [28][29]. This mixture was chosen in our study to allow for the observation of additional lipid accumulation in the cells. Indeed, although we can increase the initial steatosis by increasing the amount of oleic acid, this makes it difficult to observe additional lipid accumulation (Supplementary Figure S1). By using the cell count to assess cytotoxicity, 100 µM HCQ was found to be cytotoxic in fatty acid-treated HepaRG cells, whereas HCQ was not cytotoxic in the control condition (Figure 3A). We next used Nile red, which is known to stain neutral lipids (triglycerides and cholesterol esters) but not phospholipids at emission/fluorescence wavelengths 531/593 nm [30].
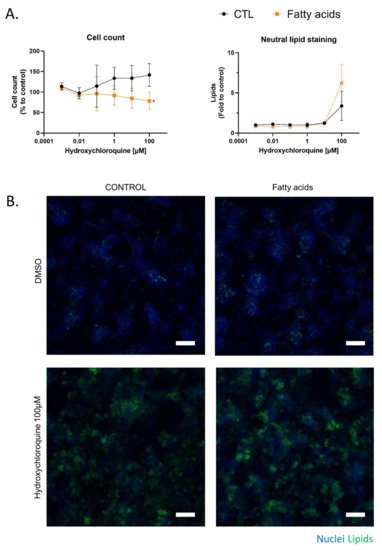
Figure 3. Chronic cytotoxicity of HCQ in HepaRG cells exposed to fatty acids. The effect of HCQ on HepaRG cells under fatty acid overload was evaluated after 10 days of treatment. (A) The number of DAPI-stained nuclei in 10 fields per well were counted and compared with vehicle (DMSO 1.7%, control condition). Lipids stained with neutral red were quantified in the cytoplasm of each counted cell and were compared to the control condition. Data represent the mean ± SD of fold changes obtained in three independent experiments performed in triplicate. T-test * = p < 0.05. (B) Representative images at 10× magnification of HepaRG cells treated 10 days with HCQ and fatty acids. DAPI staining in blue corresponds to the nucleus, and Nile red in green correspond to cellular lipids. White scale bar = 100 µm.
Lipid staining with Nile red revealed that 100 µM HCQ induced steatosis, whereas a greater neutral lipid accumulation was observed when the HepaRG cells were cultured in the presence of fatty acids (Figure 3A). An observation of Nile red labeling in Figure 3 and in Supplementary Figure S2 shows us that the addition of fatty acid on HepaRG cells induces a “basal mild steatosis”, which worsens with the addition of hydroxychloroquine. However, quantitative analyses of Nile red immunofluorescence did not reveal statistical differences. No changes in HepaRG cell morphology were noticed with fluorescence microscopy compared to the control condition (Figure 3B). To investigate whether fatty acid overload can alter metabolism, HCQ was incubated in differentiated HepaRG cells with or without fatty acids during 10 days. Culture media analysis using untargeted LC-HRMS/MS screening allowed us to generate a molecular network where a specific color was assigned to each condition (control in grey and fatty acid treatment in orange; Figure 4A). Using semi-quantitative analysis, we identified the same five metabolites, but found that the fatty acid treatment was able to modify the HCQ metabolism profile, especially for carboxychloroquine (M4), whose level was apparently decreased (Figure 4A). A significantly lower concentration of carboxychloroquine in the condition of fatty acid overload was confirmed using metabolite peak area comparison in three independent experiments performed in triplicate (Figure 4B). Taken together, these results suggest that the HCQ metabolism signature is modified in the condition of fatty acid overload and is associated with cytotoxicity.
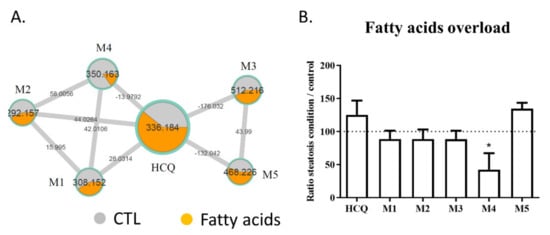
Figure 4. Levels of HCQ and its metabolites detected in the culture medium of HepaRG cells treated or not with fatty acids. The metabolism of HCQ incubated on HepaRG cells without (control condition) or with fatty acids overload was evaluated after 10 days of treatment. (A) Details of the specific hydroxychloroquine-containing cluster. Nodes are labelled with the exact protonated mass (m/z) and the links are labelled with the exact mass shift. (B) Ratio of the peak area of each compound (HCQ, M1 to M5) in the condition of fatty acid treatment to the peak area of each compound in control condition. M1: desethylhydroxychloroquine; M2: desethylchloroquine; M3: hydroxychloroquine glucuronide; M4: carboxychloroquine; M5: Unknown metabolite. The data are quoted as the mean ± SEM from three independent experiments performed in triplicate. Intergroup differences were tested in a two-way ANOVA. * p < 0.05 for fatty acids overload condition compared with the control condition for each compound (arbitrary set to 100%).
5. Comparison of HCQ Metabolization between In Vitro and Patients
Based on our in vitro observations, we investigated whether patients’ characteristics (summarized in Table 1) were associated with changes in the metabolite ratios. Analyses were performed on a cohort of 17 COVID-19 patients treated with HCQ after 4 days post-admission. This cohort included 12 patients with ARDS and 5 patients without ARDS. The biological characteristics of the patients are provided in Table 1.
Table 1. Patients’ characteristics.
| Characteristics | |||||||
|---|---|---|---|---|---|---|---|
| Patients D0/D7 n | 17/17 | ||||||
| Age, median IQR | 57 (54–67) | ||||||
| Male, n (%) | 12 (70) | ||||||
| ICU, Clinical Ward, n | 17/17 | ||||||
| P/F | 0.21 | 0.08 | −0.24 | −0.44 | Length of stay in ICU (days), median IQR | 14 (6.5–21.5) | |
| −0.44 | |||||||
| Cortisol | −0.11 | −0.10 | 0.19 | 0.30 | Length of stay of hospital (days) | 19 (10–23) | |
| −0.01 | |||||||
| PaO2 | −0.25 | −0.15 | 0.57 | 0.38 | 0.90 | Comorbidities | |
| Lactate | 0.50 | 0.14 | 0.02 | 0.28 | 0.51 | BMI (kg/m2), median IQR | 29 (27.0–32.5) |
| Urea | −0.30 | −0.10 | 0.67 | 0.80 | −0.04 | Diabetes, n (%) | |
| Creatinine | 3 (17.6) | ||||||
| −0.21 | −0.06 | 0.69 | 0.95 | 0.07 | Cirrhosis, n (%) | 0 (0) | |
| CRP | −0.27 | −0.34 | Chronic kidney disease, n (%) | 2 (11.8) | |||
| −0.04 | 0.11 | −0.27 | Severity criteria and events occurring during follow up | ||||
| PaO2/FiO2 at D4, median (IQR) | 200 (174–264) | ||||||
| Renal failure, n (%) | 8 (47) | ||||||
| Death, n (%) | 2 (11.8) | ||||||
D: day; IQR: interquartile range; ICU: intensive care unit; BMI: body mass index; PaO2/FiO2: ratio of partial oxygen pressure to inspired oxygen fraction representing an index of severity of hypoxia (the lower the ratio, the more severe the disorder).
Blood samples were obtained at D4 and plasma samples were analyzed using untargeted LC-HRMS/MS followed by molecular network analysis. The relative level of each metabolite was compared to the patient’s biological characteristics using Pearson correlation (Table 2).
Table 2. Pearson correlation coefficients between patients (n = 17) biological characteristics and HCQ metabolites.
| Ratio M1 | Ratio M2 | Ratio M3 | Ratio M4 | Ratio M5 | |
|---|---|---|---|---|---|
| Age | 0.25 | −0.18 | 0.03 | 0.21 | 0.06 |
| BMI | 0.03 | 0.03 | 0.11 | 0.02 | 0.02 |
| Temperature | −0.56 | −0.59 | 0.32 | 0.41 | 0.15 |
| PCT | |||||
| −0.16 | |||||
| −0.24 | |||||
| 0.51 | 0.37 | 0.71 | |||
| Bilirubin | −0.32 | −0.24 | 0.07 | 0.51 | −0.23 |
| AST | 0.01 | 0.50 | 0.03 | −0.10 | −0.13 |
| ALT | 0.11 | 0.61 | 0.06 | −0.16 | −0.04 |
| ALP | −0.10 | 0.36 | 0.22 | 0.05 | −0.07 |
| GGT | −0.22 | 0.18 | 0.19 | −0.16 | −0.12 |
Metabolite ratios were calculated by dividing the peak area of the metabolites (M1 to M5) by the peak area of HCQ for each patient’s plasma, and were correlated to the biological characteristics using Pearson correlation coefficient. Positive and negative correlations are indicated in green and red, respectively. BMI: body mass index; P/F: PaO2/FiO2 ratio of alveolar pressure of oxygen to fraction of inspired air; PaO2: alveolar pressure of oxygen; CRP: C-reactive protein; PCT: procalcitonin; AST: aspartate aminotransferase; ALT: alanine aminotransferase; ALP: alkaline phosphatase; GGT: γ-glutamyltransferase.
Considering the markers of renal function, the urea and creatinine were positively correlated with a higher level of M3 and M4 in patient samples (Pearson correlation coefficient between 0.67 and 0.95), thus suggesting a renal elimination. Positive linear correlations were found between M2 level and both AST and ALT activities (Pearson correlation coefficient of 0.5 and 0.61, respectively). Temperature was negatively correlated with lower levels of M1 and M2 in patient samples (Pearson correlation coefficient between -0.56 and 0.59, respectively). Linear correlations are plotted in Figure 5, which also shows the respective p values. Linear correlations between the M5 level and PaO2 or procalcitonin (PCT), which were possibly biased because of one extreme value of M5 in the patient cohort, are shown in Supplementary Figure S3.
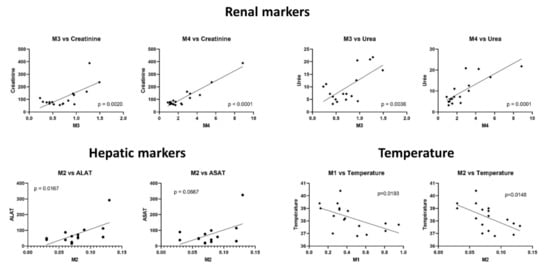
Figure 5. Linear regression between metabolite ratios and biological characteristics. The ratio of the peak area of each compound (HCQ, M1 to M5) in the patient plasma to the peak area of each compound in the control condition is represented as scatter plot. Linear correlation and p-value were calculated using GraphPad Prism.
References
- Patel, S.K.S.; Lee, J.-K.; Kalia, V.C. Deploying Biomolecules as Anti-COVID-19 Agents. Indian J. Microbiol. 2020, 60, 263–268.
- Tay, M.Z.; Poh, C.M.; Rénia, L.; Macary, P.A.; Ng, L.F.P. The trinity of COVID-19: Immunity, inflammation and intervention. Nat. Rev. Immunol. 2020, 20, 363–374.
- Zhang, C.; Shi, L.; Wang, F.-S. Liver injury in COVID-19: Management and challenges. Lancet Gastroenterol. Hepatol. 2020, 5, 428–430.
- Rishi, P.; Thakur, K.; Vij, S.; Rishi, L.; Singh, A.; Kaur, I.P.; Patel, S.K.S.; Lee, J.-K.; Kalia, V.C. Diet, Gut Microbiota and COVID-19. Indian J. Microbiol. 2020, 60, 420–429.
- Chai, X.; Hu, L.; Zhang, Y.; Han, W.; Lu, Z.; Ke, A.; Zhou, J.; Shi, G.; Fang, N.; Fan, J.; et al. Specific ACE2 expression in cholangiocytes may cause liver damage after 2019-nCoV infection. bioRxiv 2020.
- Cheng, Y.; Luo, R.; Wang, K.; Zhang, M.; Wang, Z.; Dong, L.; Li, J.; Yao, Y.; Ge, S.; Xu, G. Kidney Disease Is Associated with In-Hospital Death of Patients with COVID-19. Kidney Int. 2020, 97, 829–838.
- Braun, F.; Lütgehetmann, M.; Pfefferle, S.; Wong, M.N.; Carsten, A.; Lindenmeyer, M.T.; Nörz, D.; Heinrich, F.; Meißner, K.; Wichmann, D.; et al. SARS-CoV-2 renal tropism associates with acute kidney injury. Lancet 2020, 396, 597–598.
- Shao, M.; Li, X.; Liu, F.; Tian, T.; Luo, J.; Yang, Y. Acute kidney injury is associated with severe infection and fatality in patients with COVID-19: A systematic review and meta-analysis of 40 studies and 24,527 patients. Pharmacol. Res. 2020, 161, 105107.
- Coperchini, F.; Chiovato, L.; Croce, L.; Magri, F.; Rotondi, M. The cytokine storm in COVID-19: An overview of the involvement of the chemokine/chemokine-receptor system. Cytokine Growth Factor Rev. 2020, 53, 25–32.
- Ghoneim, S.; Butt, M.U.; Hamid, O.; Shah, A.; Asaad, I. The incidence of COVID-19 in patients with metabolic syndrome and non-alcoholic steatohepatitis: A population-based study. Metab. Open 2020, 8, 100057.
- Medeiros, A.K.; Barbisan, C.C.; Cruz, I.R.; De Araújo, E.M.; Libânio, B.B.; Albuquerque, K.S.; Torres, U.S. Higher frequency of hepatic steatosis at CT among COVID-19-positive patients. Abdom. Radiol. 2020, 45, 2748–2754.
- Xu, L.; Liu, J.; Lu, M.; Yang, D.; Zheng, X. Liver injury during highly pathogenic human coronavirus infections. Liver Int. 2020, 40, 998–1004.
- Ferron, P.-J.; Gicquel, T.; Mégarbane, B.; Clément, B.; Fromenty, B. Treatments in COVID-19 patients with pre-existing metabolic dysfunction-associated fatty liver disease: A potential threat for drug-induced liver injury? Biochimie 2020, 179, 266–274.
- Horby, P.; Mafham, M.; Linsell, L.; Bell, J.L.; Staplin, N.; Emberson, J.R.; Wiselka, M.; Ustianowski, A.; Elmahi, E.; Prudon, B.; et al. Effect of Hydroxychloroquine in Hospitalized Patients with COVID-19: Preliminary results from a multi-centre, randomized, controlled trial. MedRxiv 2020.
- Trial of Treatments for COVID-19 in Hospitalized Adults (DisCoVeRy). Available online: https://clinicaltrials.gov/ct2/show/NCT04315948 (accessed on 26 March 2020).
- Carrière, F.; Longhi, S.; Record, M. The endosomal lipid bis(monoacylglycero) phosphate as a potential key player in the mechanism of action of chloroquine against SARS-CoV-2and other enveloped viruses hijacking the endocytic pathway. Biochimie 2020, 179, 237–246.
- Liu, J.; Cao, R.; Xu, M.; Wang, X.; Zhang, H.; Hu, H.; Li, Y.; Hu, Z.; Zhong, W.; Wang, M. Hydroxychloroquine, a less toxic derivative of chloroquine, is effective in inhibiting SARS-CoV-2 infection in vitro. Cell Discov. 2020, 6, 16.
- Lim, H.-S.; Im, J.-S.; Cho, J.-Y.; Bae, K.-S.; Klein, T.A.; Yeom, J.-S.; Kim, T.-S.; Choi, J.-S.; Jang, I.-J.; Park, J.-W. Pharmacokinetics of Hydroxychloroquine and Its Clinical Implications in Chemoprophylaxis against Malaria Caused by Plasmodium vivax. Antimicrob. Agents Chemother. 2009, 53, 1468–1475.
- White, N.J.; Watson, J.A.; Hoglund, R.M.; Chan, X.H.S.; Cheah, P.Y.; Tarning, J. COVID-19 prevention and treatment: A critical analysis of chloroquine and hydroxychloroquine clinical pharmacology. PLoS Med. 2020, 17, e1003252.
- Chhonker, Y.S.; Sleightholm, R.L.; Li, J.; Oupický, D.; Murry, D.J. Simultaneous quantitation of hydroxychloroquine and its metabolites in mouse blood and tissues using LC–ESI–MS/MS: An application for pharmacokinetic studies. J. Chromatogr. B 2018, 1072, 320–327.
- Collins, K.P.; Jackson, K.M.; Gustafson, D.L. Hydroxychloroquine: A Physiologically-Based Pharmacokinetic Model in the Context of Cancer-Related Autophagy Modulation. J. Pharmacol. Exp. Ther. 2018, 365, 447–459.
- Barnard, D.L.; Day, C.W.; Bailey, K.; Heiner, M.; Montgomery, R.; Lauridsen, L.; Chan, P.K.; Sidwell, R.W. Evaluation of Immunomodulators, Interferons and Known in Vitro SARS-CoV Inhibitors for Inhibition of SARS-CoV Replication in BALB/c Mice. Antivir. Chem. Chemother. 2006, 17, 275–284.
- Lagier, J.-C.; Million, M.; Gautret, P.; Colson, P.; Cortaredona, S.; Giraud-Gatineau, A.; Honoré, S.; Gaubert, J.-Y.; Fournier, P.-E.; Tissot-Dupont, H.; et al. Outcomes of 3,737 COVID-19 patients treated with hydroxychloroquine/azithromycin and other regimens in Marseille, France: A retrospective analysis. Travel Med. Infect. Dis. 2020, 36, 101791.
- Painvin, B.; Guillot, P.; Verdier, M.; Gacouin, A.; Maamar, A. Pharmacocinétique de l’hydroxychloroquine chez les patients COVID-19 en réanimation: Étude de cohorte observationnelle. Méd. Malad. Infect. 2020, 50, S90–S91.
- Wang, M.; Carver, J.J.; Phelan, V.V.; Sanchez, L.M.; Garg, N.; Peng, Y.; Nguyen, D.D.; Watrous, J.; Kapono, C.A.; Luzzatto-Knaan, T.; et al. Sharing and community curation of mass spectrometry data with Global Natural Products Social Molecular Networking. Nat. Biotechnol. 2016, 34, 828–837.
- Allard, S.; Allard, P.; Morel, I.; Gicquel, T. Application of a molecular networking approach for clinical and forensic toxicology exemplified in three cases involving 3-MeO-PCP, doxylamine, and chlormequat. Drug Test. Anal. 2019, 11, 669–677.
- Le Daré, B.; Ferron, P.-J.; Allard, P.-M.; Clément, B.; Morel, I.; Gicquel, T. New insights into quetiapine metabolism using molecular networking. Sci. Rep. 2020, 10, 19921.
- Bucher, S.; Le Guillou, D.; Allard, J.; Pinon, G.; Begriche, K.; Tête, A.; Sergent, O.; Lagadic-Gossmann, D.; Fromenty, B. Possible Involvement of Mitochondrial Dysfunction and Oxidative Stress in a Cellular Model of NAFLD Progression Induced by Benzopyrene/Ethanol CoExposure. Oxidative Med. Cell. Longev. 2018, 2018, 4396403.
- Le Guillou, D.; Bucher, S.; Begriche, K.; Hoët, D.; Lombès, A.; Labbe, G.; Fromenty, B. Drug-Induced Alterations of Mitochondrial DNA Homeostasis in Steatotic and Nonsteatotic HepaRG Cells. J. Pharmacol. Exp. Ther. 2018, 365, 711–726.
- Teo, W.; Caprariello, A.V.; Morgan, M.L.; Luchicchi, A.; Schenk, G.J.; Joseph, J.T.; Geurts, J.J.G.; Stys, P.K. Nile Red fluorescence spectroscopy reports early physicochemical changes in myelin with high sensitivity. Proc. Natl. Acad. Sci. USA 2021, 118, e2016897118.
More