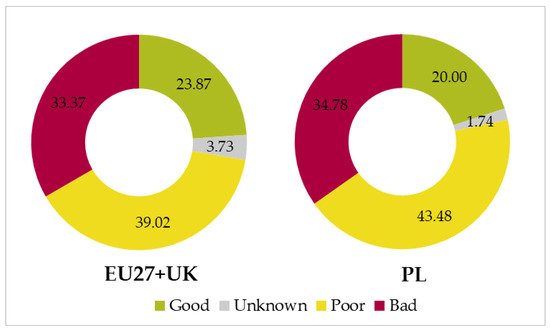
Land-Use Cover Changes (LUCCs) are one of the main problems for the preservation of landscapes and natural biodiversity. Protected Areas (PAs) do not escape this threat. Poland is among the European leaders in terms of the variety of landscapes and the share of an area designated as a protected area. However, as many as 78% of the habitats have poor or bad conservation status based on EEA reports. The changes in PAs were usually smaller than in the surrounding buffer zones, which may indicate their effectiveness. The scale of land-cover flows (LCFs) changed within particular forms of protected areas, though afforestation and deforestation predominating in all area types. National reserves and parks were the most stable in terms of land cover structures. However, human settlements increased around the protected areas, potentially increasing threats to their ecological integrity.
- landscape change
- protected area
- urban pressure
- deforestation
- land use
- CORINE land cover
- Poland
1. Introduction
[21][22][23][24][25][26][27][28][29][30][31][32][33][15][1834][1935][2036][2137][2238]
1. Introduction
| Region | Total Protected Areas | With Management Effectiveness Evaluations | Number of Countries | Terrestrial Protected Area Coverage % | Marine Protected Area Coverage % |
|---|---|---|---|---|---|
| Asia & Pacific | 34,710 | 2821 | 56 | 15.37 | 18.56 |
| Africa | 8559 | 1000 | 58 | 14.11 | 12.35 |
| Europe | 158,452 | 15,719 | 62 | 13.14 | 8.44 |
| Latin America&Caribbean | 9971 | 1282 | 52 | 24.21 | 23.04 |
| Polar | 35 | 3 | 5 | ||
2.2. Landscape Changes
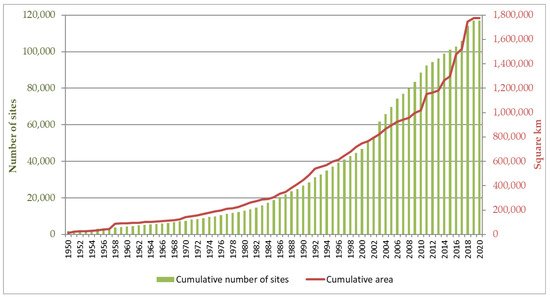
In the analyzed period of 2000–2018, the share of nature conservation areas in the territory of Poland increased from 38% to almost 44%, mainly due to the implementation of a new form of nature protection (European Ecological Network Natura 2000 sites) and the establishment of a new national park in 2001 (Ujscie Warty).
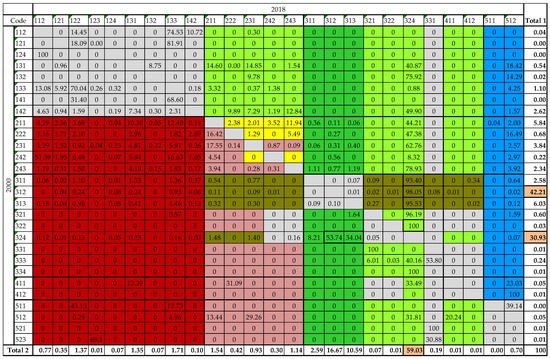
The land cover structure on PAs underwent slight changes. Out of 44 land cover classes identified at level 3 CLC, 32 classes were identified in Poland, including 28 different classes of land cover forms in protected areas. They are dominated by forests (classes 312 and 313) and arable land (class 211), together covering about 92% of the PAs area in 2000. The matrix of transformations between land cover classes in PAs is presented in
2. Landscape Changes
In the analyzed period of 2000–2018, the share of nature conservation areas in the territory of Poland increased from 38% to almost 44%, mainly due to the implementation of a new form of nature protection (European Ecological Network Natura 2000 sites) and the establishment of a new national park in 2001 (Ujscie Warty).
The land cover structure on PAs underwent slight changes. Out of 44 land cover classes identified at level 3 CLC, 32 classes were identified in Poland, including 28 different classes of land cover forms in protected areas. They are dominated by forests (classes 312 and 313) and arable land (class 211), together covering about 92% of the PAs area in 2000 (Table S1 in Supplementary Materials). The matrix of transformations between land cover classes in PAs is presented in Figure 4. From 2000 to 2018, the most frequently transformed CLC class was 312 (coniferous forest). It was transformed into class 324 (transitional woodland shrubs). Slightly less intense but also quite frequent were transformations in the opposite direction—from class 324 to classes 312 and 313 (mixed forest). However, the area covered by such flows was almost 35% smaller than that of flows 312–324. Even so, the total forest area increased by 2.43% between 2000 and 2018 (7. From 2000 to 2018, the most frequently transformed CLC class was 312 (coniferous forest). It was transformed into class 324 (transitional woodland shrubs). Slightly less intense but also quite frequent were transformations in the opposite direction—from class 324 to classes 312 and 313 (mixed forest). However, the area covered by such flows was almost 35% smaller than that of flows 312–324. Even so, the total forest area increased by 2.43% between 2000 and 2018 (Table 3). Besides artificial surfaces (group 1 in level 1 CLC), water bodies (group 5) were the most stable over time. Small changes were also observed in classes 411 (inland marshes) and 412 (peatbogs). They constituted, respectively, 0.05% and 0.01% of all transformations and covered 0.1% of the areas in class 411 and 0.3% of areas classified as 412. As for the transformations towards anthropogenic areas (classes 1xx), they mainly concerned agricultural land, in particular classes 211 (non-irrigated arable land) and 242 (complex cultivation patterns). The area of urbanized areas increased by as much as 85% and agricultural land decreased by 16%, including the reduction of the area of meadows, pastures, and mixed crops by almost 10% (4). Besides artificial surfaces (group 1 in level 1 CLC), water bodies (group 5) were the most stable over time. Small changes were also observed in classes 411 (inland marshes) and 412 (peatbogs). They constituted, respectively, 0.05% and 0.01% of all transformations and covered 0.1% of the areas in class 411 and 0.3% of areas classified as 412. As for the transformations towards anthropogenic areas (classes 1xx), they mainly concerned agricultural land, in particular classes 211 (non-irrigated arable land) and 242 (complex cultivation patterns). The area of urbanized areas increased by as much as 85% and agricultural land decreased by 16%, including the reduction of the area of meadows, pastures, and mixed crops by almost 10% (Table 3).
4).
| Land Cover Type | |||||||||||||||||||
|---|---|---|---|---|---|---|---|---|---|---|---|---|---|---|---|---|---|---|---|
| Land Cover Type | CA [ha] (%) | PLAND [%] | AREA_MN [ha] | TE [m] | |||||||||||||||
| TCA [ha] | CPLAND [%] | CORE_MN [ha] | NP | SPLIT | LSI | PAs | PABs | PAs | PABs | PAs | PABs | PAs | PABs | ||||||
| PAs | PABs | PAs | PABs | PAs | PABs | PAs | PABs | PAs | PABs | PAs | PABs | ||||||||
| Urban areas | +188,517 (85.3) | ||||||||||||||||||
| Urban areas | +53,952 | +158,290 (49.0) | 1.41 | 2.98 | 2.3 | −4.83 | +20,840,050 | 17,308,300 | |||||||||||
| +99,985 | 0.4 | 1.88 | 0.35 | −4.15 | 6 078 | 4 252 | −2,786,047 | −100,039 | 54.23 | 38.73 | Urban greenery | +8020 (61.5) | +4804 (25.5) | 0.06 | |||||
| Urban greenery | 0.09 | +3431 | +2846 | 0.03 | 0.050.54 | −1.62 | +691,700 | +607,600 | |||||||||||
| 0.17 | −1.35 | 271 | 250 | −29,208,137 | −1,661,509 | 7.68 | 5.96 | Arable land | −244,672 (−6.5) | −132,426 (−5.1) | −1.83 | −2.93 | 0.99 | −2.63 | |||||
| Arable land | −157,168 | −110,277 | −1.18 | −12,651,400 | −2.43 | 0.68 | −2.29 | −2 365−6,680,300 | |||||||||||
| −644 | 2212 | 2403 | −10.45 | −4.63 | Pastures | 1 | −250,453 (−9.5) | −127,760 (−13.9) | |||||||||||
| Pastures | 1 | −148,921 | −83,988−1.87 | −2.58 | −4.14 | −1.11 | −1.7−2.01 | −14,049,450 | −13,180,100 | ||||||||||
| −2.77 | −1.32 | −1 428 | −2 306 | 10,274 | 43,977 | 41.28 | 44.78 | ||||||||||||
| North America | 45,272 | 117 | 3 | 11.85 | 16.51 | ||||||||||||||
| West Asia | 378 | 65 | 12 | 3.82 | 1.11 | ||||||||||||||
2. Landscape Changes in Protected Areas in Poland
2.1. Area
2. Landscape Changes in Protected Areas in Poland
2.1. Area
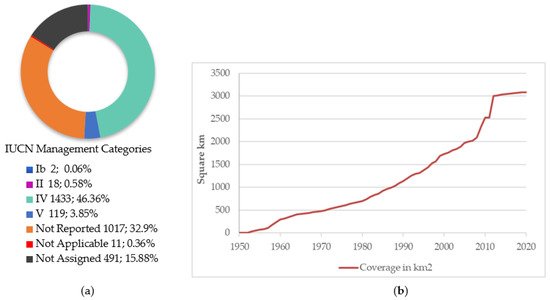
According to the Nature Conservation Act, there are 10 forms of nature conservation in Poland (Table 2): 8 forms of surface protection and 2 forms of individual protection (objects or species) [31]. The Polish definitions of these areas do not always coincide with International Union for Conservation of Nature (IUCN) categories of protected areas (Figure 3). For example, according to the criteria used by the IUCN, none of the 1499 Polish nature reserves has been classified as a Strict Nature Reserve (category I), and only 1 is classified as Ib (Wilderness area). The remaining majority was classified into the “Not Reported” group. Furthermore, only 16 of 23 Polish national parks have the status of an “international” national park (category II), while the rest are classified as category V, a protected landscape area, or not reported [23].
| No. | Nature Conservation Form | Number of Sites | Area [Thousand Hectares] * | ||
|---|---|---|---|---|---|
| 2000 | 2020 | 2000 | 2020 | ||
| 1. |
| Nature reserves |
| 1307 |
| 1499 |
| 148.7 |
| 169.6 |
| 2. | National parks | 22 | 23 | 306.5 | 315.1 | ||||||||||
| 3. | Landscape parks | 120 | 124 | 2446.9 | 2531.8 | ||||||||||
| 4. | Natura 2000 areas | x | 145 (SPAs) 849 (SACs) |
x | 4911.4 (SPAs) 3491.3 (SACs) |
||||||||||
| 5. | Protected landscape areas | 407 | 407 | 7137.7 | 6925.6 | ||||||||||
| Forests | +145,255 (2.4) | +83,128 (7.0) | 1.09 | 1.41 | −1.4 | 1.04 | +6,282,250 | +5,323,100 | |||||||
| −12.93 | −17.89 | ||||||||||||||
| Forests | +87,605 | +64,426 | 0.66 | 1.09 | 6. | Landscape-nature complexes | 170 | 263 | 78.1 | 118.8 | |||||
| −2.77 | 0.81 | 450 | 1 312 | 21 | −3085 | 5.54 | 5.54 | Shrubs and scrub | +143,136 (66.1) | +50,960 (97.2) | 1.07 | 0.97 | −8.4 | −0.71 | |
| Shrubs and scrub | +12,803,300 | +58,284 | +33,493 | 0.44 | 0.63 | +5,295,800 | |||||||||
| −7.62 | −0.71 | 2 650 | 1 858 | 203,713 | −2,027,190 | 36.72 | 24.97 | 7. | Ecological areas | 6113 | 7654 | 44.9 | 55.4 | ||
| Open spaces | −2529 (−18.4) | −895 (−22.2) | −0.02 | −0.02 | 20.39 | ||||||||||
| Open spaces | −1000 | −537 | −0.79 | −228,700 | −126,700 | ||||||||||
| −0.01 | −0.01 | 12.41 | −0.45 | −54 | −68 | 2,151,017 | −7,603,132 | −3.13 | −2.59 | 8. | Documentation sites | 103 | 178 | 1.0 | 1.0 |
| Wetland | +2680 (2.8) | −386 (−6.2) | 0.02 | −0.01 | −7.13 | −2.73 | +372,400 | −22,800 | 9. | ||||||
| Water | +10,047 (2.2) | +5872 (7.3) | 0.08 | 0.1 | 2.82 | 1.9 | +529,750 | +357,400 |
| Wetland | |||||||||||||||||
| 180 | |||||||||||||||||
| −274 | |||||||||||||||||
| 0 | −0.01 | −6.15 | −1.77 | 67 | 56 | −24,042 | 2,601,001 | 2.21 | 0.04 | ||||||||
| Monuments of nature | 33 094 | 34 890 | x | ||||||||||||||
| Water | x | ||||||||||||||||
| +4919 | +4557 | 0.04 | 0.08 | 1.41 | 1.47 | −7 | 36 | 486 | −808 | 1.03 | 1.27 | 10. | Plants, animals, and fungi species protection | 715 plants species 322 fungi species 801 animals species |
x | x | |
References
- Watson, J.E.M.; Dudley, N.; Segan, D.B.; Hockings, M. The performance and potential of protected areas. Nature 2014, 515, 67–73. James Watson; Nigel Dudley; Daniel B. Segan; Marc Hockings; The performance and potential of protected areas. Nature 2014, 515, 67-73, 10.1038/nature13947.
- Loomis, J.; Echohawk, J. Using GIS to identify under-represented ecosystems in the National Wilderness Preservation System in the USA. Environ. Conserv. 1999, 26, 53–58. Robert Costanza; Ralph D'Arge; Rudolf De Groot; Stephen Farber; Monica Grasso; Bruce Hannon; Karin Limburg; Shahid Naeem; Robert V. O'Neill; José María Paruelo; et al.Robert G. RaskinPaul SuttonMarjan Van Den Belt The value of the world's ecosystem services and natural capital. Nature 1997, 387, 253-260, 10.1038/387253a0.
- DeFries, R.; Hansen, A.; Turner, B.L.; Reid, R.; Liu, J. Land use change around protected areas: Management to balance human needs and ecological function. Ecol. Appl. 2007, 17, 1031–1038. Claudia L. Gray; Samantha L. L. Hill; Tim Newbold; Lawrence N. Hudson; Luca Borger; Sara Contu; Andrew Hoskins; Andrew J. Hoskins Simon Ferrier; Samantha L. L. Hill Lawrence N. Hudson Sara Contu Andy Purvis; Jorn Scharlemann; et al. Local biodiversity is higher inside than outside terrestrial protected areas worldwide. Nature Communications 2016, 7, 12306, 10.1038/ncomms12306.
- Costanza, R.; d’Arge, R.; De Groot, R.; Farber, S.; Grasso, M.; Hannon, B.; Van Den Belt, M.; Paruelo, J.; Raskin, R.G.; Sutton, P.; et al. The value of the world’s ecosystem services and natural capital. Nature 1997, 387, 253–260. Sue Stolton; Nigel Dudley; Alexander Belokurov; Marine Deguignet; Neil D. Burgess; Marc Hockings; Fiona Leverington; Kathy MacKinnon; Llewellyn Young; Lessons learned from 18 years of implementing the Management Effectiveness Tracking Tool (METT): A perspective from the METT developers and implementers. PARKS 2019, 25, 79-92, 10.2305/iucn.ch.2019.parks-25-2ss.en.
- Gray, C.L.; Hill, S.L.L.; Newbold, T.; Hudson, L.N.; Börger, L.; Contu, S.; Hoskins, A.J.; Ferrier, S.; Purvis, A.; Scharlemann, J.P.W. Local biodiversity is higher inside than outside terrestrial protected areas worldwide. Nat. Commun. 2016, 7, 12306. Güven Eken; Leon Bennun; Thomas Brooks; W R T Darwall; Lincoln D. C. Fishpool; Matt Foster; David Knox; Penny Langhammer; Paul Matiku; Elizabeth Radford; et al.Paul SalamanWes SechrestMichael L. SmithSacha SpectorAndrew Tordoff Key Biodiversity Areas as Site Conservation Targets. BioScience 2004, 54, 1110-1118, 10.1641/0006-3568(2004)054[1110:kbaasc]2.0.co;2.
- Stolton, S.; Dudley, N.; Belokurov, A.; Deguignet, M.; Burgess, N.D.; Hockings, M.; Leverington, F.; MacKinnon, K.; Young, L. Lessons learned from 18 years of implementing the management effectiveness tracking tool (Mett): A perspective from the mett developers and implementers. Parks 2019, 25, 79–92. Andrew J. Hansen; Ruth DeFries; Land use change around nature reserves: implications for sustaining biodiversity.. Ecological Applications 2007, 17, 972-973, 10.1890/05-1112.
- Eken, G.; Bennun, L.; Brooks, T.; Darwall, W.R.T.; Fishpool, L.D.C.; Foster, M.; Knox, D.; Langhammer, P.; Matiku, P.; Radford, E.; et al. Key Biodiversity Areas as Site Conservation Targets. BioScience 2004, 54, 1110–1118. Soizic Le Saout; Michael Hoffmann; Yichuan Shi; Adrian Hughes; Cyril Bernard; Thomas M. Brooks; Bastian Bertzky; Stuart H. M. Butchart; Simon N. Stuart; Tim Badman; et al.Ana S. L. Rodrigues Protected Areas and Effective Biodiversity Conservation. Science 2013, 342, 803-805, 10.1126/science.1239268.
- Hansen, A.J.; DeFries, R. Land Use Change around Nature Reserves: Implications for Sustaining Biodiversity. Ecol. Appl. 2007, 17, 972–973. Megan D. Barnes; Ian D. Craigie; Luke B. Harrison; Jonas Geldmann; Ben Collen; Sarah Whitmee; Andrew Balmford; Neil D. Burgess; Thomas Brooks; Marc Hockings; et al.Stephen Woodley Wildlife population trends in protected areas predicted by national socio-economic metrics and body size. Nature Communications 2016, 7, 12747, 10.1038/ncomms12747.
- Le Saout, S.; Hoffmann, M.; Shi, Y.; Hughes, A.; Bernard, C.; Brooks, T.M.; Bertzky, B.; Butchart, S.H.M.; Stuart, S.N.; Badman, T.; et al. Protected Areas and Effective Biodiversity Conservation. Science 2013, 342, 803–805. Jonas Geldmann; Lauren Coad; Megan D. Barnes; Ian D. Craigie; Stephen Woodley; Andrew Balmford; Thomas M. Brooks; Marc Hockings; Kathryn Knights; Michael B. Mascia; et al.Louise McRaeNeil D. Burgess A global analysis of management capacity and ecological outcomes in terrestrial protected areas. Conservation Letters 2018, 11, e12434, 10.1111/conl.12434.
- Barnes, M.D.; Craigie, I.D.; Harrison, L.B.; Geldmann, J.; Collen, B.; Whitmee, S.; Balmford, A.; Burgess, N.D.; Brooks, T.; Hockings, M.; et al. Wildlife population trends in protected areas predicted by national socio-economic metrics and body size. Nat. Commun. 2016, 7, 12747. Stephen G. Kearney; Vanessa M. Adams; Richard A. Fuller; Hugh P. Possingham; James E. M. Watson; Estimating the benefit of well-managed protected areas for threatened species conservation. Oryx 2020, 54, 276-284, 10.1017/s0030605317001739.
- Geldmann, J.; Coad, L.; Barnes, M.D.; Craigie, I.D.; Woodley, S.; Balmford, A.; Burgess, N.D.; Knights, K.; Masica, M.; McRae, L.; et al. A global analysis of management capacity and ecological outcomes in terrestrial protected areas. Conserv. Lett. 2018, 11, e12434. Fernanda Figueroa; Víctor Sánchez-Cordero; Effectiveness of natural protected areas to prevent land use and land cover change in Mexico. Biodiversity and Conservation 2008, 17, 3223-3240, 10.1007/s10531-008-9423-3.
- Kearney, S.; Adams, V.; Fuller, R.; Possingham, H.; Watson, J. Estimating the benefit of well-managed protected areas for threatened species conservation. Oryx 2020, 54, 276–284. Natalie E. Clark; Elizabeth H. Boakes; Philip J. K. McGowan; Georgina M. Mace; Richard A. Fuller; Protected Areas in South Asia Have Not Prevented Habitat Loss: A Study Using Historical Models of Land-Use Change. PLOS ONE 2013, 8, e65298, 10.1371/journal.pone.0065298.
- Craigie, I.D.; Baillie, J.E.M.; Balmford, A.; Carbone, C.; Collen, B.; Green, R.E.; Hutton, J.M. Large mammal population declines in Africa’s protected areas. Biol. Conserv. 2010, 143, 2221–2228. Dawson Reisig; Katrina Mullan; Andrew Hansen; Scott Powell; David Theobald; Rachel Ulrich; Natural amenities and low-density residential development: Magnitude and spatial scale of influences. Land Use Policy 2021, 102, 105285, 10.1016/j.landusepol.2021.105285.
- Figueroa, F.; Sánchez-Cordero, V. Effectiveness of natural protected areas to prevent land use and land cover change in Mexico. Biodivers. Conserv. 2008, 17, 3223. Zydron, Adan; Antkowiak, Magdalena.; Lisiak, Marta; Szczepański, Piotr; The analysis of urban pressure on protected areas on the example 819 of Puszczykowo commune. Studia i Prace WNEIZ US 2016, 46, 1.
- Liu, J.; Linderman, M.; Ouyang, Z.; An, L.; Yang, J.; Zhang, H. Ecological Degradation in Protected Areas: The Case of Wolong Nature Reserve for Giant Pandas. Science 2011, 292, 5514. Karen M. Bailey; Robert McCleery; Michael W. Binford; Christa Zweig; Land-cover change within and around protected areas in a biodiversity hotspot. Journal of Land Use Science 2015, 11, 154-176, 10.1080/1747423x.2015.1086905.
- Clark, N.E.; Boakes, E.H.; McGowan, P.J.K.; Mace, G.M.; Fuller, R.A. Protected Areas in South Asia Have Not Prevented Habitat Loss: A Study Using Historical Models of Land-Use Change. PLoS ONE 2013, 8, e65298. Arjun Adhikari; Andrew J. Hansen; Land use change and habitat fragmentation of wildland ecosystems of the North Central United States. Landscape and Urban Planning 2018, 177, 196-216, 10.1016/j.landurbplan.2018.04.014.
- Reisig, D.; Mullan, K.; Hansen, A.; Powell, S.; Theobald, D.; Ulrich, R. Natural amenities and low-density residential development: Magnitude and spatial scale of influences. Land Use Policy 2021, 102, 105285. Niels Hellwig; Ariane Walz; Danijela Markovic; Climatic and socioeconomic effects on land cover changes across Europe: Does protected area designation matter?. PLOS ONE 2019, 14, e0219374, 10.1371/journal.pone.0219374.
- Zydron, A.; Antkowiak, M.; Lisiak, M.; Szczepański, P. The analysis of urban pressure on protected areas on the example of Puszczykowo commune. Studia I Pr. WNEIZ US 2016, 46, 409–422. Xuezhong Fan; Zhirong Jia; Xiaoyan Dai; Na Sun; Fang Han; Jingli Lu; Ecological quality dynamics around marine reserves in the Bohai Sea coastal zone and their relationship with landscape artificialization. Global Ecology and Conservation 2019, 20, e00778, 10.1016/j.gecco.2019.e00778.
- Karen, B.M.; McCleery, R.A.; Binford, M.W.; Zweig, C. Land-cover change within and around protected areas in a biodiversity hotspot. J. Land Use Sci. 2015, 11, 154–176. Rob H.G. Jongman; Nature conservation planning in Europe: developing ecological networks. Landscape and Urban Planning 1995, 32, 169-183, 10.1016/0169-2046(95)00197-o.
- Adhikari, A.; Hansen, A.J. Land use change and habitat fragmentation of wildland ecosystems of the North Central United States. Landsc. Urban Plan. 2018, 177, 196–216. UNEP-WCMC; IUCN. Protected Planet: The World Database on Protected Areas (WDPA). Protected Area Profile for Poland, May 2021. Available online: www.protectedplanet.net (accessed on 5 May 2021)
- Hellwig, N.; Walz, A.; Markovic, D. Climatic and socioeconomic effects on land cover changes across Europe: Does protected area designation matter? PLoS ONE 2019, 14, e0219374. Nationally designated areas (CDDA) Reported 2020 provided by European Environment Agency (EEA). Available online: https://www.eea.europa.eu/data-and-maps/data/nationally-designated-areas-national-cdda-15 (accessed on 7 May 2021)
- Fan, X.; Jiaa, Z.; Daib, X.; Sun, N.; Han, F.; Lu, J. Ecological quality dynamics around marine reserves in the Bohai Sea coastal zone and their relationship with landscape artificialization. Glob. Ecol. Conserv. 2019, 20, e00778. Zaida Soler Luque; Joanna Kostecka; Biodiversity loss, the causes, the state and basic form of nature protection in Spain and Poland. Polish Journal for Sustainable Development 2019, 22, 75-84, 10.15584/pjsd.2018.22.2.9.
- UNEP-WCMC; IUCN. Protected Planet: The World Database on Protected Areas (WDPA). Protected Area Profile for Poland. May 2021. Available online: www.protectedplanet.net (accessed on 5 May 2021).Piotr Krajewski; Monitoring of Landscape Transformations within Landscape Parks in Poland in the 21st Century. Sustainability 2019, 11, 2410, 10.3390/su11082410.
- Nationally designated areas (CDDA) Reported 2020 provided by European Environment Agency (EEA). Available online: https://www.eea.europa.eu/data-and-maps/data/nationally-designated-areas-national-cdda-15 (accessed on 7 May 2021).Malgorzata Grodzinska-Jurczak; Joanna Cent; Expansion of Nature Conservation Areas: Problems with Natura 2000 Implementation in Poland?. Environmental Management 2010, 47, 11-27, 10.1007/s00267-010-9583-2.
- Jongman, R.H.G. Nature conservation planning in Europe: Developing ecological networks. Landsc. Urban Plan. 1995, 32, 169–183. György Büttner; CORINE Land Cover and Land Cover Change Products. Spatial Statistics for Remote Sensing 2014, 18, 55-74, 10.1007/978-94-007-7969-3_5.
- Formy Ochrony Przyrody (EN: Forms of Nature Protection). General Directorate for Environmental Protection. Available online: https://www.gov.pl/web/gdos/formy-ochrony-przyrody (accessed on 10 May 2021).Alexandru-Ionut Petrisor; Using CORINE data to look at deforestation in Romania: Distribution & possible consequences. Urbanism. Arhitectură. Construcţii 2015, 6, 83-90.
- Central Register of the Forms of Nature Protection. Available online: crfop.gdos.gov.pl (accessed on 29 March 2021).Jan Feranec; Gabriel Jaffrain; Tomas Soukup; Gerard Hazeu; Determining changes and flows in European landscapes 1990–2000 using CORINE land cover data. Applied Geography 2010, 30, 19-35, 10.1016/j.apgeog.2009.07.003.
- Conservation Status of Habitat Types Datasets from Article 17, Habitats Directive 92/43/EEC Reporting Provided by EEA. Available online: https://www.eea.europa.eu/data-and-maps/data/article-17-database-habitats-directive-92-43-eec-2 (accessed on 10 May 2021).Gaston, K.; Brown, L.R.; Flavin, C.; French H.; State of World Population 2000. Environmental Conservation 2001, 27 (4), 414-422, 10.18356/7e4afadd-en.
- Luque, Z.S.; Kostecka, J. Biodiversity loss, the causes, the state and basic form of nature protection in Spain and Poland. Pol. J. Sustain. Dev. 2018, 22, 75–84. Szarek-Łukaszewska, G.; Contamination of national parks in Poland - changes in time . Studia Naturae 2006, 54, 189-199.
- Hansen, A.J.; Piekielek, N.; Davis, C.; Haas, J.; Theobald, D.M.; Gross, J.E.; Monahan, W.B.; Olliff, T.; Running, S.W. Exposure of U.S. National Parks to land use and climate change 1900–2100. Ecol. Appl. 2014, 24, 484–502. Damian Łowicki; Land use changes in Poland during transformation: Case study of Wielkopolska region. Landscape and Urban Planning 2008, 87, 279-288, 10.1016/j.landurbplan.2008.06.010.
- The Nature Conservation Act of 16 April 2004. Journal of Laws No. 151, Item 1220, as Amended. Available online: https://isap.sejm.gov.pl/isap.nsf/download.xsp/WDU20040920880/U/D20040880Lj.pdf (accessed on 10 May 2021).Jeffrey D. Parrish; David P. Braun; Robert S. Unnasch; Are We Conserving What We Say We Are? Measuring Ecological Integrity within Protected Areas. BioScience 2003, 53, 851-860, 10.1641/0006-3568(2003)053[0851:awcwws]2.0.co;2.
- Jager, A.L. Preparing CORINE Land cover Data for use. JRS Scientific and Technical Reports; Publications Office of the European Union: Luxembourg, 2012; Available online: https://core.ac.uk/download/pdf/38627375.pdf (accessed on 4 April 2021).Jean-François Mas; Assessing protected area effectiveness using surrounding (buffer) areas environmentally similar to the target area. Environmental Monitoring and Assessment 2005, 105, 69-80, 10.1007/s10661-005-3156-5.
- Danielle A. Jones; Andrew J. Hansen; Kristy Bly; Kevin Doherty; Jacob Verschuyl; Justin I. Paugh; Robin Carle; Scott J. Story; Monitoring land use and cover around parks: A conceptual approach. Remote Sensing of Environment 2009, 113, 1346-1356, 10.1016/j.rse.2008.08.018.
- C. R. Margules; Bob Pressey; Systematic conservation planning. Nature 2000, 405, 243-253, 10.1038/35012251.
- Urs Gimmi; Shelley L. Schmidt; Todd J. Hawbaker; Camilo Alcántara; Ulf Gafvert; Volker C. Radeloff; Increasing development in the surroundings of U.S. National Park Service holdings jeopardizes park effectiveness. Journal of Environmental Management 2011, 92, 229-239, 10.1016/j.jenvman.2010.09.006.
- Ruth DeFries; Krithi K. Karanth; Sajid Pareeth; Interactions between protected areas and their surroundings in human-dominated tropical landscapes. Biological Conservation 2010, 143, 2870-2880, 10.1016/j.biocon.2010.02.010.
- Jerome K. Vanclay; The Effectiveness of Parks. Science 2001, 293, 1007-1007, 10.1126/science.293.5532.1007a.
- Jamrozy, G.; The occurence and tendencies for change in the numbers of mammals in Polish national parks. Sylwan 2008, 152, 02.
- Luigi Boitani; Richard M Cowling; Holly T Dublin; Georgina M Mace; Jeff Parrish; Hugh Possingham; Robert L Pressey; Carlo Rondinini; Kerrie A Wilson; Change the IUCN Protected Area Categories to Reflect Biodiversity Outcomes. PLoS Biology 2008, 6, e66, 10.1371/journal.pbio.0060066.
- Cory R. Davis; Andrew J. Hansen; Trajectories in land use change around U.S. National Parks and challenges and opportunities for management. Ecological Applications 2011, 21, 3299-3316, 10.1890/10-2404.1.
- Luigi Maiorano; Alessandra Falcucci; Luigi Boitani; Size-dependent resistance of protected areas to land-use change. Proceedings of the Royal Society B: Biological Sciences 2008, 275, 1297-1304, 10.1098/rspb.2007.1756.