Your browser does not fully support modern features. Please upgrade for a smoother experience.
Please note this is a comparison between Version 1 by Jesús Acevedo-Borrega and Version 2 by Lindsay Dong.
Computational Thinking (CT) is a transversal and complex competence that goes beyond the use of computers and writing code. It is considered an ideal medium for the development of 21st-century skills.
- computational thinking
- education
1. Introduction
Computational thinking (CT) is a transversal and complex competence that goes beyond the use of computers and writing code. It is considered an ideal medium for the development of 21st-century skills [1]. Its purpose is not exclusively to promote students to opt for training in computing careers. It is about promoting the integral development of citizenship within a free and democratic society [2]. The myth of the “digital native” has been quite detrimental when considering the need for a “digital education” for all those born in the midst of the technological revolution. The effects of the pandemic have shown how the “digital divide” continues to be a very relevant educational problem.
Although the definition of CT has multiple approaches and perspectives [3], its basic component is the creation of “logical artifacts” that make ideas explicit and concrete so that they can be interpreted and applied in computational artifacts. CT focuses on “abstraction”, which is a tool of the constructive mind, and its “computational representation” [4]. Scientific knowledge about CT has a multidisciplinary character, including computer science, cognitive science, and educational science.
Tikva and Tambouris [5][17] developed a conceptual model based on a systematic literature review on CT through programming for compulsory education (K-12). Six areas of CT were identified: (1) knowledge base of CT (concepts, skills, practices, self-perception and attitudes); (2) assessment of CT, by direct (tests, observations, artifact analysis) or indirect (self-report) methods; (3) learning strategies for CT based on games, simulations, problem solving, projects, scaffolding and collaboration; (4) individual and contextual variables (demographic, psychological, cognitive and academic factors); (5) tools (programming software and learning communities; robotics and microcontrollers; CT-specific educational resources); and (6) competency development (curriculum for CT teaching, initial and ongoing teacher training). It is evident that some of the relationships between the identified areas have not been sufficiently studied. From among them, springs forth the knowledge about which tools best develop certain learning strategies. It can also be seen which learning strategies favor the acquisition of CT or which variables significantly affect its development. Meanwhile, the interest of researchers was especially focused on the area of assessment, where efforts have been made to develop validated strategies for general use in self-report mode. The studies do not accurately reflect the application of the tools and learning approaches used.
Educational systems are renewing their contents to include these digital competencies [6][7][18,19]. Teachers face several challenges in integrating CT into their teaching practice: weak technological infrastructure and a lack of time for pedagogical design and creation of teaching materials, as well as insufficient training [8][9][20,21]. In addition, there is low-level knowledge about CT and its teaching methodology [10][11][22,23].
2. Research Progress of Computational Thinking
2.1. Conceptual Relationship Surrounding the Term CT
Figure 12 shows seven clearly differentiated clusters, obtained from the co-occurrence of the keywords of the articles. The first cluster that stands out is the blue one, and, in it, the direct relationship of CT to “Methodologies” can be observed. In the red cluster, “Competence”, the three dimensions of CT related to 21st-century skills, and the educational curriculum are perceivable. Between both clusters, a series of brown elements can be found that revolve around “Problem Solving”.
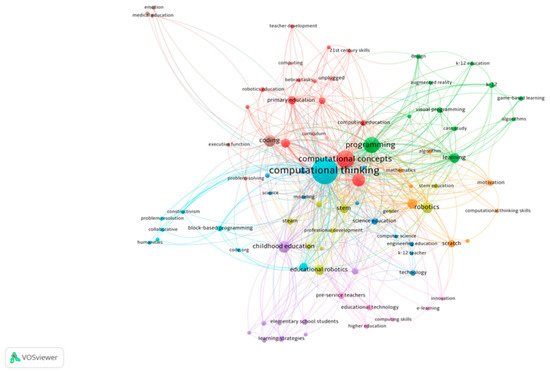
Figure 12.
Co-occurrence map by keywords (minimum frequency 2).
2.2. Distribution of Items According to CT Dimensions and Their Position in the Database
The first quartile (Q1) includes 65 articles (44.82%). There are 42 (28.96%) corresponding to the second quartile (Q2). In the third quartile (Q3) a total of 21 articles have been published, representing 14.48% of the total. Finally, nine articles (6.2%) belong to the last quartile (Q4). The number of articles published in non-indexed journals in these quality indexes, is eight (5.51%).
The three dimensions were subjected to an analysis, taking into account the databases and the level of quality of the journals in which the articles were published, and a new vision was obtained, as shown in Figure 24. Last place goes to “perspective”. However, regardless of the dimension, it is evident that most of the articles had a high quality, being published mostly in Q1 and Q2.
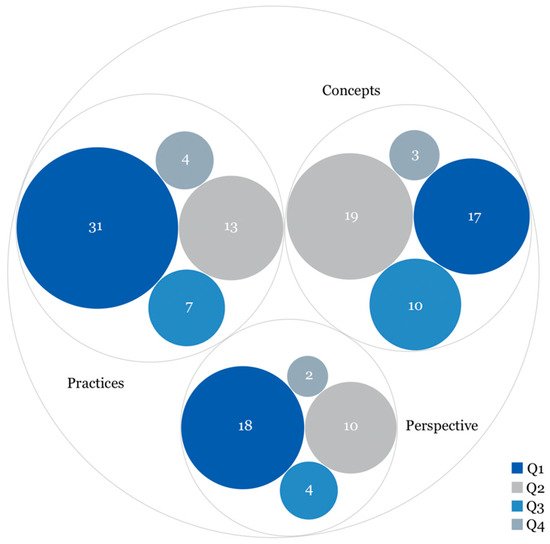
Figure 24.
Distribution of items for each CT dimension and Q level. Prepared with RAWGraphs.
2.3. Interactions and Relationships between the Authorships
Figure 35 shows the relationship between the articles (with DOI) that make up the review sample and their citations over time. The relationship is evidenced not only among themselves, but also with 10 other very relevant articles on CT [12][13][14][15][16][17][18][19][20][16,30,31,32,33,34,35,36,37]. As can be seen, the bulk of lines link directly to the authors mentioned. However, the lines linking them to each other are tiny in comparison.
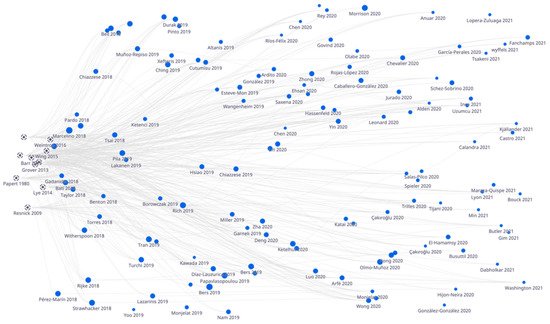

Figure 35.
Co-authorship map of articles in possession of DOI. Elaborated with Litmaps.
2.4. Topics about Which the Articles
Among the thematic areas, “Social Sciences” stands out with a large percentage at 77.28% of the publications with 112 articles. It is followed by “Computer Sciences” at 7.59% and “Engineering” at 6.21%, as a result of the 11 and 9 publications that were associated, respectively, with their areas.
Among the disciplines, four represent 83.49% of the publications: “Education” stands at 69%, being the most productive with 100 articles. It is followed by “Communication”, “Computer Science” and “Engineering” at 4.83% each.
2.5. Geographical Distribution of Publications
The United States, Spain, Turkey, Korea and the United Kingdom make up 51.06% of the sample. Of this percentage, 21.39% corresponds to the United States, with 31 publications, and 14.49% to Spain, with 21 published articles. Turkey, Korea and the United Kingdom had a publication frequency of 9, 7 and 6 respectively.
Thus, the United States and Spain are the nations that stand out with the greatest power. However, neither country includes CT in the official curriculum, leaving it up to the states or autonomous regions to decide how to incorporate it into educational practice. The countries that follow them in number of publications, Turkey, South Korea and the United Kingdom, do have CT integrated into their educational systems [21][38].
2.6. Research Methodologies and Sample Sizes
The main research approach of the publications was a quantitative and mixed method, combining quantitative and qualitative approaches. Both are equal with 37.26% of the sample, which means a total of 54 articles for each mode. Third place is occupied by the qualitative methodology with 37 articles (25.53%).
Based on the research methods applied in the studies, first place can be evidenced for instructional design with a total of 50 articles (34.5%). This is followed by the quasi-experimental method with 34 publications (23.46%). Case studies were included in 23 articles (15.87%). The 13 experimental studies account for 8.97%, followed by 5.52% corresponding to the design-based research (DBR) method. Adding both percentages to those obtained by exploratory data analysis (seven articles), they represent more than 90% of the sample.
2.7. Educational Levels and Areas of Knowledge Involved
Educational practices were carried out equally in formal educational contexts. This includes those ranging from early childhood education to higher education and non-formal and those outside educational institutions. Specifically, 48% of the practices were carried out in both settings. Seventy articles were developed in a formal context and another seventy in a non-formal one. Only 4% of the 145 articles analyzed (five articles) mixed both contexts.
The formal educational levels in which research was carried out included early childhood education at 9.66%, which is in fourth position (14 articles). Secondary education was the third most researched educational level with 20 publications (13.8%). The educational levels most chosen by researchers were higher education and primary education, at 20.01 and 40.02%, respectively. Higher education was found in 29 articles, while primary education was found in 58 of the 145 articles.
Outside the scope of formal educational institutions, 0.69% corresponded to family education: a single article that included fathers and mothers in the development of computational thinking. Finally, we found at identical percentages, 7.59%, the practices addressed to active teachers and those applied at different levels.
2.8. Methodological Characteristics for CT Development
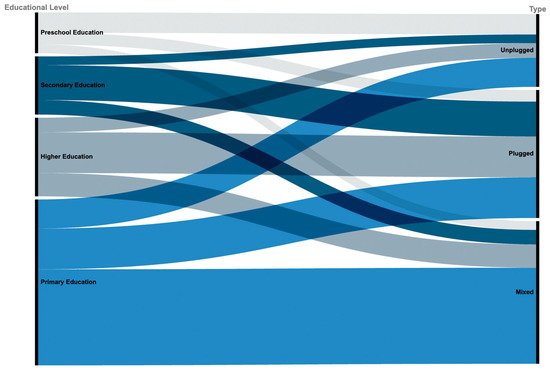
“Plugged” resources, those that need a digital environment to be used, and “unplugged”, tangible materials that can be used analogically, accounted for 80% of the sample, with 57 articles, respectively. The rest opted for combining resources of both types, for example, through robotics. Figure 46 shows the relationship between formal educational levels and the types of resources used in their research.
Figure 46.
Educational levels related to type of resources. Developed with RAWGraphs.
2.9. Didactic Tools Used for the Development of the CT
Figure 57 provides an overview of the specific resources used by the authors based on the types of resource, namely: “hardware”, “software” and “tools”. Physical resources account for 34.45% of the sample, digital resources account for 37.81 and 27.73% are identified within the “various tools” category. The 119 resources are shown in the following summary table (https://bit.ly/3F8Dyw1 (accessed on 24 October 2021)):
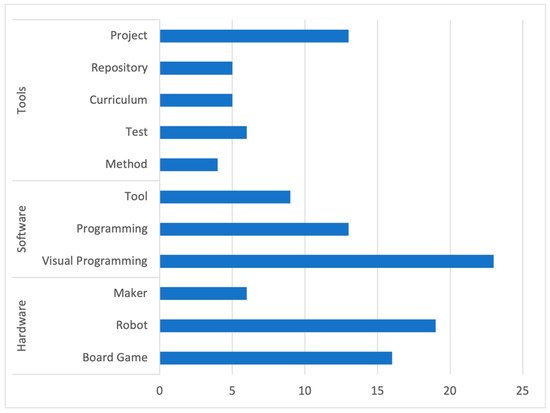

Figure 57.
Number of types of resources used in publications.
