1. Introduction
A commercial application of rechargeable sodium-ion batteries (SIBs) would bring substantial alleviation and expansion of the existing energy storage market, which is mainly based on the Li-ion battery (LIB) technology. In terms of material abundance, SIBs appear to be the cheaper alternative to LIBs that enables their usage in high-scale energy storage, for instance, in smart-grid applications. The positive electrode (cathode) materials, especially the layered transition metal oxides, are an intensively studied topic in the field of SIBs, mostly because of the fact that the overall battery energy and power density are primarily limited by the cathode material. Since the ionic volume of sodium is about 70% larger than that of lithium, the structural chemistry of the Na-ion (de)intercalation systems is more complicated compared to the Li-based ones as the size difference of Na
+ and transition metal cations M
2+ or M
3+ is quite large, demanding higher flexibility of the hosting frameworks. State-of-the art cathode materials for SIBs belong to two large groups: layered and 3-dimensional 3d and 4d metal oxides and polyanion structures (phosphates, sulphates, etc.)
[1][2].
Vanadium pentoxide V
2O
5, belonging to the family of 2D oxides, was studied as an insertion structure for both sodium and lithium ions
[3]. A family of sodium-vanadium bronzes with the general formula Na
xV
2O
5 (0 < x ≤ 2) with mixed valence of the vanadium ions between V
4+ and V
5+, unlike the bronzes of other transition metals, comprises a wide variety of structures termed α-, β-, γ-, δ-, τ-, α’-, η-, κ and χ
[4][5][6][7][8][9][10]. The general structure motive for the Na
xV
2O
5 bronzes is adopted from the layered structure of V
2O
5, which is built of edge- and vertex-sharing VO
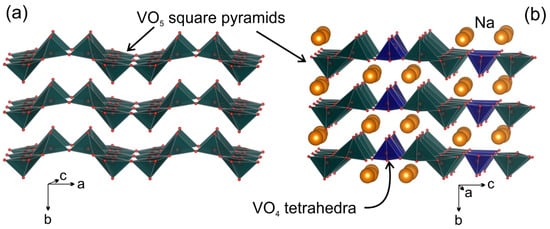
5 square pyramids (
Figure 1a), though the crystal structures of the bronzes are exceptionally flexible as exemplified with the layered (α-phase) and tunnel (β-phase) materials
[11][12]. Among sodium-based vanadium bronzes, monoclinic β-Na
0.33V
2O
5 has gained much attention because of tunnel structure, adopting three different Na intercalation sites and ensuring good structural reversibility even upon deep charge/discharge. Numerous attempts in preparation of nanostructured β-Na
0.33V
2O
5 resulted in impressive discharge capacity above 300 mAh g
−1 in the Li-ion cells
[13][14][15][16]. The cycling performance is highly dependent on the particle’s morphology, potential window and current density, and the best compromise between these electrochemical characteristics seems to be reached for the micro-rod β-Na
0.33V
2O
5 material showing 297 mAh g
−1 discharge capacity at low current density (1.5–4.0 V vs. Li
+/Li), which is retained with a high efficiency after at least 50 cycles
[13].
Figure 1. Polyhedral presentation of the crystal structure of V2O5 (a) and Na9V14O35 (b).
The α-V
2O
5 matrix could adopt various phase transformations during Li
+ (de)intercalation. For example, the reduction of V
2O
5 in an anodic range below 1.9 V
[17] results in formation of the Li
3V
2O
5 phase with a disordered rock-salt structure, which can be reversibly cycled between 0.01 V and 2 V with a specific discharge capacity of 266 mAh g
−1 (current density 0.1 A g
−1)
[18]. Impressive cycling performance of Li
3V
2O
5 is preserved even at higher cycling rates, demonstrating the discharge capacity of 200 mAh g
−1 after 1000 cycles at 1 A g
−1.
Information on electrochemical behavior of vanadium bronzes or V
2O
5 in Na cells is still limited. γ-Na
xV
2O
5 (x = 0.96; 0.97) synthesized by electrochemical reduction of γ’-V
2O
5 exhibits an orthorhombic layered structure (S.G.
Pnma) related to the parent structure of V
2O
5, and shows specific capacities between 80–125 mAh g
−1 in the one-step sodium-extraction-insertion process at 3.3–3.4 V vs. Na
+/Na
[7][9]. Muller-Bouvet et al. studied the electrochemical behavior of α’-NaV
2O
5, which was electrochemically formed during discharge of V
2O
5 in Na cell in the 3.0–1.6 V potential range. The α’-NaV
2O
5 bronze with an orthorhombic structure, which delivers a specific capacity of 120 mAh g
−1 at 0.1 mA cm
−2 current density, is also suitable for reversible sodium intercalation
[19]. High discharge capacity of 250 mAh g
−1 retained with 88% efficiency after 320 cycles at 20 mA g
−1 (3.8–1.5 V vs. Na
+/Na) was reported for so-called “bilayered” V
2O
5 with short-range ordering in the crystal structure, though no structural data were provided for the Na-containing phases formed during the reversible (de)intercalation process
[20]. Nanostructured Na
0.33V
2O
5 tested as an electrode material within the potential window of 1.5–4.0 V vs. Na
+/Na demonstrated capacity of 130 mAh g
−1 at the first discharge, and it showed gradual decay up to 90 mAh g
−1 after 50 cycles at a 50 mA g
−1 current density
[21].
Inspired by high specific capacities and long cycling performance of vanadium bronzes, on the one hand, and the lack of a comprehensive study of vanadium bronzes in Na cells, on the other hand, we tailored this study to investigate the η-Na
xV
2O
5 (x ~ 1.29) bronze as the host structure for (de)intercalation of Na cations. η-Na
xV
2O
5 or Na
9V
14O
35 crystallizes in the monoclinic lattice with the space group
P2/
c [22][23] and adopts a crystal structure built of (010) layers formed by VO
5 (V
4+) square pyramids and VO
4 (V
5+) tetrahedra, with the sodium atoms embedded between the layers (
Figure 1b). Similarly to the mixed-valence sulfates, phosphates and other polyanion structures, Na
9V
14O
35 can be considered as sodium vanadium(IV,V) oxovanadate Na
9V
104.1+O
19(V
5+O
4)
4. Theoretical capacity of η-Na
xV
2O
5 in case of extraction of all sodium atoms can be estimated as ~163 mAh g
−1 that, being complemented with possible electrochemical activity in the anodic area, makes this material of potential interest as a new intercalation system for Na ions.
2. Current Insights
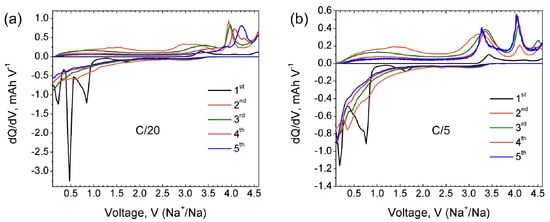
Additional information about the electrochemical processes involved during Na (de)intercalation is provided by dQ/dV curves at the C/20 rate (black curve in
Figure 2a). The first cycle dQ/dV curve shows a broad cathodic peak at 3.3–3.4 V corresponding to the Na extraction, and an incomplete process of further Na extraction at 4.6 V. The first cathodic peak matches well with the (de)intercalation potential reported for γ-Na
xV
2O
5 [7][9]. Anodic dQ/dV curve at the first discharge reveals Na insertion at potentials of 0.85 V, 0.48 V and 0.25 V. The origin of a small broad peak near 1.5 V is ambiguous and can be tentatively interpreted as a minor amount of embedded Na. dQ/dV curves for further cycles confirm the irreversible character of the Na insertion during the first discharge and no anodic peaks are observed anymore. At the same time, the cathodic curves for second and third cycles reveal a sharp peak at 3.9 V which becomes broader and shifts towards 4.0 V and 4.2 V at fourth and fifth cycles, respectively. These well-pronounced cathodic peaks indicate quantitative sodium extraction from the structure formed upon the first discharge.
Figure 2. dQ/dV curves of Na9V14O35 in Na half-cell for the first five cycles at C/20 (a) and C/5 (b) current rates.
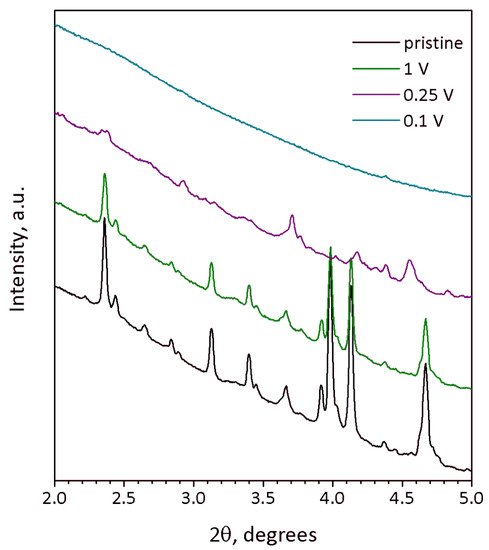
The degradation of the crystal structure supposed from galvanostatic curves is corroborated by ex situ SXRD (
Figure 3) of Na
9V
14O
35 at different states of discharge. The SXRD pattern of the material discharged to 1 V still looks identical to that of the pristine material and reveals close unit cell parameters
a = 15.206(1) Å,
b = 5.0325(8)(1) Å,
c = 20.781(2) Å, β = 109.166(5)°, V = 1502.1(4) Å
3 (
Figure S5). The difference of unit cell volumes for the pristine and 1-V-discharged compounds is about 0.6 Å
3 and falls into the range of two standard deviations, keeping in mind the unit cell volume of 1500 Å
3 (
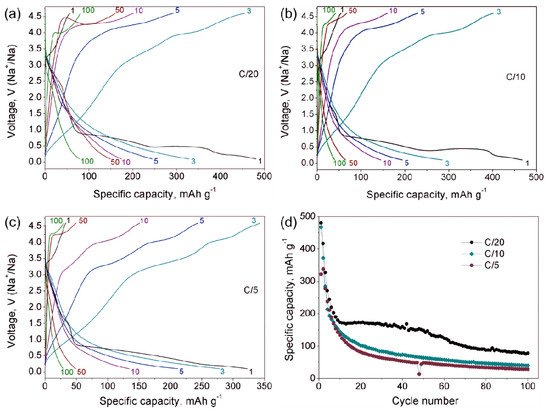
Table 1). The absence of a significant change of the unit cell volume corresponds to a low discharge capacity of ~60 mAh g
−1 registered at 1 V, since no significant amount of sodium has been intercalated into the structure at this potential. Moreover, [010] SAED pattern and HAADF-STEM image taken from the 1-V-discharged material (
Figure S6) are obviously identical to those of pristine Na
9V
14O
35. Both SXRD and TEM data correlate with the dQ/dV curve in
Figure 2a, showing that no considerable Na insertion occurs above 1 V.
Table 1. Crystallographic data and parameters of the Rietveld analysis of Na9V14O35.
| Formula Unit |
Na9V14O35 |
| Space group |
P2/c |
| a, Å |
15.19901(17) |
| b, Å |
5.03271(4) |
| c, Å |
20.7739(2) |
| β, ° |
109.1635(6) |
| V, Å3 |
1501.0(4) |
| Z |
2 |
| ρcalc, g cm−3 |
3.2748 |
| Parameters refined |
100 |
| Temperature, °C |
25 |
| Radiation |
Mo-Kα |
| 2θ range, step, deg. |
5−70, 0.01 |
| Number of reflections |
4389 |
| RF, RP, RwP |
0.034; 0.055; 0.071 |
Figure 3. SXRD profiles of Na9V14O35 electrodes at different state of charge: pristine (black), discharged to 1 V (green), 0.25 V (violet) and 0.1 V vs. Na+/Na (turquoise). Wavelength λ = 0.20736 Å.
The SXRD pattern of the 0.25-V-discharged material (
Figure 3, violet curve) demonstrates suppressed but still visible reflections, the positions of which do not match those of pristine Na
9V
14O
35. Although the quality of the SXRD pattern is insufficient for the Rietveld refinement, the reflections still can be indexed with the
P2/
c unit cell of Na
9V
14O
35, but with a much larger
b-parameter resulting in an about 31% increase of the unit cell volume:
a = 15.347(3) Å,
b = 6.301(1) Å,
c = 21.367(3) Å, β = 107.253(9)°, V = 1973.3(8) Å
3 (
Figure S7). The expansion of the structure along the
a- and
c-axes is small (0.9% and 2.8%, respectively), but the expansion along the
b-axis is huge and amounts to ~25.2%. This difference reflects the rigidity of the (010) layers formed by tightly interlinked VO
5 square pyramids and VO
4 tetrahedra, in which the expansion in the
a-
c plane occurs through elongation of the V-O bonds upon reduction of vanadium cations with increase in their ionic radius (r(V
2+) = 0.79 Å, r(V
3+) = 0.64 Å, r(V
4+) = 0.58 Å, r(V
5+) = 0.54 Å, CN = 6)
[24]. Large increase in the interlayer separation is in line with the necessity to provide enough space to accommodate large amounts of Na, as the specific capacity at 0.25 V exceeds 400 mAh g
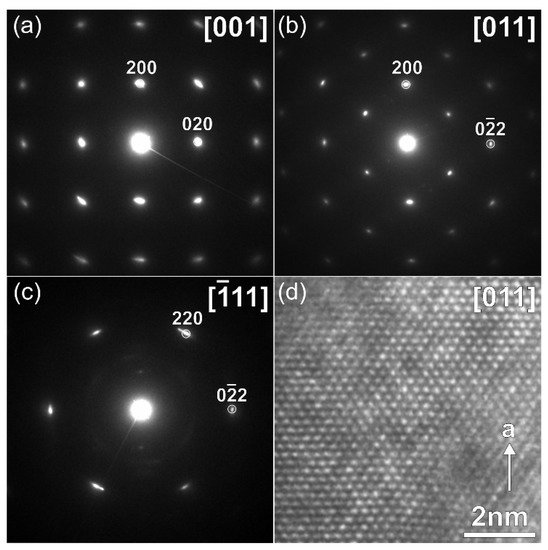
−1. This must cause structure instability, and indeed, the crystals with another symmetry were found in the 0.25 V-discharged material, as one can see from the SAED patterns and high-resolution HAADF-STEM images, which are typical for a disordered rock-salt (DRS) structure with
F-centered cubic lattice, a unit cell parameter
a ~ 4.7 Å (
Figure 4) and a Na:V ≈ 1:1 atomic ratio (
Table 2). This observation is in agreement with the formation of the DRS structure, in which Na and V atoms randomly occupy the same crystallographic positions. The formation of the DRS structure was observed earlier in the related Li-ion system
[18], in which it demonstrated a stable cycling at anodic potentials. However, the conversion process continues further in Na
9V
14O
35 up to 0.1 V resulting in a complete amorphization as indicated by absence of any reflections in the corresponding SXRD pattern (
Figure 3, turquoise curve). Regarding the Na and V distribution, the 0.1-V-discharged sample is strongly inhomogeneous. It still contains particles with the Na:V ≈ 1:1 atomic ratio (
Table 2), but another phase, strongly enriched with Na up to Na:V ≈ 6.7:1 (
Table 2,
Figure S8), also appears in the sample, and is probably responsible for the high capacity of 490 mAh g
−1. The multicomponent nature of active material at 0.1 V and progressing structural degradation upon further cycles cause the fast decrease of discharge capacity even at low current density (
Figure 5d).
Table 2. Na:V atomic ratio calculated by STEM-EDX for Na9V14O35 at different states of (dis)charge.
| Charge/Discharge Voltage |
Na:V Ratio 1 |
| pristine |
8.8(2):14.0 |
| 4.6 V |
6.0(4):14.0 |
| 0.25 V |
15.0(9):14.0 |
| 0.1 V |
Phase 1: 13.9(3):14.0Phase 2: 94(3):14.0 |
Figure 4. SAED patterns (a–c) indexed in the F-centered cubic lattice and [011] HAADF-STEM image (d), corresponding to DRS structure formed during discharge of Na9V14O35 to 0.25 V vs. Na+/Na.
Figure 5. Galvanostatic charge-discharge curves of Na
9V
14O
35 in Na cells at C/20 (
a), C/10 (
b) and C/5 (
c) current rates. (
d) Dependence of the specific discharge capacity on cycle number for different C-rates.
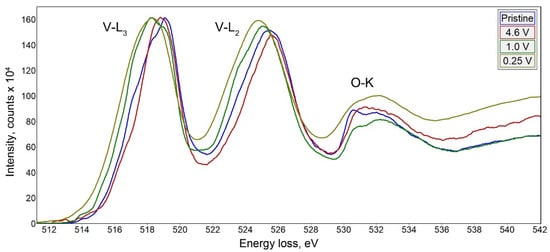
To draw the correlation between the structural transformation and change in the oxidation state of vanadium upon electrochemical cycling, we recorded EELS spectra in the vicinity of V-L
3,2 edge (
Figure 6). The spectra were interpreted in terms of correlation between the vanadium oxidation state and the onset of the V-L
3 edge as proposed by Tan et al.
[25]. The empirical dependence between the V-L
3 edge onset E
V determined at 10% of the maximum height of the V-L
3 edge, and the vanadium formal oxidation V
V state demonstrates a linear increase of E
V with V
V. We have used the linear E
V-V
V equation derived from a set of standard materials by Tan et al.
[25] to estimate the vanadium oxidation state in the samples under investigation. In the pristine material, the onset energy is at E
V = 515.2 eV that corresponds to V
V = +4.3, in good agreement with the average oxidation state of +4.36 from the chemical composition Na
9V
4.1+10O
19(V
5+O
4)
4. Charging to 4.6 V vs. Na
+/Na slightly shifts the V-L
3,2 edge towards a higher energy loss resulting in E
V = 515.4 eV and V
V = +4.5 that corresponds to extraction of 3 Na per Na
9V
14O
35 formula unit as deduced from the electrochemical data and EDX analysis (Na
6V
14O
35, V
V = +4.57). Upon discharge to 1 V and 0.25 V, the V-L
3 edge onset energy is reduced to E
V = 514.8 and 514.3 eV, respectively, providing V
V = +3.9 and +3.5. It should be noted that the vanadium reduction from +4.5 to +3.5 upon discharge from 4.6 V to 0.25 V accounts for only ~250 mAh g
−1 capacity that corresponds to the end of the first discharge plateau. Thus, the capacity of the second and third discharge plateaus should be attributed to a conversion reaction with the formation of the Na-rich phase. Unfortunately, the two-phase nature of the sample discharged to 0.1 V and strong Na inhomogeneity even within the same crystallite (
Figure S8) prevent sensible EELS measurement of V
V.
Figure 6. EELS spectra of Na9V14O35 at different states of charge in the vicinity of the V-L3,2 edge.
