Your browser does not fully support modern features. Please upgrade for a smoother experience.
Please note this is a comparison between Version 2 by Bruce Ren and Version 1 by Suraj Kumar Singh.
The extensive work on the increasing burden of aerosols and resultant climate implications shows a matter of great concern.
- aerosol
- climate
- AERONET
- MODIS
- CALIPSO
- radiative forcing
- Himalayas
1. Introduction
Climate change has been mainly attributed to increased atmospheric greenhouse gases (GHGs) leading towards a warming climate. Apart from GHGs, scientists are also assessing the impact of aerosols in acting as the agents of the warming climate as a result of their established function in affecting the atmospheric energy balance and thus directly affecting global climate model (GCM) predictions. This uncertainty in the GCM projections is partly incorporated by an incomplete understanding of how aerosols affect various climate system components. Aerosols are tiny particles existing in solid, liquid, or gaseous phases (from 0.001 μm to 100 μm), getting circulated between the land surface and stratosphere [1,2][1][2]. Biomass burning, mineral dust, volcanic eruptions, and incomplete combustion of fossil fuels are prominent sources of atmospheric aerosols [2,3][2][3]. Aerosols of anthropogenic origin influence the microclimatic system through their absorption and scattering of incoming solar radiations [4,5,6][4][5][6].
Aerosols interact with incoming solar radiations, either by the way of scattering or absorption, leading to either a cooling or warming effect on the atmosphere’s overall energy budget, respectively [7,8][7][8]. It further depends on the land surface and cloud properties. As a result of this interaction, various global atmospheric processes such as regional and local hydrological cycles [9], monsoons [10], and vertical atmospheric heating profiles are affected [11]. On land, due to the warming effect of aerosols, a direct impact in the form of the accelerated melting of glaciers has been reported [11]. Hence, studying atmospheric aerosol and its impact on certain regions of the Earth, considering the indicator-regions of climate change, such as the Himalayas, has been at the forefront of recent studies in climate change science. Studies have concluded with substantial evidence regarding the role of aerosols in inducing tropospheric heating results in the alpine regions of the Himalayas along with their elevated sites [12].
In this work, we made an attempt to understand co-variability between aerosols originating over West Africa and West Asia and appearing heavy loads of aerosols over the Arabian Peninsula and hence its role in generating a dusty aerosol layer along the northwestern part of Indian Himalaya foothills. This dusty layer forms a layer of aerosols along the foothills of the Indian Himalaya and gives rise to the mechanism so-called “elevated heat pump” [13]. This mechanism amplifies the seasonal heating along with the elevated sites of the Indian Himalaya, leading to increased tropospheric warming, particularly from April to June [14[14][15][16][17],15,16,17], subsequently amplifying and strengthening the monsoon rainfall over northern India between June and July.
Anthropogenic distinctive aerosols have dominated and influential contribution in the microclimatic system through their absorption and scattering properties to solar radiation. This study provides important insight for carrying out studies on the transport of aerosols and their impact over the Himalayan region [7,8][7][8]. The scientific research of aerosol characteristics and transportation to the sensitive geographical part of the globe makes us clear about atmospheric warming, glacier retreat, and regional climate change [18]. A holistic assessment of the aerosol optical and transportation can improve the modeling of aerosol effects and variations in the albedo of snow/glaciers over the Trans-Himalayan region [19]. The emission of anthropogenic particles accelerates the changes in the critical physical signature of the Himalayan Mountain ranges, which is nowadays called the aerosol factory of the globe [20]. It has been seen the impacted region over the world due to implications due to climate change in the Himalayan ranges [21,22,23][21][22][23].
2. A View of Global Aerosol Characteristics
Figure 1 is drawn to illustrate seasonal changes in aerosol characteristics, i.e., aerosol optical depth (AOD) at 0.55 μm wavelength. From the figure, it depicts that the distribution of aerosols is not uniform. The continental aerosol plumes disperse over a wider area of oceanic regions. MODIS observations recognize that the Sahara dust plume is the globally distributed aerosol plume and is extended to several thousand kilometers over the Atlantic Ocean. MODIS observations also identified a few more aerosol hotspots, such as the Taklamakan region, the eastern part of China, the tropical part of Africa, the Arabian Sea, and Indo-Gangetic Plains (IGP). The AOD over these aerosol hotspots regions in most of the months of the year remains more significant than 0.6.
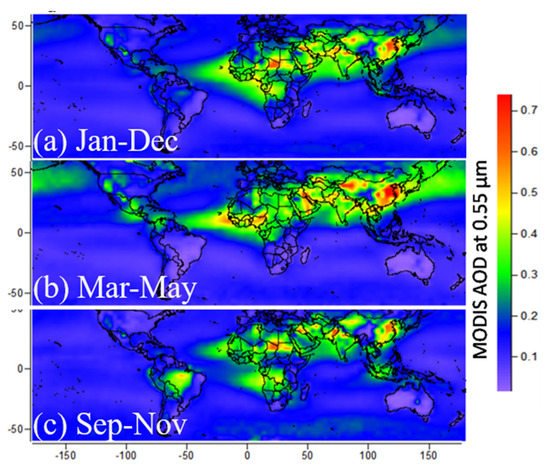
Figure 1. Characteristics of global AOD at 0.55 μm wavelength (period: 2000–2013).
Moreover, atmospheric changes due to aerosols are operative in these aerosol hotspots areas [31][24]. The AOD characteristics for the period of March–May were found different from that of September–November. The seasonal biomass burning, particularly during September–November, is eye-catching over the Amazon basin in South America and South Africa [32,33][25][26]. This feature reflects the seasonal dependent behavior of AOD characteristics. The seasonal dependent behavior of AOD characteristics can also be seen over the Mediterranean and the Arabian Sea, as reported by Sheel et al. [25][27].
3. A View of Regional Aerosol Characteristics: Indian Region
The maps of regional AOD characteristics over the Indian region depict that the aerosol distribution pattern is more or less similar in all years (Figure 2). These maps are drawn using an integrated approach of MODIS sensors, i.e., Dark Target and Deep Blue, which have separate land and ocean algorithms. There can be noticed with a decreasing pattern in aerosol distribution from 2003 to 2007, whereas there observed no significant change over the Arabian Sea with shifts to higher aerosol loadings. The signatures of aerosol burden over the Arabian Sea before and after 2007 are distinguishable. The satellite maps suggest heavy dust storms after 2007 [34][28].
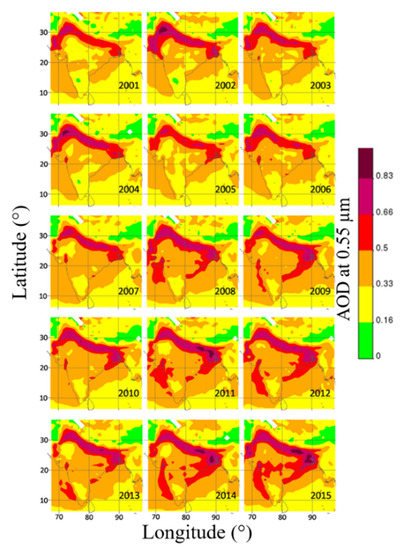
Figure 2. Time-averaged maps of Dark Target plus Deep Blue AOD at 0.55 μm wavelength for each year, i.e., from 2001 to 2015.
The western part of India, particularly Rajasthan, was observed with extensive aerosol loading followed by Gujarat. A slight decrease in annual mean AOD can be noticed in the following years, which could be related to enhanced forest cover and rainfall [35][29]. A moderate AOD can be seen over Madhya Pradesh and western Maharashtra. Eastern India comprises the IGP region and observes a heavy aerosol burden. The sizeable annual aerosol loading can be ascribed to its topography (i.e., northern plain and the elevated Himalayas), patterns of wind, and higher emissions from anthropogenic sources [36][30]. The amount of aerosol was noted over West Bengal, followed by Bihar and Jharkhand. The eastern states observe moderate to low aerosol loading. Satellite observations capture an increasing pattern from west to east, especially IGP. Southern India experiences a relatively low aerosol burden. However, moderate to high aerosol loadings in surrounding oceanic regions can be observed. The Southern part of India (Kerala, Karnataka, and Tamil Nadu) experiences the lowest aerosol burden, particularly in the winter season, whereas the maximum is in the monsoon.
4. Observational Evidence of Aerosol Transport towards the Elevated Sites of the Himalaya
Figure 1 and Figure 2 confirm that IGP is an aerosol hotspot area in the Himalayan foothills. The aerosol accumulated along the elevated sites of the Himalayas is mainly associated with desert dust [37][31], which is primarily transported from western regions [38][32]. These dust plumes are further transported towards elevated Indian Himalaya, imposing a severe threat to the Himalayan glaciers. The collective approach of HYSPLIT back-trajectory analysis, MODIS, and CALIPSO observations is a vital tool to identify aerosol sources employing transport from the distant source origin. This collective approach was previously used in numerous studies [39,40][33][34].
Globally, the incidences of events of dust storms are the most prevalent atmospheric phenomenon from March to June. The Sahara Desert, the Thar Desert of India, and the Arabian region are the primary origins of aerosols of desert dust. Desert dust originates over these regions and then is widely distributed by means of atmospheric transport. The observational evidence of atmospheric dust transport (dust plumes) is revealed from the satellite imaginaries (see Figure 3).
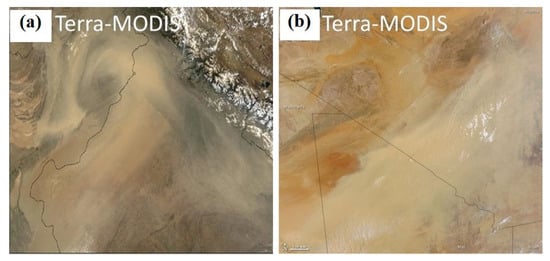
Figure 3. Satellite imaginaries showing transport of desert dust on (a) 9 June 2010 and (b) 10 June 2010 (Source: NASA Image Courtesy, 2010).
On 10 June 2010, the MODIS on the Terra satellite recorded a massive dust plume that swept across the Sahara Desert (Figure 3a). The plume spreads from Mauritania through Mali and into Algeria, appears only slightly brighter than the earth-toned terrain below. The dust plume develops unique wave patterns over Algeria, but it is thinner than it was over Mali. The dust storm’s source locations aren’t visible in this view, but vast sand seas engulf almost all of Mauritania, crossing the Mali–Algerian border. The original dust plumes are thought to have originated in the southwest and blown northeast, churning up further dust and dirt along the route. On 9 June 2010, thick clouds of desert dust blew across Pakistan (left) and India (right) in the base of the Himalayan Mountains (Figure 3b). The MODIS-Terra satellite obtained this image of the incident. On the snow-capped peaks of the Himalayas at the top right and the Indo-Gangetic Plain, the storm looks to be putting down a blanket of dust. We infer from satellite image analysis that many dust aerosols start over the Sahara, India’s Thar Desert, and the Arabian area and then travel to the northern section of the country, impacting regional climate.
To investigate the influence of atmospheric dust transport in modulating the physical properties of aerosols, we took the example of a typical month, i.e., May 2016, and the day of low aerosol loading (7 May 2016) and extensive aerosol loading (27 May 2016) are analyzed. The aerosol volume size distribution (DV/dlnR) depicts aerosols’ bi-modal structure (Figure 4). AERONET station installed at IIT Kanpur is one of the represented sites in IGP. The aerosol volume distribution is estimated from the spectral Sun and sky radiance data using a well-explained technique by Dubovik and King (2002) [41][35]. We found that during dust aerosol loading day, the volume concentration of aerosols in the size range of 1.3–8.0 μm has increased significantly, implying the domination of coarse-mode particles. Dubovik et al. (2002) observed this type of volume size distribution for desert aerosols. For size particles r < 1.0 μm, there is no significant variation, even during dust loading day, which results in atmospheric transport carrying desert dust (a source of coarse-mode aerosols). Similar results by Dey et al. (2004) report that during dust episode days, the concentration at coarse-mode rises three times, with little change in volume of fine particles [42][36]. The aerosol volume size exhibits two prominent characteristics: fine particles r < 1.0 μm and coarse particles r > 1.0 μm.
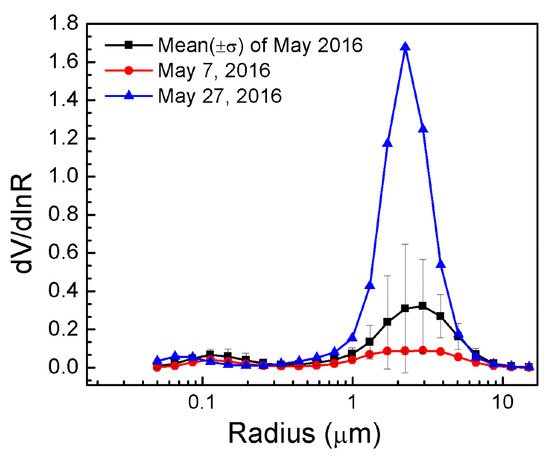
Figure 4. Characteristics of aerosol size distribution during low and significant aerosol loading days.
References
- Pöschl, U. Atmospheric aerosols: Composition, transformation, climate and health effects. Angew. Chem. Int. Ed. 2005, 44, 7520–7540.
- Pósfai, M.; Buseck, P.R. Nature and climate effects of individual tropospheric aerosol particles. Annu. Rev. Earth Planet. Sci. 2010, 38, 17–43.
- Junge, C.E. Air Chemistry and Radioactivity; Academic Press: New York, NY, USA, 1963.
- Ramanathan, V.; Carmichael, G. Global and regional climate changes due to black carbon. Nat. Geos. 2008, 1, 221.
- Stocker, T.; Qin, D.; Plattner, G.-K.; Tignor, M.; Allen, S.K.; Boschung, J.; Nauels, A.; Xia, Y.; Bex, V.; Midgley, P.M. (Eds.) Intergovernmental Panel on Climate Change (IPCC), Climate Change 2013: The Physical Science Basis:Working Group I Contribution to the Fifth Assessment Report of the Intergovernmental Panel on Climate Change; Cambridge University Press: New York, NY, USA, 2014; ISBN 978-1-107-05799-9.
- Bond, T.C.; Doherty, S.J.; Fahey, D.W.; Forster, P.M.; Berntsen, T.; De Angelo, B.J.; Flanner, M.G.; Ghan, S.; Kärcher, B.; Koch, D.; et al. Bounding the role of black carbon in the climate system: A scientific assessment. J. Geophys. Res. 2013, 118, 5380–5552.
- Jiang, H.; Feingold, G. effect of aerosol on warm convective clouds: Aerosol-cloud-surface flux feedbacks in a new coupled large-eddy model. J. Geophys. Res. 2006, 111, D01202.
- Fan, J.; Zhang, R.; Li, G.; Tao, W.-K.; Li, X. Simulations of cumulus clouds using a spectral microphysics cloud-resolving model. J. Geophys. Res. 2007, 112, D04201.
- Ramanathan, V.; Chung, C.; Kim, D.; Bettge, T.; Buja, L.; Kiehl, J.T.; Washington, W.M.; Fu, Q.; Sikka, D.R.; Wild, M. Atmospheric brown clouds: Impacts on South Asian climate and hydrological cycle. Proc. Natl. Acad. Sci. USA 2005, 102, 5326–5333.
- Vinoj, V.; Rasch, P.J.; Wang, H.; Yoon, J.H.; Ma, P.L.; Landu, K.; Singh, B. Short-term modulation of Indian summer monsoon rainfall by West Asian dust. Nat. Geosci. 2014, 7, 308–313.
- Lau, K.M.; Kim, M.K.; Kim, K.M.; Lee, W.S. Enhanced surface warming and accelerated snowmelt in the Himalayas and Tibetan Plateau induced by absorbing aerosols. Environ. Res. Lett. 2010, 5, 025204.
- Guleria, R.P.; Kuniyal, J.C.; Rawat, P.S.; Thakur, H.K.; Sharma, M.; Sharma, N.L.; Mahavir, S.; Chand, K.; Sharma, P.; Thakur, A.K.; et al. Aerosols optical properties in dynamic atmosphere in the northwestern part of the Indian Himalaya: A comparative study from ground and satellite-based observations. Atmos. Res. 2011, 101, 726–738.
- Lau, K.M.; Kim, K.M.; Kim, M.K. Asian monsoon anomalies induced by aerosol direct forcing: The role of the Tibetan Plateau. Clim. Dyn. 2006, 26, 855–864.
- Guleria, R.P.; Kuniyal, J.C.; Rawat, P.S.; Sharma, N.L.; Thakur, H.K.; Dhyani, P.P.; Singh, M. The assessment of aerosol optical properties over Mohal in the northwestern Indian Himalaya using satellite and ground based measurements and an influence of aerosol transport on aerosol radiative forcing. Meteorol. Atmos. Phys. 2011, 113, 1530169.
- Guleria, R.P.; Kuniyal, J.C.; Rawat, P.S.; Thakur, H.K.; Sharma, M.; Sharma, N.L.; Dhyani, P.P.; Singh, M. Validation of MODIS retrieval aerosol optical depth and an investigation on aerosol transport over Mohal in the northwestern Indian Himalaya. Int. J. Remote Sens. 2012, 33, 5379–5401.
- Guleria, R.P.; Kuniyal, J.C.; Dhyani, P.P. Validation of space-born Moderate Resolution Imaging Spectroradiometer remote sensors aerosol products using application of ground-based Multi-wavelength Radiometer. Adv. Space Res. 2012, 50, 1391–1404.
- Guleria, R.P.; Kuniyal, J.C. Characteristics of atmospheric aerosol particles and their role in aerosol radiative forcing over northwestern Indian Himalaya in particular and over India in general. Air Qual. Atmos. Health 2015, 9, 795–808.
- Sellegri, K.; Laj, P.; Venzac, H.; Boulon, J.; Picard, D.; Villani, P.; Vuillermoz, E.; Bonasoni, P.; Marinoni, A.; Cristofanelli, P. Seasonal variations of aerosol size distributions based on long-term measurements at the high altitude Himalayan site of Nepal Climate Observatory-Pyramid (5079 m), Nepal. Atmos. Chem. Phys. 2010, 10, 10679–10690.
- Pant, P.; Hegde, P.; Dumka, U.C.; Sagar, R.; Satheesh, S.K.; Moorthy, K.K.; Saha, A.; Srivastava, M.K. Aerosol characteristics at a high- altitude location in central Himalayas: Optical properties and radiative forcing. J. Geophys. Res. 2006, 111, D17206.
- Bianchi, F.; Kurtén, T.; Riva, M.; Mohr, C.; Rissanen, M.P.; Roldin, P.; Berndt, T.; Crounse, J.D.; Wennberg, P.O.; Mentel, T.F.; et al. Highly Oxygenated Organic Molecules (HOM) from Gas-Phase Autoxidation Involving Peroxy Radicals: A Key Contributor to Atmospheric Aerosol. Chem. Rev. 2019, 119, 3472–3509.
- Yamada, T.; Shiraiwa, T.; Iida, H.; Kadota, T.; Watanabe, T.; Rana, B.; Ageta, Y.; Fushimi, H. Fluctuations of the glaciers from the 1970s to 1989 in the Khumbu, Shorong and Langtang regions, Nepal Himalayas. Bull. Glacier Res. 1992, 10, 11–19.
- Shrestha, A.B.; Wake, C.P.; Mayewski, P.A.; Dibb, J.E. Maximum temperature trends in the Himalaya and its vicinity: An analysis based on temperature records from Nepal for the period 1971–94. J. Clim. 1999, 12, 2775–2786.
- Hasnain, S.I. Himalayan glaciers meltdown: Impact on South Asian rivers. In FRI 2002–Regional Hydrology: Bridging the Gap between Research and Practice; van Lanen, H.A.J., Demuth, S., Eds.; IAHS Publication: Wallingford, UK, 2002; Volume 274, pp. 417–423. Available online: http://hydrologie.org/redbooks/a274/iahs_274_417.pdf (accessed on 17 September 2021).
- Lau, K.M.; Kim, K.M.; Hsu, C.N.; Holben, B.N. Possible influences of air pollution, dust and sandstorms on the Indian monsoon. WMO Bull. 2009, 58, 22–30.
- Bevan, S.L.; North, P.R.J.; Grey, W.M.F.; Los, S.O.; Plummer, S.E. Impact of atmospheric aerosol from biomass burning on Amazon dry-season drought. J. Geophys. Res. 2009, 114.
- Levinson, D.H.; Lawrimore, J.H. State of the Climate in 2007; Arguez, A., Diamond, H.J., Fetterer, F., Horvitz, A., Levy, J.M., Eds.; World Meteorological Organization, 2009; pp. 1–193. Available online: https://library.wmo.int/doc_num.php?explnum_id=9763 (accessed on 17 September 2021).
- Sheel, V.; Guleria, R.P.; Ramachandran, S. Global and regional evaluation of a global model simulated AODs with AERONET and MODIS observations. Int. J. Climatol. 2017, 38, 269–289.
- Kaskaoutis, D.; Rashki, G.; Houssos, E.E.; Goto, D.; Nastos, P.T. Extremely high aerosol loading over Arabian Sea during June 2008: The specific role of the atmospheric dynamics and Sistan dust storms. Atmos. Environ. 2014, 94, 374–384.
- Pandya, M.R.; Singh, R.P.; Dadhwal, V.K. A signal of increased vegetation activity of India from 1981 to 2001 was observed using satellite-derived fraction of absorbed photosynthetically active radiation. Curr. Sci. 2004, 87, 1122–1126.
- Venkataraman, C.; Habib, G.; Eiguen-Fernandez, A.; Miguel, A.H.; Friedlander, S.K. Residential biofuels in South Asia: Carbonaceous aerosol emissions and climate impacts. Science 2005, 307, 1454–1456.
- Schuster, G.L.; Dubovik, O.; Holben, B.N. Ångström exponent and bimodal aerosol size distributions. J. Geophys. Res. 2006, 111.
- Gautam, R.; Hsu, N.C.; Lau, K.M.; Kafatos, M. Aerosol and rainfall variability over the Indian monsoon region: Distributions, trends and coupling. Ann. Geophys. 2009, 27, 3691–3703.
- Singh, R.P.; Dey, S.; Tripathi, S.N.; Tare, V. Variability of aerosol parameters over Kanpur, northern India. J. Geophys. Res. 2004, 109.
- Dubovik, O.; King, M.D. A flexible inversion algorithm for retrieval of aerosol optical properties from Sun and Sky Radiance. J. Geophys. Res. 2000, 105, 20673–20696.
- Dubovik, O.; Holben, B.N.; Eck, T.F.; Smirnov, A.; Kaufman, Y.J.; King, M.D.; Tanré, D.; Slutsker, I. Variability of absorption and optical properties of key aerosol types observed in worldwide locations. J. Atmos. Sci. 2002, 59, 590–608.
- Dey, S.; Tripathi, S.N.; Singh, R.P.; Holben, B.N. Influence of dust storms on the aerosol optical properties over the Indo-Gangetic basin. J. Geophys. Res. 2004, 109.
More