Your browser does not fully support modern features. Please upgrade for a smoother experience.
Please note this is a comparison between Version 3 by Jessie Wu and Version 4 by Jessie Wu.
The kidney is delicate and complex, consisting of a filter unit and a tubular part, which together contain more than 20 different cell types. The tubular epithelium is highly polarized, and maintaining cellular polarity is essential for the optimal function and response to environmental signals.
- drug-induced nephrotoxicity
- three-dimensional
- in vitro models
1. Drug-Induced Nephrotoxicity
Chronic kidney disease affects 8–16% of the global population [1]. It is characterized by the gradual loss of key functions over time, eventually leading to kidney failure requiring dialysis or kidney transplantation to maintain life [2]. Moreover, recent studies further reveal that acute kidney injury (AKI) is positively associated with the risk of chronic kidney disease, and patients with chronic kidney disease complicated with AKI have a higher mortality rate [3]. Even with the advancement of medical technology, the incidence of AKI has gradually increased in recent years, leading to an increase in patient mortality [4]. A variety of risk factors may contribute to the occurrence of AKI, including food preparations, drugs, infection, ischemia, sepsis, and intravenous contrast agents [5][6]. In particular, drug-induced nephrotoxicity is a major contributing factor in approximately 60% of AKI cases in hospitalized patients [7].
Drug-induced nephrotoxicity causes more than 1.5 million adverse events in the United States each year, affecting approximately 20% of the adult population [8][9]. Although kidney damage is usually reversible, it is estimated that the annual management cost is approximately $3.5 billion [8]. Drug-induced nephrotoxicity is driven by multiple mechanisms, including renal tubular cytotoxicity, altered glomerular hemodynamics, inflammation, crystal nephropathy, and thrombotic microangiopathy [10][11][12].
Direct nephron-toxicant mechanisms have been most extensively studied on the renal proximal tubule epithelial cells (RPTEC) (Table 1). However, renal tubular epithelial cells express a wide range of transporters, many of which are unique to specific segments of renal tubules. Consequently, drugs with an affinity for these transporters cause cell apoptosis or death in specific nephron fractions [13][14][15]. In contrast, some drugs, such as amphotericin B, cause renal tubular toxicity by non-specifically destroying the entire tubular epithelial cell membrane. In addition, renal tubular epithelial cells may be damaged by drug penetration, resulting in drug-induced kidney stones or drug-induced ischemic events. For example, contrast agents used in radiographic procedures such as angiography cause nephropathy by inducing oxidative stress and osmosis as well as hemodynamic changes [16].
Table 1. Methods used for in vitro nephrotoxicity assessment in 3D models and in vivo renal tissues.
| Methods | Renal Tubule Epithelia Cells | Podocytes Stromal Cells | ||
|---|---|---|---|---|
| Drugs | Targeted Cells | Drugs | Drugs | |
| Drugs, chemicals, or toxic agents with different doses | Gentamicin [17][18][19][20] Citrinin [17][21] Cisplatin [17][18][19][22][23][24][25][26][27][28][29] Rifampicin [17][30] Acetone [25][28][31] Aspirin [24][27][32] Penicillin G [24][27][33] Tenofovir [26][34] Cyclosporin A [26][35][36] Adriamycin [19][25][37] 4-aminophenol (PAP) [25][38] Colchicine [25][39] Cadmium chloride [40][41] |
Brush border membrane of the proximal tubules S2 proximal tubular segment Basolateral membrane of proximal tubules Apical membrane of renal proximal tubules S1 and S2 proximal tubular segment Loop of Henle Brush border membrane of the proximal tubules Basolateral mem-brane of proximal tubules Brush border membrane of the proximal tubules/Thick ascending limb of the loop of Henle Brush border membrane of the proximal tubules Loop of Henle S3 proximal tubular segment S1 proximal tubular segment |
Doxorubicin [17][42][43] Aspirin [27] Penicillin G [27] Puromycin-aminonucleoside [17][44] Adriamycin [42][43] |
Doxorubicin [17][43] Puromycin-aminonucleoside [17] |
| Time-frames | 24 h [17][18][22][26] 48 h [18][24][27][40] 72 h [19][25][28] 2 wks [19 | |||
[60][61], the validity of 2D in vitro studies is still questionable. Except for culture conditions that are far from the highly complex in vivo conditions, the measurable toxicity endpoints in these reflect a low-complexity system, but they faithfully reflect cell viability and proliferation, have poor physiological or clinical relevance, and there is no predictable in vivo drug response [62].
2.2. Rodent Experiments
The use and outcome of animal models is essential to bridge the translational gap from the in vitro to the clinic. However, animal models are expensive to use, are time-consuming, require expertise, have low throughput potential, and have ethical issues, but most importantly, these models are usually less relevant to human systems [63]. This mismatch between animal and human results is mainly due to the many differences in the expression of drug transporters and metabolic enzymes between species.
Rodents and rabbits are most used as animal models to test nephrotoxicity. However, the expression levels of organic cation transporter 1 (OCT1) and OCT2 are comparable in rodent kidneys, while OCT2 is dominant in human kidneys. The advantage of rabbit is that it is a suitable animal model between rodents and larger animal models (such as primates). The rabbit size allows off-the-shelf blood sampling and makes it easier to obtain many cells and tissues from a single animal. In addition, rabbits live longer than rodents. Genetically, the rabbit immune system and human immune system are significantly more similar than rodent genomes [64]. The differences in the expression of transporters between animals and humans and between different non-human species limit the utility of animal models to study adverse drug reactions. Although these issues are improved, the development of more appropriate in vitro 3D models is needed for preclinical and early-stage clinical development [65].
3. Three-Dimensional Renal Culture Models for Predicting Nephrotoxicity
The perception of in vitro 3D renal models is based on the creation of renal structures mimicking the physical and biochemical features of in vivo renal tissue with multiple cell types contacted to renal extracellular matrix ECM. Thus, 3D renal models are often divided into spheroids, organoids, and tissue-engineered models, and organ-on-chip models used in drug development or renal cancer modeling, are presented in Figure 1.
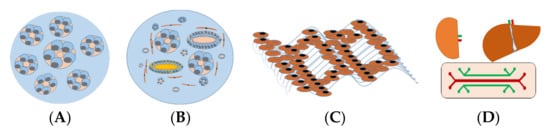
Figure 1. In vitro 3D kidney models for predicting nephrotoxicity. (A) Renal spheroids are often considered as RPTEC embedded in hydrogel to form hollow spherical cysts with an apical membrane facing the renal tubular lumen. (B) Organoids consist of multiple cells, different types of renal tubular, endothelial, and interstitial cells that self-organize in response to developmental cues and overcome the cellular simplicity of 2D cultures. (C) Three-dimensional (3D)-engineered kidney tissue consists of various renal cells with ECM as a complex and highly charged network (i.e., collagen, elastin, laminin, and glycoproteins), providing a 3D structure for the spatial organization of cells. (D) A kidney-liver-on-a-chip that comprises a perfusable, convoluted 3D renal tubule, and liver cells within the ECM enable fluid flow and the administration of test compounds to the apical surface of the cells.
The average in vivo cell density is up to 7.5 × 10⁷ cells/mL, with solute concentrations of 30–80 g/L. By contrast, an in vitro 2D culture can only provide a maximum density of 106 cells/mL with solute concentrations of about 1–10 g/L. Two-dimensional (2D) cell cultures lack in vivo features such as cell–cell and cell–ECM interactions, matrix chemical composition and mechanics, chemotaxis gradients of soluble cell signals, cell oxygenation, and 3D matrix structure. These limitations in 2D culture will affect cell proliferation, polarization, migration, signal transduction, and gene expression [66].
The difference in the physical and physiological properties between 2D and 3D cultures makes 2D cells more susceptible to drugs than 3D cells, because 2D cells cannot maintain their normal morphology compared to 3D cells [67]. Another reason that 2D cells respond differently to drugs than 3D cells is the cell surface receptor organization. Drugs usually target certain receptors on the cell surface. The difference in the structure and spatial arrangement of the surface receptors may affect the drug receptor binding efficiency, thereby triggering different responses [68]. Third, cells cultured in 2D are usually at the same cell proliferation stage, while 3D cells are usually at a different cell proliferation stage, similar to cells in the body [67]. In 3D cellular systems, the cell proliferation stage is limited, which is similar to the in vivo situation [69].
Microfluidics, which is a study of fluid flow in micron-size domains, proves to be an effective technology in the study both in vivo and in vitro. The capability of microfluidic devices to integrate all the necessary components in a less than a 1-inch silicon chip along with the advances in micro-electro-mechanical systems (MEMS) led to highly efficient lab-on-a-chip devices [70]. Other unique features of a microfluidic platform such as its perfect length scale fitting at cellular and tissue levels as well as a very small number of required agents make them an excellent choice for biological applications [71]. The collaboration between engineers, biologists, and medical doctors led to the advent of the organ-on-a-chip [72][73][74].
The initial design of a published kidney-on-a-chip has two compartments [75][76]. A top channel mimics the urinary lumen with fluid flow, whereas the bottom chamber mimics interstitial space and is filled with media. Kidney cells are under much lower shear stress than the endothelial cells. This device used rat distal tubular cells or Madin-Darby Canine Kidney (MDCK) cells, and its shear stress was ≈1 dyn/cm2 [75]. A second report [76] showed a similar design but with human proximal tubular cells attached. In a human renal cell model, the authors reproduced cisplatin nephrotoxicity in this channel system. Proximal tubular epithelial cells have much lower shear stress: ≈0.2 dyn/cm2 [76]. The foot processes of podocyte, a glomerular visceral epithelial cell, form a size- and charge-selective barrier to plasma protein, and derangement of the barrier causes podocyte injury and proteinuria [77]. In addition, podocyte-on-a-chip has been tried with no success yet [78]. The challenge is that podocytes are exposed under a very low shear stress in vivo and require a sophisticated culturing condition.
Although the obvious advantages of 3D culture have been demonstrated, 3D cell culture is not as widely accepted as 2D culture in the research field, which is predicated on the large structural deviation in cellular phenotypes in the 3D model. The inconsistency between the models hinders reproducible experimental data and proper system analysis. Another practical consideration hindering the widespread use of 3D models is the high price, which further limits the feasibility of large-scale experiments [67]. Table 2 summarizes the characteristics of 2D cell culture and 3D cell culture models.
Table 2. In vitro 2D vs. 3D renal models of drug-induced nephrotoxicity.
| Models | Advantages | Disadvantages | |||||
|---|---|---|---|---|---|---|---|
| Biomarkers | References | ||||||
| Protein markers | m-RNA markers | ||||||
| 2D culture | -Robust model -Easy to assess, manipulate -Cost- and time-efficient -Large scale -Retention of key metabolic |
||||||
| Podocytes | Wilms tumor-1 Nephrin Podocin Podocalyxin Synaptopodin | -Static model -Dedifferentiation -Lack of in vivo-like morphologic and phenotypic characteristics -Low complexity -Little predictive -Poor physiological or clinical relevance |
|||||
| NPHS1 | NPHS2 Synaptopodin Wilms tumor-1 Podocalyxin |
[18] [83] [84] [23] [85] |
3D culture | -In vivo-like cell shape -More physiologic characteristics -Response to toxic insults with biomarkers found in vivo | |||
| Proximal tubules | ] | -3D paracrine and autocrine signaling; -Potential penetration gradients toward center -Cells of different stages (proliferating, hypoxic, quiescent, and necrotic) possible -More similar to in vivo expression profiles -Better predictive values to in vivo compound responses60 min [44] 24 h [17] |
Lotus tetragonolobus lectin Aquaporin-1 (AQP1) Cadherin 6 Jagged 1 Megalin Kidney injury molecule 1[22][42] 48 h [27] 5 days [43] |
-Cost-intensive -Simplified architecture -Can be variable -Less amenable to HTS/HCS -Hard to reach in vivo maturity -Complication in assay -Lack vasculature -May lack key cell types24 h [17] 5 days [43] |
|||
| Biomarkers | |||||||
| ABCC1 | ABCC3 ABCC4 SLC22A3 SLC40A1 |
[18] [83] [84 |
Animal models | -Physiological resemblance -Well established |
|||
| -Physiological relevance | -Complete organism -Test drug metabolism |
-Species differences -Low throughput -Poor prediction -Ethical concerns -High costs |
Gene markers | Kim-1 [17][18][23][24] HO-1 [17] |
NPHS1 [17][42] WT1 | ||
Abbreviations: 2/3D, 2/3-dimensional; HTS/HCS, high-throughput screening/high content screening.
4. In Vitro 3D Kidney Models
4.1. Spheroids
Renal spheroids are often considered as in vitro 3D renal tubular structures with RPTEC embedded in ECM (i.e., collagen and laminin) form structures that form hollow spherical cysts with an apical membrane facing the surrounding medium (Figure 1). Most cell types used for spheroids are human renal cell lines (Table 2). The size of a spherical cyst ranges from 150 to 350 μm with cell polarity with a cyst. In addition, the basolateral side of the cell is exposed to hypoxia, and access to this side is limited. Although protein expression can be assessed at the mRNA and protein levels, the ability to track drugs in this system can be challenging [79][80].
4.2. Organoids
Organoids are developed from several types of stem cells from different sources, including human embryonic stem cells (ESC), human-induced pluripotent stem cells (h-iPSC), and renal stem cells/progenitors (Table 2). Due to ethical concerns regarding the culture of embryonic stem cells, iPSC and renal stem cells are preferred. Using h-iPSC, it is possible to generate kidney organoids that contain cell types from different nephron segments. Morizane et al. established a chemically defined protocol to differentiate h-iPSC into pluripotent nephron progenitor cells (NPC), which can form organoids containing podocytes, proximal tubules, Henle rings, and distal tubules (Figure 1) based on the expressed markers. H-iPSC are sandwiched between two Matrigel layers that reduce growth factors, forming an h-iPSC sphere with a cavity [18]. Freedman et al. have shown that the inhibition of glycogen synthase kinase 3b (GSK3b) transforms h-iPSC spheres into complex tubular organoids composed of proximal tubules, endothelial cells, and podocytes [81]. Thus, renal organoids could be a suitable unlimited source of H-iPSC-derived primary proximal tubule cells. However, the characteristics of the proximal tubules of this organoid still require further study. In addition, 3D toxicity models of other key cells are lacking. Each renal cell model (organoid of podocyte, Henle, or distal cells) is desired to establish potential tools to study the role of podocytes in supporting glomerular filtration, the role of Henle and distal cells in reabsorbing water and ions, and the related drug-induced renal injuries.
Although organoids are a relatively simple method for deriving and co-cultivating various kidney cell types, the presence of different nephron segments should detect segment-specific toxicity during the screening process. The major challenge in developing renal organoids is that few biomarkers are both specific and sensitive enough for cell identification and the functional distinguishing of each renal cell type. Although there are many renal biomarkers available (Table 3), more specific renal biomarkers are needed to recognize each type of renal cells within organoids. The universal renal biomarkers for different species and humans are desirable for both experimental and clinical examples. In addition, cell type-specific damage is also important for defining the pharmacology of test compounds with 3D models, but this model has not been presented yet. Furthermore, there is a lack of organoid protocols available to produce histological and functional nephron organoids with renal corpuscle, renal tubule, and collecting ducts that merge into a single collecting system. Finally, the tubules in the organoids can hardly be perfused directionally, which limits test compound administration [65]. Thus, current organoid models can barely show how kidney cells react in an environment with fluid shear stress resembling the urinary flow in the kidney tubules [82].
Table 3. Biomarkers of renal cells.
| Renal Cell Types | ||||||||
|---|---|---|---|---|---|---|---|---|
| ] | ||||||||
| Loop of Henle | Cadherin 1 Uromodulin |
Claudin 10 Claudin 14 SLC12A1 Uromodulin |
[18] [86] [87] [84] |
|||||
| [ | 17 | ] SYNPO [42] |
||||||
| Distal tubules | Pterin-4 alpha-carbinolamine dehydratase 1 Solute carrier family 41 member 3; Cadherin 1 Brn1 Na+/Cl– cotransporter GATA Binding Protein 3 |
Pterin-4 alpha-carbinolamine dehydratase 1 Solute carrier family 41 member 3; Cadherin 1 SLC12A3 Calbindin 1 |
[18] [83 |
Protein markers | Kim-1 [18][19][25][28][40] CYP2E1 [25][28] HO-1 [40] NGAL [19] AQP1 IL-6 [25] TNF [25] MCP-1 [25] IL-1b [25] MIP-1a [25] Rantes [25] Cleaved-caspase 3 [22] |
|||
Abbreviations: Kim-1, kidney injury molecule-1; HO-1, heme oxygenase 1; CYP2E1, cytochrome P450 family 2 subfamily E member 1, NGAL, neutrophil gelatinase-associated lipocalin; IL, interleukin; TNF, tumor necrosis factor; MCP-1, monocyte chemotactic protein 1; MIP-1a, macrophage inflammatory protein-1a. h, Hours; wks, weeks.
Podocytes maintain the filtration barrier in the glomerulus and are also the target of drug-induced nephrotoxicity [45]. Certain drugs have a direct toxic effect on podocytes. For example, puromycin is taken up by podocytes through the plasma membrane monoamine transporter (PMAT; also known as ENT4, encoded by SLC29A4), in contrast to bisphosphonates that cause podocyte injury by destroying the cytoskeleton [46]. Once injured, the podocytes undergo a dedifferentiation process, destroying the glomerular filtration barrier and leading to nephrotic syndrome. The resulting proteinuria can cause secondary renal tubular damage [47].
Induction of inflammatory response in the glomerulus, renal tubular epithelial cells, and surrounding stromal tissue is another drug-induced nephrotoxic mechanism, leading to renal fibrosis or scarring [48]. Glomerulonephritis is an immune-mediated inflammatory renal disorder induced by several drugs (e.g., penicillin and non-steroidal anti-inflammatory drugs) and infectious agents and is associated with proteinuria [49]. Another inflammatory disease, acute interstitial nephritis (AIN), may be an adverse reaction to several drugs such as antibiotics, phenytoin, proton pump inhibitors, allopurinol, lithium, and antiviral drugs, inducing inflammatory, non-dose-dependent responses by causing immunoglobulin deposition in tubule basement membranes [50].
Various drugs and their derivatives are insoluble in urine, which may cause crystals to precipitate in the distal renal tubule lumen, thereby restricting urine flow and triggering cellular reactions in the interstitial sites. Renal insufficiency and insufficient vascular volume increase the risk of crystal nephropathy. The urine drug concentration and the urine pH may affect the precipitation and volume “replenishment of crystals” caused by incompletely soluble drugs. Drugs associated with crystal nephropathy include antiviral drugs (i.e., indinavir and acyclovir) and anticancer agents (methotrexate) [51][52].
The kidneys also harbor a highly diverse endothelial cell population and a microvascular component. Endothelial cells in glomerular and inter-renal vessels are also sensitive to drug-induced damage. Unlike renal tubules, these endothelial cells lack regenerative capacity [53]; therefore, acute damage to the renal vascular system increases patients’ susceptibility to chronic kidney disease [54]. Nephrotoxic agents also directly affect vascular reactivity by regulating endothelial barrier function, coagulation cascade reaction, and/or inflammatory process [55]. Tubular vascular crosstalk occurs through vascular endothelial growth factor A (VEGFA) and its receptor VEGF receptor 2 (VEGFR2) expressed in renal tubular epithelial cells, which are almost completely expressed on peritubular capillary endothelial cells [56]. This interaction is essential for maintaining the peritubular microvascular system. Anticancer drugs targeting the VEGF pathway induce thrombotic microangiopathy, proteinuria, and hypertension [57]. Thrombotic microangiopathies—including thrombocytopenia, microangiopathic hemolytic anemia, and microvascular occlusion—may be immune-mediated and usually result in acute tubular necrosis. Drugs associated with thrombotic microangiopathy include quinine, cyclosporine, and tacrolimus [58].
2. Existing In Vitro Models for Drug-Induced Nephrotoxicity Testing
2.1. Two-Dimensional Culture
Traditionally, two-dimensional (2D) cell cultures are most used as in vitro cell-based studies, which represents a low-cost and robust model in achieving high-throughput screening and well-controlled experimental design. However, the cultured kidney cells on a monolayer in tissue culture plastic containers is not consistent with the in vivo microenvironment. Cells lose important interactions with extracellular matrix proteins and intercellular signals from heterogeneous cell types necessary for normal cellular responses. In addition, 2D culture represents a static model, which becomes less physiological as nutrients are consumed and metabolic waste accumulates.
Primary human renal cells are used because they more closely mimic the renal physiological state. However, these cells have limited growth capacity and tend to lose their original phenotype over time. Despite these limitations, renal cells are still a reliable choice for studying basic renal cell functions and the effects of nephrotoxic agents. To overcome the limitations of culturing primary cells, immortalized cells are frequently employed because they grow and divide indefinitely. The disadvantages of these cells include that the immortalization process itself may cause some changes over time, which can alter the cell’s functional characteristics [59].
Despite attempts to improve 2D culture conditions
| ] |
| [ | |||
| 84 | |||
| ] | |||
| Collecting ducts | Dolichus biflorisagglutinin Aquaporin-2 (AQP2) Aquaporin-3 (AQP3) |
Cadherin 1 GATA Binding Protein 3 Aquaporin-3 |
[23] [84] |
| Endothelial cell | Platelet and endothelial cell adhesion molecule 1 Cadherin 5 Fms related receptor tyrosine kinase 1 Cluster of differentiation 34 Cluster of differentiation 31 |
Platelet and endothelial cell adhesion molecule 1 Cadherin 5 Fms related receptor tyrosine kinase 1 CD34 |
[23] [88] [84] [89] |
| Mesangial cells | Platelet-derived growth factor receptor beta Insulin like growth factor binding protein 5 Transgelin Matrix metallopeptidase 2 |
Actin alpha 2, smooth muscle Collagen type I alpha 1 chain Transgelin |
[23] [90] |
Abbreviations: ABCC1, ATP-binding cassette sub-family C member 1; SLC22A3, Solute carrier family 22 member 3.
4.3. Three-Dimensional (3D) Tissue-Engineered Kidney Model
To provide an in vitro 3D kidney-tissue model, nothing more than the kidney itself can provide a native 3D biological scaffold containing a tubular architecture and all the ECM composition, which can be achieved by decellularization of the kidney and the growing cells in it. However, the diffusion of gas and nutrition are the limiting factors for maintenance of the organ. To solve this problem, Finesilver et al. have developed a 300 μm acellular kidney fragment using a rat kidney on which HK-2 cells were grown. The kidney-derived acellular matrix consisted of different types of proteins (such as collagen types I, III, V, VI, VII, and XV), both sulfated and nonsulfated glycosaminoglycans (GAGs), glycoproteins, and polysaccharides [91]. The ECM compounds promote cell–cell and cell–ECM interactions [92] to form renal tissues. Bonandrini’s group demonstrated that rat kidneys were efficiently decellularized to produce renal ECM scaffolds and rapid recellularization of vascular structures and glomeruli using embryonic stem cells [93]. In addition, the kidney of the Rhesus monkey has been also used as a decellularized scaffold for human PSC cells to investigate the impact of the kidney scaffold on the differentiation of renal cells from PSC cells [94]. Uzarski et al. has perfused the decellularized rat kidney with human renal cortical epithelial cells to develop a kidney in a bioreactor. In these types of systems, the recellularized kidney is connected to the flow via a renal vein and ureter, and perfusion through the vein provides necessary nutrients for the cells [95]. However, the larger the kidney is in size, the more cells are required. The application of animal kidney to gain a renal scaffold and recellularization with human cells might improve a native formation of different kidney sections; however, how these sections or a whole recellularized kidney can be used for different endpoints requires further study.
Hydrogels are being investigated as scaffold biomaterials in renal tissue engineering because they resemble natural soft tissue due to their high water content contributing to biocompatible properties [96]. In addition, the high porosity of hydrogels with a polymer network is beneficial for the exchange of nutrients, gasses, waste products, and signaling molecules with the embedded cells. Many biopolymers are enzymatically degradable in vivo, with most retaining these properties even when chemically altered and crosslinked to produce a hydrogel network [97]. Synthetic hydrogels can be modified to slowly hydrolyze under physiological conditions. Thereby, cells can actively reshape their surroundings, while low molecular weight waste products are safely removed from the body. The nature of the targeted cell environment can be mimicked further through utilizing ECM-based hydrogels or by incorporating biologically relevant cues, e.g., tissue-specific growth factors [98]. A representative example is given by the Khademhosseini group, who used a commercially available steel needle embedded into a gelatin methacrylate scaffold, which was removed after gelation to form a tunnel in the hydrogel with a diameter equal to the outer diameter of the needle [99]. The surface of these tunnels was used for cell seeding via perfusion with a cell suspension. This method has recently been applied in kidney-on-chip developments [100].
References
- Jha, V.; Garcia-Garcia, G.; Iseki, K.; Li, Z.; Naicker, S.; Plattner, B.; Saran, R.; Wang, A.Y.; Yang, C.W. Chronic kidney disease: Global dimension and perspectives. Lancet 2013, 382, 260–272.
- Collins, A.J.; Foley, R.N.; Chavers, B.; Gilbertson, D.; Herzog, C.; Johansen, K.; Kasiske, B.; Kutner, N.; Liu, J.; St Peter, W.; et al. United States Renal Data System 2011 Annual Data Report: Atlas of chronic kidney disease & end-stage renal disease in the United States. Am. J. Kidney Dis. 2012, 59, A1–A7.
- Chen, N.; Chen, X.; Ding, X.; Teng, J. Analysis of the high incidence of acute kidney injury associated with acute-on-chronic liver failure. Hepatol. Int. 2018, 12, 262–268.
- Singbartl, K.; Kellum, J.A. AKI in the ICU: Definition, epidemiology, risk stratification, and outcomes. Kidney Int. 2012, 81, 819–825.
- Perazella, M.A. Drug use and nephrotoxicity in the intensive care unit. Kidney Int. 2012, 81, 1172–1178.
- Mukherjee, K.; Chio, T.I.; Gu, H.; Sackett, D.L.; Bane, S.L.; Sever, S. A Novel Fluorogenic Assay for the Detection of Nephrotoxin-Induced Oxidative Stress in Live Cells and Renal Tissue. ACS Sens. 2021, 6, 2523–2528.
- Khajavi Rad, A.; Mohebbati, R.; Hosseinian, S. Drug-induced Nephrotoxicity and Medicinal Plants. Iran J. Kidney Dis. 2017, 11, 169–179.
- Davis-Ajami, M.L.; Fink, J.C.; Wu, J. Nephrotoxic Medication Exposure in U.S. Adults with Predialysis Chronic Kidney Disease: Health Services Utilization and Cost Outcomes. J. Manag. Care Spec. Pharm. 2016, 22, 959–968.
- Faria, J.; Ahmed, S.; Gerritsen, K.G.F.; Mihaila, S.M.; Masereeuw, R. Kidney-based in vitro models for drug-induced toxicity testing. Arch. Toxicol. 2019, 93, 3397–3418.
- Schetz, M.; Dasta, J.; Goldstein, S.; Golper, T. Drug-induced acute kidney injury. Curr. Opin. Crit. Care 2005, 11, 555–565.
- Pisoni, R.; Ruggenenti, P.; Remuzzi, G. Drug-induced thrombotic microangiopathy: Incidence, prevention and management. Drug Saf. 2001, 24, 491–501.
- Medina, P.J.; Sipols, J.M.; George, J.N. Drug-associated thrombotic thrombocytopenic purpura-hemolytic uremic syndrome. Curr. Opin. Hematol. 2001, 8, 286–293.
- Momper, J.D.; Nigam, S.K. Developmental regulation of kidney and liver solute carrier and ATP-binding cassette drug transporters and drug metabolizing enzymes: The role of remote organ communication. Expert Opin. Drug Metab. Toxicol. 2018, 14, 561–570.
- Kim, J.Y.; Bai, Y.; Jayne, L.A.; Hector, R.D.; Persaud, A.K.; Ong, S.S.; Rojesh, S.; Raj, R.; Feng, M.; Chung, S.; et al. A kinome-wide screen identifies a CDKL5-SOX9 regulatory axis in epithelial cell death and kidney injury. Nat. Commun. 2020, 11, 1924.
- Sancho-Martinez, S.M.; Lopez-Novoa, J.M.; Lopez-Hernandez, F.J. Pathophysiological role of different tubular epithelial cell death modes in acute kidney injury. Clin. Kidney J. 2015, 8, 548–559.
- Mamoulakis, C.; Tsarouhas, K.; Fragkiadoulaki, I.; Heretis, I.; Wilks, M.F.; Spandidos, D.A.; Tsitsimpikou, C.; Tsatsakis, A. Contrast-induced nephropathy: Basic concepts, pathophysiological implications and prevention strategies. Pharmacol. Ther. 2017, 180, 99–112.
- Bajaj, P.; Rodrigues, A.D.; Steppan, C.M.; Engle, S.J.; Mathialagan, S.; Schroeter, T. Human Pluripotent Stem Cell-Derived Kidney Model for Nephrotoxicity Studies. Drug Metab. Dispos. 2018, 46, 1703–1711.
- Morizane, R.; Lam, A.Q.; Freedman, B.S.; Kishi, S.; Valerius, M.T.; Bonventre, J.V. Nephron organoids derived from human pluripotent stem cells model kidney development and injury. Nat. Biotechnol. 2015, 33, 1193–1200.
- DesRochers, T.M.; Suter, L.; Roth, A.; Kaplan, D.L. Bioengineered 3D human kidney tissue, a platform for the determination of nephrotoxicity. PLoS ONE 2013, 8, e59219.
- Balakumar, P.; Rohilla, A.; Thangathirupathi, A. Gentamicin-induced nephrotoxicity: Do we have a promising therapeutic approach to blunt it? Pharmacol. Res. 2010, 62, 179–186.
- Jagdale, P.R.; Dev, I.; Ayanur, A.; Singh, D.; Arshad, M.; Ansari, K.M. Safety evaluation of Ochratoxin A and Citrinin after 28 days repeated dose oral exposure to Wistar rats. Regul. Toxicol. Pharmacol. 2020, 115, 104700.
- Takasato, M.; Er, P.X.; Chiu, H.S.; Maier, B.; Baillie, G.J.; Ferguson, C.; Parton, R.G.; Wolvetang, E.J.; Roost, M.S.; Chuva de Sousa Lopes, S.M.; et al. Kidney organoids from human iPS cells contain multiple lineages and model human nephrogenesis. Nature 2015, 526, 564–568.
- Czerniecki, S.M.; Cruz, N.M.; Harder, J.L.; Menon, R.; Annis, J.; Otto, E.A.; Gulieva, R.E.; Islas, L.V.; Kim, Y.K.; Tran, L.M.; et al. High-Throughput Screening Enhances Kidney Organoid Differentiation from Human Pluripotent Stem Cells and Enables Automated Multidimensional Phenotyping. Cell Stem Cell 2018, 22, 929–940.e4.
- Ding, B.; Sun, G.; Liu, S.; Peng, E.; Wan, M.; Chen, L.; Jackson, J.; Atala, A. Three-Dimensional Renal Organoids from Whole Kidney Cells: Generation, Optimization, and Potential Application in Nephrotoxicology In Vitro. Cell Transplant. 2020, 29, 963689719897066.
- Astashkina, A.I.; Mann, B.K.; Prestwich, G.D.; Grainger, D.W. A 3-D organoid kidney culture model engineered for high-throughput nephrotoxicity assays. Biomaterials 2012, 33, 4700–4711.
- Fedecostante, M.; Westphal, K.G.C.; Buono, M.F.; Sanchez Romero, N.; Wilmer, M.J.; Kerkering, J.; Baptista, P.M.; Hoenderop, J.G.; Masereeuw, R. Recellularized Native Kidney Scaffolds as a Novel Tool in Nephrotoxicity Screening. Drug Metab. Dispos. 2018, 46, 1338–1350.
- Sun, G.; Ding, B.; Wan, M.; Chen, L.; Jackson, J.; Atala, A. Formation and optimization of three-dimensional organoids generated from urine-derived stem cells for renal function in vitro. Stem Cell Res. Ther. 2020, 11, 309.
- Guo, H.; Deng, N.; Dou, L.; Ding, H.; Criswell, T.; Atala, A.; Furdui, C.M.; Zhang, Y. 3-D Human Renal Tubular Organoids Generated from Urine-Derived Stem Cells for Nephrotoxicity Screening. ACS Biomater. Sci. Eng. 2020, 6, 6701–6709.
- Pabla, N.; Dong, Z. Cisplatin nephrotoxicity: Mechanisms and renoprotective strategies. Kidney Int. 2008, 73, 994–1007.
- Elmeliegy, M.; Vourvahis, M.; Guo, C.; Wang, D.D. Effect of P-glycoprotein (P-gp) Inducers on Exposure of P-gp Substrates: Review of Clinical Drug-Drug Interaction Studies. Clin. Pharmacokinet. 2020, 59, 699–714.
- Brown, E.M.; Hewitt, W.R. Dose-response relationships in ketone-induced potentiation of chloroform hepato- and nephrotoxicity. Toxicol. Appl. Pharmacol. 1984, 76, 437–453.
- Asif, S.; Mudassir, S.; Toor, R.S. Histological Effects of Nigella Sativa on Aspirin-Induced Nephrotoxicity in Albino Rats. J. Coll. Physicians Surg. Pak. 2018, 28, 735–738.
- Imaoka, T.; Kusuhara, H.; Adachi-Akahane, S.; Hasegawa, M.; Morita, N.; Endou, H.; Sugiyama, Y. The renal-specific transporter mediates facilitative transport of organic anions at the brush border membrane of mouse renal tubules. J. Am. Soc. Nephrol. 2004, 15, 2012–2022.
- Perazella, M.A. Drug-induced acute kidney injury: Diverse mechanisms of tubular injury. Curr. Opin. Crit. Care 2019, 25, 550–557.
- Bakker, R.C.; van Kooten, C.; van de Lagemaat-Paape, M.E.; Daha, M.R.; Paul, L.C. Renal tubular epithelial cell death and cyclosporin A. Nephrol. Dial. Transplant. 2002, 17, 1181–1188.
- Betton, G.R.; Kenne, K.; Somers, R.; Marr, A. Protein biomarkers of nephrotoxicity: A review and findings with cyclosporin A, a signal transduction kinase inhibitor and N-phenylanthranilic acid. Cancer Biomark. 2005, 1, 59–67.
- Li, W.; He, W.; Xia, P.; Sun, W.; Shi, M.; Zhou, Y.; Zhu, W.; Zhang, L.; Liu, B.; Zhu, J.; et al. Total Extracts of Abelmoschus manihot L. Attenuates Adriamycin-Induced Renal Tubule Injury via Suppression of ROS-ERK1/2-Mediated NLRP3 Inflammasome Activation. Front. Pharmacol. 2019, 10, 567.
- Klos, C.; Koob, M.; Kramer, C.; Dekant, W. p-aminophenol nephrotoxicity: Biosynthesis of toxic glutathione conjugates. Toxicol. Appl. Pharmacol. 1992, 115, 98–106.
- Romano, G.; Favret, G.; Catone, B.; Bartoli, E. The effect of colchicine on proximal tubular reabsorption. Pharmacol. Res. 2000, 41, 305–311.
- Adler, M.; Ramm, S.; Hafner, M.; Muhlich, J.L.; Gottwald, E.M.; Weber, E.; Jaklic, A.; Ajay, A.K.; Svoboda, D.; Auerbach, S.; et al. A Quantitative Approach to Screen for Nephrotoxic Compounds In Vitro. J. Am. Soc. Nephrol. 2016, 27, 1015–1028.
- Faiz, H.; Boghossian, M.; Martin, G.; Baverel, G.; Ferrier, B.; Conjard-Duplany, A. Cadmium chloride inhibits lactate gluconeogenesis in mouse renal proximal tubules: An in vitro metabolomic approach with 13C NMR. Toxicol. Lett. 2015, 238, 45–52.
- Kumar, S.V.; Er, P.X.; Lawlor, K.T.; Motazedian, A.; Scurr, M.; Ghobrial, I.; Combes, A.N.; Zappia, L.; Oshlack, A.; Stanley, E.G.; et al. Kidney micro-organoids in suspension culture as a scalable source of human pluripotent stem cell-derived kidney cells. Development 2019, 146, dev172361.
- Musah, S.; Mammoto, A.; Ferrante, T.C.; Jeanty, S.S.F.; Hirano-Kobayashi, M.; Mammoto, T.; Roberts, K.; Chung, S.; Novak, R.; Ingram, M.; et al. Mature induced-pluripotent-stem-cell-derived human podocytes reconstitute kidney glomerular-capillary-wall function on a chip. Nat. Biomed. Eng. 2017, 1, 0069.
- Petrosyan, A.; Cravedi, P.; Villani, V.; Angeletti, A.; Manrique, J.; Renieri, A.; De Filippo, R.E.; Perin, L.; Da Sacco, S. A glomerulus-on-a-chip to recapitulate the human glomerular filtration barrier. Nat. Commun. 2019, 10, 3656.
- Paueksakon, P.; Fogo, A.B. Drug-induced nephropathies. Histopathology 2017, 70, 94–108.
- Perazella, M.A.; Markowitz, G.S. Bisphosphonate nephrotoxicity. Kidney Int. 2008, 74, 1385–1393.
- Srivastava, T.; Heruth, D.P.; Duncan, R.S.; Rezaiekhaligh, M.H.; Garola, R.E.; Priya, L.; Zhou, J.; Boinpelly, V.C.; Novak, J.; Ali, M.F.; et al. Transcription Factor beta-Catenin Plays a Key Role in Fluid Flow Shear Stress-Mediated Glomerular Injury in Solitary Kidney. Cells 2021, 10, 1253.
- Naughton, C.A. Drug-induced nephrotoxicity. Am. Fam. Physician 2008, 78, 743–750.
- Frazier, K.S.; Obert, L.A. Drug-induced Glomerulonephritis: The Spectre of Biotherapeutic and Antisense Oligonucleotide Immune Activation in the Kidney. Toxicol. Pathol. 2018, 46, 904–917.
- Moledina, D.G.; Perazella, M.A. Drug-Induced Acute Interstitial Nephritis. Clin. J. Am. Soc. Nephrol. 2017, 12, 2046–2049.
- Markowitz, G.S.; Perazella, M.A. Drug-induced renal failure: A focus on tubulointerstitial disease. Clin. Chim. Acta 2005, 351, 31–47.
- Ding, H.; Li, L.X.; Harris, P.C.; Yang, J.; Li, X. Extracellular vesicles and exosomes generated from cystic renal epithelial cells promote cyst growth in autosomal dominant polycystic kidney disease. Nat. Commun. 2021, 12, 4548.
- Kramann, R.; Tanaka, M.; Humphreys, B.D. Fluorescence microangiography for quantitative assessment of peritubular capillary changes after AKI in mice. J. Am. Soc. Nephrol. 2014, 25, 1924–1931.
- Dunn, K.W.; Sutton, T.A.; Sandoval, R.M. Live-Animal Imaging of Renal Function by Multiphoton Microscopy. Curr. Protoc. Cytom. 2018, 41, 12.9.1–12.9.18.
- Verma, S.K.; Molitoris, B.A. Renal endothelial injury and microvascular dysfunction in acute kidney injury. Semin. Nephrol. 2015, 35, 96–107.
- Dimke, H.; Sparks, M.A.; Thomson, B.R.; Frische, S.; Coffman, T.M.; Quaggin, S.E. Tubulovascular cross-talk by vascular endothelial growth factor a maintains peritubular microvasculature in kidney. J. Am. Soc. Nephrol. 2015, 26, 1027–1038.
- Lameire, N. Nephrotoxicity of recent anti-cancer agents. Clin. Kidney J. 2014, 7, 11–22.
- Al-Nouri, Z.L.; Reese, J.A.; Terrell, D.R.; Vesely, S.K.; George, J.N. Drug-induced thrombotic microangiopathy: A systematic review of published reports. Blood 2015, 125, 616–618.
- Bajaj, P.; Chowdhury, S.K.; Yucha, R.; Kelly, E.J.; Xiao, G. Emerging Kidney Models to Investigate Metabolism, Transport, and Toxicity of Drugs and Xenobiotics. Drug Metab. Dispos. 2018, 46, 1692–1702.
- Brown, C.D.; Sayer, R.; Windass, A.S.; Haslam, I.S.; De Broe, M.E.; D’Haese, P.C.; Verhulst, A. Characterisation of human tubular cell monolayers as a model of proximal tubular xenobiotic handling. Toxicol. Appl. Pharmacol. 2008, 233, 428–438.
- Tasnim, F.; Zink, D. Cross talk between primary human renal tubular cells and endothelial cells in cocultures. Am. J. Physiol. Renal. Physiol. 2012, 302, F1055–F1062.
- Astashkina, A.I.; Mann, B.K.; Prestwich, G.D.; Grainger, D.W. Comparing predictive drug nephrotoxicity biomarkers in kidney 3-D primary organoid culture and immortalized cell lines. Biomaterials 2012, 33, 4712–4721.
- Barre-Sinoussi, F.; Montagutelli, X. Animal models are essential to biological research: Issues and perspectives. Future Sci. OA 2015, 1, FSO63.
- Neves, F.; Abrantes, J.; Almeida, T.; de Matos, A.L.; Costa, P.P.; Esteves, P.J. Genetic characterization of interleukins (IL-1alpha, IL-1beta, IL-2, IL-4, IL-8, IL-10, IL-12A, IL-12B, IL-15 and IL-18) with relevant biological roles in lagomorphs. Innate Immun. 2015, 21, 787–801.
- Soo, J.Y.; Jansen, J.; Masereeuw, R.; Little, M.H. Advances in predictive in vitro models of drug-induced nephrotoxicity. Nat. Rev. Nephrol. 2018, 14, 378–393.
- Justice, B.A.; Badr, N.A.; Felder, R.A. 3D cell culture opens new dimensions in cell-based assays. Drug Discov. Today 2009, 14, 102–107.
- Langhans, S.A. Three-Dimensional in Vitro Cell Culture Models in Drug Discovery and Drug Repositioning. Front. Pharmacol. 2018, 9, 6.
- Riss, T.; Trask, O.J., Jr. Factors to consider when interrogating 3D culture models with plate readers or automated microscopes. In Vitro Cell. Dev. Biol. Anim. 2021, 57, 238–256.
- Roelants, C.; Pillet, C.; Franquet, Q.; Sarrazin, C.; Peilleron, N.; Giacosa, S.; Guyon, L.; Fontanell, A.; Fiard, G.; Long, J.A.; et al. Ex-Vivo Treatment of Tumor Tissue Slices as a Predictive Preclinical Method to Evaluate Targeted Therapies for Patients with Renal Carcinoma. Cancers 2020, 12, 232.
- Kashaninejad, N.; Chan, W.K.; Nguyen, N.T. Eccentricity effect of micropatterned surface on contact angle. Langmuir 2012, 28, 4793–4799.
- Kashaninejad, N.; Nikmaneshi, M.R.; Moghadas, H.; Kiyoumarsi Oskouei, A.; Rismanian, M.; Barisam, M.; Saidi, M.S.; Firoozabadi, B. Organ-Tumor-on-a-Chip for Chemosensitivity Assay: A Critical Review. Micromachines 2016, 7, 130.
- Esch, E.W.; Bahinski, A.; Huh, D. Organs-on-chips at the frontiers of drug discovery. Nat. Rev. Drug Discov. 2015, 14, 248–260.
- Bhise, N.S.; Ribas, J.; Manoharan, V.; Zhang, Y.S.; Polini, A.; Massa, S.; Dokmeci, M.R.; Khademhosseini, A. Organ-on-a-chip platforms for studying drug delivery systems. J. Control Release 2014, 190, 82–93.
- Polini, A.; Prodanov, L.; Bhise, N.S.; Manoharan, V.; Dokmeci, M.R.; Khademhosseini, A. Organs-on-a-chip: A new tool for drug discovery. Expert Opin. Drug Discov. 2014, 9, 335–352.
- Jang, K.J.; Suh, K.Y. A multi-layer microfluidic device for efficient culture and analysis of renal tubular cells. Lab Chip. 2010, 10, 36–42.
- Jang, K.J.; Mehr, A.P.; Hamilton, G.A.; McPartlin, L.A.; Chung, S.; Suh, K.Y.; Ingber, D.E. Human kidney proximal tubule-on-a-chip for drug transport and nephrotoxicity assessment. Integr. Biol. 2013, 5, 1119–1129.
- Yoo, T.H.; Fornoni, A. Nonimmunologic targets of immunosuppressive agents in podocytes. Kidney Res. Clin. Pract. 2015, 34, 69–75.
- Friedrich, C.; Endlich, N.; Kriz, W.; Endlich, K. Podocytes are sensitive to fluid shear stress in vitro. Am. J. Physiol. Renal. Physiol. 2006, 291, F856–F865.
- Mashanov, G.I.; Nenasheva, T.A.; Mashanova, T.; Maclachlan, C.; Birdsall, N.J.M.; Molloy, J.E. A method for imaging single molecules at the plasma membrane of live cells within tissue slices. J. Gen. Physiol. 2021, 153, e202012657.
- Kirschnick, N.; Drees, D.; Redder, E.; Erapaneedi, R.; Pereira da Graca, A.; Schafers, M.; Jiang, X.; Kiefer, F. Rapid methods for the evaluation of fluorescent reporters in tissue clearing and the segmentation of large vascular structures. iScience 2021, 24, 102650.
- Freedman, B.S.; Brooks, C.R.; Lam, A.Q.; Fu, H.; Morizane, R.; Agrawal, V.; Saad, A.F.; Li, M.K.; Hughes, M.R.; Werff, R.V.; et al. Modelling kidney disease with CRISPR-mutant kidney organoids derived from human pluripotent epiblast spheroids. Nat. Commun. 2015, 6, 8715.
- Wilmer, M.J.; Ng, C.P.; Lanz, H.L.; Vulto, P.; Suter-Dick, L.; Masereeuw, R. Kidney-on-a-Chip Technology for Drug-Induced Nephrotoxicity Screening. Trends Biotechnol. 2016, 34, 156–170.
- Taguchi, A.; Kaku, Y.; Ohmori, T.; Sharmin, S.; Ogawa, M.; Sasaki, H.; Nishinakamura, R. Redefining the in vivo origin of metanephric nephron progenitors enables generation of complex kidney structures from pluripotent stem cells. Cell Stem Cell 2014, 14, 53–67.
- Schutgens, F.; Rookmaaker, M.B.; Margaritis, T.; Rios, A.; Ammerlaan, C.; Jansen, J.; Gijzen, L.; Vormann, M.; Vonk, A.; Viveen, M.; et al. Tubuloids derived from human adult kidney and urine for personalized disease modeling. Nat. Biotechnol. 2019, 37, 303–313.
- Yoshimura, Y.; Taguchi, A.; Tanigawa, S.; Yatsuda, J.; Kamba, T.; Takahashi, S.; Kurihara, H.; Mukoyama, M.; Nishinakamura, R. Manipulation of Nephron-Patterning Signals Enables Selective Induction of Podocytes from Human Pluripotent Stem Cells. J. Am. Soc. Nephrol. 2019, 30, 304–321.
- Breiderhoff, T.; Himmerkus, N.; Stuiver, M.; Mutig, K.; Will, C.; Meij, I.C.; Bachmann, S.; Bleich, M.; Willnow, T.E.; Muller, D. Deletion of claudin-10 (Cldn10) in the thick ascending limb impairs paracellular sodium permeability and leads to hypermagnesemia and nephrocalcinosis. Proc. Natl. Acad. Sci. USA 2012, 109, 14241–14246.
- Dimke, H.; Desai, P.; Borovac, J.; Lau, A.; Pan, W.; Alexander, R.T. Activation of the Ca2+-sensing receptor increases renal claudin-14 expression and urinary Ca2+ excretion. Am. J. Physiol. Renal. Physiol. 2013, 304, F761–F769.
- Olofsson, B.; Korpelainen, E.; Pepper, M.S.; Mandriota, S.J.; Aase, K.; Kumar, V.; Gunji, Y.; Jeltsch, M.M.; Shibuya, M.; Alitalo, K.; et al. Vascular endothelial growth factor B (VEGF-B) binds to VEGF receptor-1 and regulates plasminogen activator activity in endothelial cells. Proc. Natl. Acad. Sci. USA 1998, 95, 11709–11714.
- Low, J.H.; Li, P.; Chew, E.G.Y.; Zhou, B.; Suzuki, K.; Zhang, T.; Lian, M.M.; Liu, M.; Aizawa, E.; Rodriguez Esteban, C.; et al. Generation of Human PSC-Derived Kidney Organoids with Patterned Nephron Segments and a De Novo Vascular Network. Cell Stem Cell. 2019, 25, 373–387.e9.
- Hale, L.J.; Howden, S.E.; Phipson, B.; Lonsdale, A.; Er, P.X.; Ghobrial, I.; Hosawi, S.; Wilson, S.; Lawlor, K.T.; Khan, S.; et al. 3D organoid-derived human glomeruli for personalised podocyte disease modelling and drug screening. Nat. Commun. 2018, 9, 5167.
- Bulow, R.D.; Boor, P. Extracellular Matrix in Kidney Fibrosis: More Than Just a Scaffold. J. Histochem. Cytochem. 2019, 67, 643–661.
- Finesilver, G.; Bailly, J.; Kahana, M.; Mitrani, E. Kidney derived micro-scaffolds enable HK-2 cells to develop more in-vivo like properties. Exp. Cell Res. 2014, 322, 71–80.
- Bonandrini, B.; Figliuzzi, M.; Papadimou, E.; Morigi, M.; Perico, N.; Casiraghi, F.; Dipl, C.; Sangalli, F.; Conti, S.; Benigni, A.; et al. Recellularization of well-preserved acellular kidney scaffold using embryonic stem cells. Tissue Eng. Part A 2014, 20, 1486–1498.
- Batchelder, C.A.; Martinez, M.L.; Tarantal, A.F. Natural Scaffolds for Renal Differentiation of Human Embryonic Stem Cells for Kidney Tissue Engineering. PLoS ONE 2015, 10, e0143849.
- Uzarski, J.S.; Su, J.; Xie, Y.; Zhang, Z.J.; Ward, H.H.; Wandinger-Ness, A.; Miller, W.M.; Wertheim, J.A. Epithelial Cell Repopulation and Preparation of Rodent Extracellular Matrix Scaffolds for Renal Tissue Development. J. Vis. Exp. 2015, 102, e53271.
- Kharkar, P.M.; Kiick, K.L.; Kloxin, A.M. Designing degradable hydrogels for orthogonal control of cell microenvironments. Chem. Soc. Rev. 2013, 42, 7335–7372.
- Van Vlierberghe, S.; Dubruel, P.; Schacht, E. Biopolymer-based hydrogels as scaffolds for tissue engineering applications: A review. Biomacromolecules 2011, 12, 1387–1408.
- Lee, K.; Silva, E.A.; Mooney, D.J. Growth factor delivery-based tissue engineering: General approaches and a review of recent developments. J. R. Soc. Interface 2011, 8, 153–170.
- Nichol, J.W.; Koshy, S.T.; Bae, H.; Hwang, C.M.; Yamanlar, S.; Khademhosseini, A. Cell-laden microengineered gelatin methacrylate hydrogels. Biomaterials 2010, 31, 5536–5544.
- Jansen, K.; Schuurmans, C.C.L.; Jansen, J.; Masereeuw, R.; Vermonden, T. Hydrogel-Based Cell Therapies for Kidney Regeneration: Current Trends in Biofabrication and In Vivo Repair. Curr. Pharm. Des. 2017, 23, 3845–3857.
More