AuIn thorsis study, we analyzed the mechanism and the process of fungal-induced agarwood formation in Aquilaria sinensis and studied the functional changes in the xylem structure after the process. The microscopic structure of the white zone, transition zone, agarwood zone, and decay zone xylem was studied. The distribution of nuclei, starch grains, soluble sugars, sesquiterpenes, fungal propagules, and mycelium in xylem tissues was investigated by histochemical analysis. The results show that the process of agarwood formation was accompanied by apoptosis of parenchyma cells such as interxylary phloem, xylem rays, and axial parenchyma. Regular changes in the conversion of starch grains to soluble sugars, the production of sesquiterpenoids, and other characteristic components of agarwood in various types of parenchyma cells were also observed. The material transformation was concentrated in the interxylary phloem, providing a structural and material basis for the formation of agarwood. It is the core part of the production of sesquiterpenoids and other characteristic products of agarwood.
- agarwood formation
- xylem structure
- parenchyma cells
1. Introduction
2. Macrostructural Differences at Different Zones of the Xylem
3. Observation on the Nucleus of Parenchyma Cells in the Xylem of A. sinensis
4. Distribution of Sugars in the Xylem of A. sinensis
3.4. Distribution of Sesquiterpenoids in the Xylem of A. sinensis
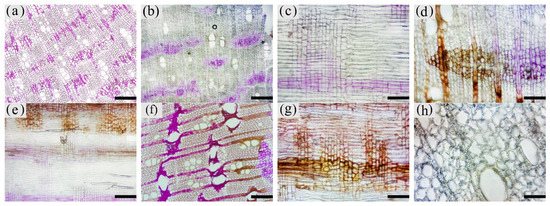
The color development of each zone is shown in Figure 10. From the top left to the bottom right are the white zone, transition zone, agarwood zone, and decay zone in Figure 10a. The statistics of color development are shown in Figure 11.
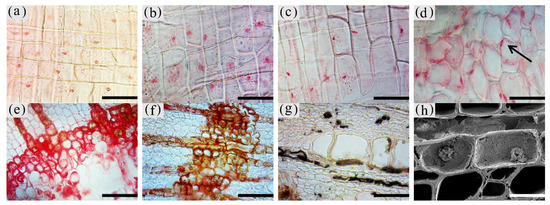
Figure 10. Color development of sesquiterpenoids in parenchyma cells of xylem of A. sinensis. (a) Color development of each zone in the transverse surface. (b) Vessel containing inclusions in the transverse surface of white zone. (c) Transverse surface of transition zone. (d) Radial surface of transition zone. (e) Transverse surface of agarwood zone. (f) Radial surface of agarwood zone. (g) Transverse surface of decay zone. (h) Transverse surface of decay zone, the edges of the undecayed interxylary phloem at the arrows are showing color. Scale bars = (a, g) 500 μm; (b, e–f) 50 μm;(c, d, h) 200 μm.
The blank control had no coloration, which was similar to the white zone. No coloration of parenchyma cells was observed in the white zone (Figure10a). However, some of the vessels were reddish-brown (Figure 10b). In the transition zone, it was observed that some parenchyma cells were stained red, with the largest area of 52.46% for the axial parenchyma, followed by 47.87% for the xylem rays, and 48.50% the interxylary phloem. The total colored area of parenchyma cells was 46.36%. As shown in Figure 10c, the xylem rays and interxylary phloem in the transverse surface were yellowish-brown on the outside and reddish-brown on the inside adjacent to the agarwood zone. This indicated a gradual increase in sesquiterpenes from outside to inside (Figure 10d). As shown in Figure 10e,f, the interxylary phloem, xylem rays, and axial parenchyma cells in the agarwood zone were almost red. The interxylary phloem showed the largest color area of 85.76%, followed by the axial parenchyma. The xylem rays showed the least color with 83.14%, and the total color area of parenchyma cells with 84.61%. In the decayed zones, some parenchyma cells were red. Most of the cells within the decayed area showed no color (Figure 10g), and only some of the incompletely decayed interxylary phloem were red (Figure 10g). The interxylary phloem showed the largest color area (8.96%), followed by the xylem rays (3.43%), and the axial parenchyma (2.09%). The total color area of parenchyma cells was 6.42%. In contrast, the sesquiterpene content of 18 months of inoculation in A. sinensis was higher than that in 12 months of inoculation.
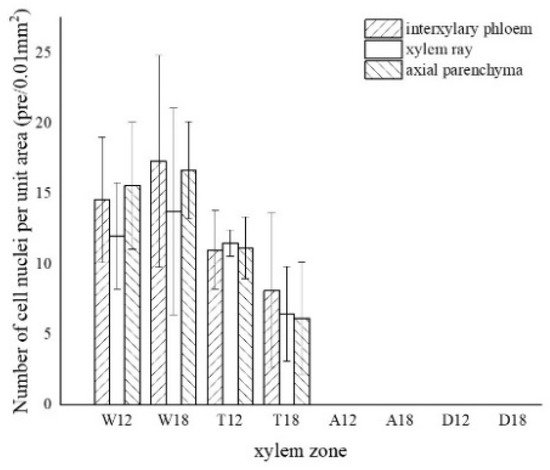
Figure 11. Color development statistics of sesquiterpenes in parenchyma cells of xylem of A. sinensis. W—white zone; T—transition zone; A—agarwood zone; D—decay zone; 12—inoculated for 12 months; 18—inoculated for 18 months.
3.5. Production of Inclusions in the Xylem of A. sinensis Parenchyma Cell
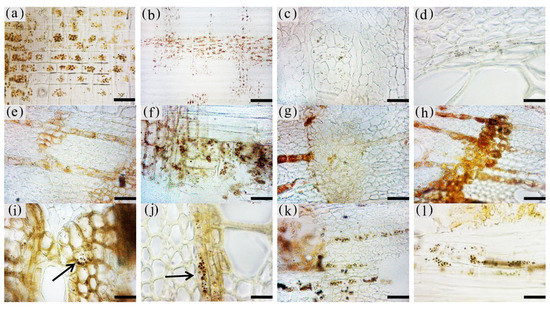
The inclusions in the xylem cells of A. sinensis were divided into two categories: invaginations and gums. Inclusions were often absent in the various cell types of the blank control and the white zone. However, granular starch grains were observed in the parenchyma cells (Figure 12a), and smooth cell walls and clear pores were observed (Figure 12b). In the transition zone, inclusions appeared in the parenchyma cells. The inclusions filled the cells and entered the adjacent cells through the grain (Figure 12c). Precipitates were visible on the cell walls, globular invaginations appeared in the cells (Figures 10e and 12f), and gums that adhered to each other in the shape of spherical droplets began to appear. These greasy substances existed in some xylem rays and vessels (Figure 12d). There was a higher accumulation of inclusions in the decay zone and in the interxylary phloem, than in the xylem rays and axial parenchyma, which made them darker. The parts of the interxylary phloem that were connected to the xylem rays were darker, and the remainder of the interxylary phloem was lighter (Figure 12j). There was also an accumulation of inclusions in some of the fibers (Figure 12k). SEM showed that the starch grains in the parenchyma cells were almost completely dissolved and that the interxylary phloem contained a large accumulation of inclusions (Figure 12g,h). The xylem rays and axial parenchyma in the decay zone were full of inclusions (Figure 12i). The grains were not visible, some of the interxylary phloem was decayed, inclusions were present only in the living cells, and no inclusions remained in the vessels (Figure 12l).
Figure 12. Accumulation of inclusions in parenchyma cells of xylem of A. sinensis. (a) Radial surface of white zone, with starch grains in wood rays and no inclusions. (b) Grain of xylem rays in white zone, with no inclusions. (c) Grain of xylem rays in transition zone, with inclusions. (d) Transverse surface of transition zone, with the resin in the xylem rays and vessels. (e,f) Xylem rays of transition zone, (f) is a partial enlargement of (e), and the arrow in (e) shows the invaginations. (g) Interxylary phloem of transverse surface in the agarwood zone, with large amounts of inclusions. (h,i) Transverse surface of agarwood zone, (g) is a partial enlargement of (h). (i) Transverse surface of decay zone, with large amounts of inclusions in the xylem rays. (j) Interxylary phloem of transverse surface in the agarwood zone: arrow is darker here than in other areas. (k) Fibers containing inclusions in the transverse surface of the agarwood zone. (l) Partially decayed interxylary phloem in the transverse surface of the decay zone. Scale bars= (a) 15 μm; (b,c), (f) 2 μm; (d) 40 μm; (e,h–i) 10 μm; (g) 35 μm; (j,l) 200 μm; (k) 50 μm.
3.6. Distribution and Morphology of Fungal Hyphae and Propagules in the Xylem of A. sinensis
The fungal hyphae in the xylem of A. sinensis were branched. The main hyphae were 3–4 μm wide, and the branched hyphae were approximately 1.5 μm wide. Both had a smooth surface (Figure 13a) and spread axially (Figure 13b) [27]. The propagules were dark brown and ellipsoidal, with a long axis of 3–4 μm and a short axis of 1–3 μm (Figure 13c).
No fungal propagules or mycelia were observed in the blank control and the white zone. Very few branched mycelia were present in the wood rays of the transitional zone (Figure 13i). An insignificant number of fungal propagules or mycelia were distributed in parenchyma cells such as xylem rays (Figure 13j) in the agarwood zone. However, a considerable number of inclusions were attached to the surface of the mycelium (Figure 13k). In the decay zone, a considerable number of oval fungal propagules were observed in the axial parenchyma, xylem rays (Figure 13d), interxylary phloem (Figure 13e), and vessels (Figure 13f). The mycelia of the decay zone were widely distributed in all tissues. Mycelia were present in xylem rays (Figure 13l), axial parenchyma, interxylary phloem, and fibers (Figures 13n and 13m). The interior of the interxylary phloem in the decay zone contained a significant amount of fungi, and there was no longer an intact cell form (as in Figure 13g). The vessels were filled with mycelia (Figure 13h), and the branched hyphae expanded into adjacent cells through the grains in the cell wall (Figure 13o arrow). Mycelial fusion occurred at the point of contact between the branching mycelium and the main mycelium (as shown in Figure 13p arrow), forming a mycelial network in the xylem [28]. There was no significant difference in the distribution of 12 and 18 months of inoculation in A. sinensis.
The degree of fungal accumulation varied widely among zones and there was a decreasing trend from the inside to the outside [29]. This phenomenon may be attributed to two factors. First, the agarwood resin blocked vessels and various types of parenchyma cells, preventing the outward expansion of hyphae, also called the physical defense of the tree. Second, sesquiterpenes and other characteristic products of agarwood have antibacterial properties and can inhibit the growth of fungi, which is also known as the chemical defense of the tree [30,31].
Figure 13. Distribution of fungal propagule and hypha in parenchyma cells and vessel. (a) Mycelial morphology of the xylem. (b)Type of mycelial dispersal. (c) Fungal propagule morphology. (d) Fungal propagules in xylem rays of decay zone. (e) Fungal propagules in the interxylary phloem of decay zone. (f) Fungal propagules in the vessel of decay zone. (g) Transverse surface of decay zone, mycelium distributed in xylem rays and axial parenchyma, with the decayed interxylary phloem at the arrow. (h) Fungal hypha in vessel of radial surface which in decay zone. (i) Fungal hypha in xylem rays of radial surface which in transition zone, with mycelium at arrows. (j, k) Transverse surface of agarwood zone, inclusions and mycelium in xylem rays, with mycelium at arrows. (l) Fungal hypha in xylem rays of radial surface which in decay zone. (m, n) Fungal hypha in fiber of transverse surface which in decay zone, n is a partial enlargement of m. (o) Branching hyphae infect adjacent cells through the pit. (p) Xylem rays of radial surface which in decay zone-the arrow shows the mycelium fusion between the branching mycelium and the main mycelium. Scale bars= (a,d–f), (h) 50 μm; (b) 100 μm; (c,i,n) 10 μm; (g) 200 μm; (j,l) 15 μm; (k) 4 μm; (m) 35 μm; (o) 3.5 μm; (p) 7 μm.
3.7. Variance Analysis of Factors and Xylem Structure
The homogeneity test was performed on each group of data and the results show that all the homogeneity of the variance was satisfied. One-way ANOVA was then used for significance analysis.
The results of one-way ANOVA of xylem zone, parenchyma cells type and inoculation time with nuclei, starch grains, area of soluble sugar, and sesquiterpene color development in xylem are shown in Table 1. The results show that the xylem zone had an extremely significant variability (p < 0.01) on all of the above parameters. Parenchyma cell type had an extremely significant variability (p < 0.01) on the soluble sugar color area, but not on the number of nuclei, starch grains, nor sesquiterpene color area. Inoculation time had an extremely significant variability (p < 0.01) on the number of nuclei, starch grains, and sesquiterpene color area. The number of nuclei was of significant variability (p < 0.05) by inoculation time, but not on the number of starch grains, area of soluble sugar, nor area of sesquiterpene color development. The results show that xylem zone had the greatest effect on the change of xylem structure among the three factors.
Table 1. One-way ANOVA results (p) of xylem structure with xylem zone, parenchyma cell types, and inoculation times.
|
Parameters |
Xylem Zone |
Parenchyma Cells Type |
Inoculation Times |
|
number of nuclei |
0.000 ** |
0.403 |
0.048 * |
|
number of starch grains |
0.000 ** |
0.592 |
0.947 |
|
soluble sugar color area |
0.000 ** |
0.005 ** |
0.933 |
|
sesquiterpene color area |
0.000 ** |
0.429 |
0.385 |
Note: * significant difference (p < 0.05), ** extremely significant differences (p < 0.01).
LSD comparisons were performed for factors that showed significant differences, while the average value and differences between each group are shown in Figure 14. The results show that the number of nuclei was influenced by two factors, and in terms of xylem zone, it was statistically more significantly different except for the agarwood and decay zone, which were not significant with respect to each other. In terms of inoculation time, 18 months of inoculation was statistically more significant, higher than 12 months of inoculation. The number of starch grains was affected by xylem zone, with the white zone being statistically more significant and higher than the other zones, the transition zone being statistically more significant and higher than the agarwood and decay zones, and not significant between the agarwood and decay zones. Soluble sugars were only affected by the xylem zone, and there was no significant difference between the white zone and transition zone, while they were statistically more significant and higher than the other zones. In terms of parenchyma cells type, the interxylary phloem and axial parenchyma were statistically more significant and higher than the xylem rays. The sesquiterpenes were influenced by the xylem zone, with statistically more significant relationships between all zones.
Figure 14. Differences between each indicator and each factor. (a) Nucleus with xylem zone and inoculation time; (b) starch grains with xylem zone; (c) soluble sugar with xylem zone and tissue types; (d) sesquiterpenoids with xylem zone. Different lowercase letters indicate significant differences between zone; different capital letters in (a) indicate significant differences between inoculation times, and different capital letters in (c) indicate significant differences between tissue types.
- Discussion
4.1. Structural Changes in the Xylem of A. sinensis during Agarwood Formation
Based on the anatomical structure and histochemical analysis on the xylem of A. sinensis, it was found that after injection with the fungal inducers, agarwood was first generated in the pith of the tree. It combined with the wood of the xylem to form the agarwood zone, which spread outward with the agarwood development process. The outermost part of the agarwood zone was adjacent to the transition zone, where the physiological reactions of the agarwood process were concentrated. The white zone had not started to produce agarwood. As agarwood formation accelerated, the conducting tissue in the central part of the trunk was completely blocked by agarwood resin, resulting in the death of all types of cells in the area due to lack of nutrients and water [32]. The presence of more fungi in this area accelerated cell death and nutrient depletion. The tree gradually rotted and formed a decay zone.
By exploring the role of various tissues in the formation of agarwood, it was observed that agarwood resin was first produced in the interxylary phloem, then spread outward through the xylem rays and production continued in the outer interxylary phloem. As the accumulation of agarwood resin increased it appeared in the vessels and wood fibers adjacent to the parenchyma cells. The resin attached to the vessel walls and diffused through the paired pits to the adjacent vessels. Resin in the vessels diffused axially to the upper and lower ends.
Serial sections were made on the transverse section of the xylem of agarwood-bearing A. sinensis, and the changes of various indexes were counted (Figure 15). It was discovered that the starch content decreased sharply whereas the soluble sugar content increased and then decreased, accompanied by the generation of sesquiterpenoids. The content of secondary metabolites, such as sesquiterpenes, increased gradually with the expansion of the agarwood. In this process, a transformation from starch grains to soluble sugars occurred in parenchyma cells, which also implied a transformation of storage nutrients to nutrients that can participate in physiological reactions [22]. The reduction in starch, variation in soluble sugar content and presence of sesquiterpenoids suggest that the parenchyma cells enhanced physiological functions spontaneously after external stress, thereby converting starch, soluble sugar, and other stores into large amounts of extracts [33]. These extracts combined with the xylem of A. sinensis to form agarwood, and the results were the same as those reported by Xingli Zhang [34].
Figure 15. Trends of various indicators in xylem of agarwood-bearing A. sinensis.
4.2. Relationship between Fungi and Inclusions Production
Fungal induction caused the production of inclusions such as agarwood resin in A. sinensis [11,35]. The distribution of hyphae, inclusions, and sesquiterpenes in various types of cells was compared. It was found that the fungi entered the tree and moved axially along the vessels and radially along the xylem rays to accumulate and induce agarwood production in the interxylary phloem and xylem rays. Infestation of A. sinensis by fungi induced a local necrotic response in near tissues, which promotes the accumulation of callose in response to plant adversity stress. The deposition of callose can alter the transport function of the sieve duct and also change the osmotic potential of cells and solutions, resulting in the change of water content in the cells, creating an environment where fungal growth is inhibited [36].
SEM of the areas where hyphae and inclusions existed found that the decay zone contained significant amounts of hypha but insignificant amounts of inclusions. This showed that inclusions and fungal hyphae did not coexist. Therefore, the agarwood resin was not the direct product of fungal growth and reproduction in the xylem of A. sinensis but may be the product of a defense mechanism activated by the tree as a result of fungal induction [33]. Some studies have shown that the occurrence of terpenoids, such as sesquiterpenes, monoterpenes, and diterpenes was closely related to fungal diversity, which was a primary determinant of agarwood properties [37].
Some of the dominant species in the fungal inducers we used belonged to endophytic fungi, and experiments showed that unprocessed A. sinensis also had the presence of these fungi [38]. A large number of forestry practices have shown that unprocessed A. sinensis cannot produce agarwood, but inoculation with endophytic fungi enables it to produce agarwood. That means that the mere presence of the original endophytic fungi in the tree without inoculation does not lead to agarwood formation. In a previous study, we found that drilling without the injection of the fungal also did not lead to agarwood formation. Thus, we believe that, in this experiment, the synergistic effect of fungi and drilling is the key to producing agarwood.
The fungal inducers used in this experiment came from wild A. sinensis, which had a high yield of agarwood. These fungal species have been shown in experiments to have better agarwood production effects. In the following experiments, these fungi will be isolated and inoculated, Whereafter, experiments on single fungal specie and mixed fungal species will be conducted, expecting to research fungal species or combinations for better agarwood formation.
4.3. Structural Differences of Different Induction Methods
In terms of macrostructure, the agarwood obtained by the physical trauma is concentrated near the wound, and the agarwood formation area is limited and shaped into thin layers or bundles. The chemical induction can obtain a larger area of agarwood, instead of concentrating only around the injection hole, while the agarwood area is blocky. To some extent, the area of agarwood formation reflected the degree of accumulation of secondary metabolites in the process of exogenous substances-induced agarwood formation and was directly related to the quality of agarwood formation and volatile oil content [39]. In terms of microstructure, the agarwood obtained by the physical trauma is able to fill the entire cell cavity, while the agarwood resin obtained by the chemical induction is usually attached to the cell wall and does not fill the entire cell cavity [20,22].
The fungal induction has obvious advantages over the physical and chemical induction in that the agarwood is not only formed around the injection hole but almost around the whole tree. In addition, the agarwood can fill the entire cell, thus obtaining a large continuous area of agarwood. In agarwood production, these advantages are even more evident. Larger areas of agarwood allow for higher yields, and more continuous agarwood allows for more complete and pure agarwood.
Compared with chemical induction, fungal induction has a higher success rate in producing agarwood. The fungi used in the experiment were mostly endophytes of A. sinensis that did not destroy the original microbial community structure in the tree. Therefore, almost no A. sinensis died during the agarwood formation. In addition, A. sinensis inducted by fungal had no chemical residue after harvesting, which makes it safer when used in medicine and everyday products.
4.4. Differences in Xylem Structure at Different Inoculation Times
By ANOVA, we found that the time of inoculation was only extremely significantly different in terms of the number of nuclei. This extremely significant difference may be explained by the fact that secondary metabolites acted to resist fungal infestation from 12 to 18 months, which allowed the tree to recover some vitality. In the previous study, we found that there were fewer fungal abundances in the xylem of A. sinensis inoculated for 18 months than inoculated for 12 months, also confirming the suspicion. The time of inoculation did not affect the variation tendency of sesquiterpene content, which means there was no difference in the active ingredients of the agarwood produced by 12 and 18 months of inoculation with A. sinensis.
In our previous study, we found that the alcohol-soluble extract of the samples inoculated at 12 months was higher. The total relative content of sesquiterpenes and chromones was the same as at 18 months of treatment [25]. It means that the quality of agarwood was higher at 12 months after inoculation compared to 18 months. In terms of time cost, harvesting A. sinensis at 12 months after inoculation could yield higher economic value and higher production efficiency. Therefore, we believe that in production practice, A. sinensis artificially inducted by fungal inducers have the best agarwood formation effect at 12 months after inoculation.
- Conclusions
- The interxylary phloem was significantly related to cell extinction, sugar conversion, and generation of characteristic agarwood products during agarwood formation. Among all types of parenchyma cells, the interxylary phloem had the fastest response to the agar-wood process and was the first region of agarwood generation;
- Compared with the 12 months of inoculation in sinensis, the xylem of the 18 months of inoculation was more vigorous. There were no significant differences between the 12 and 18 months of inoculation in terms of sugars and agarwood characteristic products. In production, harvesting after 12 months of inoculation can improve harvesting efficiency;
- The fungus entered the sinensis, expanded outward along the vessels and xylem rays, aggregated in the interxylary phloem and xylem rays, and induced the production of agarwood. In agarwood-bearing trees, fungal propagules and hyphae were mainly distributed in the decay zone.