The food consumed and the household size determine the land requirement for food. Continued population growth without improved living standards and adequate food production output per hectare will further exacerbate food insecurity and land shortage in Nigeria.
- food quantity
- food expenditure
- household size
- population
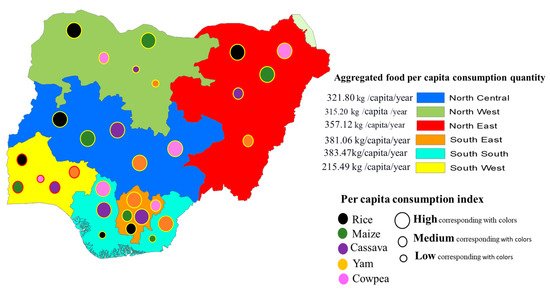
- Geopolitical Zones in Nigeria
1. Introduction
Consumption of staple foods such as rice, maize and cassava is very high in low- to middle-income countries [1][2][3][4][14,18,19,20], while middle- to higher-income countries are consuming fewer staple foods and changing their consumption patterns towards more meat, processed foods and dairy products [1][5][6][7][14,21,22,23]. However, changes in dietary patterns are influenced by per capita income, lifestyle/preferences, urbanization and economic development [1][8][9][10][11][12][13][14][15][14,24,25,26,27,28,29,30,31], resulting in a high demand for land resources [14][30] to cope with the diverse food consumptions. Such changes in dietary patterns are also known to increase greenhouse gas emissions, impact the climate, contribute to unbalanced dietary intake and health-related diseases, as well as further increasing pressure on ecosystem carrying capacity and land degradation [16][17][18][19][20][21][22][32,33,34,35,36,37,38]. Besides, the total land required for food is determined by the type of food, the quantities consumed and the size of the population [23][39]. Available studies state that the type of food determines the land requirement for food [23][39] more than the quantities of food consumed per capita [24][40], while others assume that the land requirement for food also depends on the yield per hectare [25][41]. An example of this is the fact that an average Indian diet requires less land than an average diet in the United States of America, despite the size of the population [24][40].
Land requirements for food have been analyzed at global, regional [26][27][42,43], country and rural levels [25][28][29][30][31][41,44,45,46,47] using models and thought experiments such as ALBIO (Agricultural Land use and BIOmass), the Human Appropriation of Land for Food (HALF) Index, questionnaires, household food consumption surveys, data on population, dietary habits and crop yields. Their studies concluded that our food choices affect the land used for agriculture, i.e. the land required for food depends on the type of food and the rate of change in food consumption patterns. However, this interaction is causing biodiversity to decline at an accelerating rate.
2. Food Consumption Patterns
2.1. Food Consumption Patterns at the National Level
2.2. Food Consumption Patterns in the Six Geopolitical Zones
3. Findings
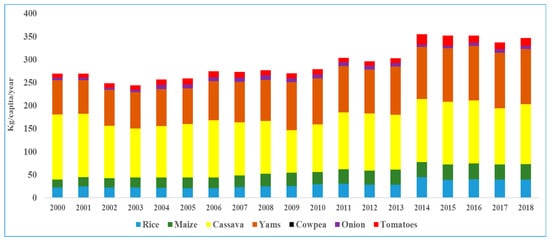
Food consumption patterns in the six geopolitical zones show that cereals and starchy roots contribute significantly (over 70%) to household calorie requirements. Available studies have shown that developing countries rely on starchy staple foods to meet their energy needs. For example, a similar observation was made in the city of Guyuan in Northwest China that the energy needs of the population are met by staple foods [28][44].
The quantity of household food consumption was estimated from household food expenditure and food prices. Therefore, the share of total household expenditure (as a proxy of income) spent on food is an indicator of household food security, and low-income households spend more of their income on providing food [32][65]. The Nigeria National Bureau of Statistics revealed that 59.19% was the total expenditure on food in 2019 by households in Nigeria [33][66].
The food consumption pattern results indicate that households are changing their dietary patterns due to their high food expenditures. This is observed in the North East and North West, indicating that the two zones are shifting their consumption patterns from rice to maize as a cheaper alternative, likewise in the South East and South South, consuming more dense calories from cassava and yam than rice and maize. Additionally, an interesting observation is that the South West consumes more cereals, especially rice, than its southern counterparts. A plausible reason for this is that the South West have more rice-producing states [34][68], which may have influenced the price of rice to be relatively cheaper than in other parts of the country. The North Central zones also consume more amount of cereals and starchy roots as they have the latitude to produce these crops [35][69].