2. Solar Power Plants in Iran
Iran has an extensive fossil source, and most of its power plants run on oil and gas. In recent years, environmental pollution has occurred in large cities like Tehran, Tabriz, and Isfahan. Also, with the expansion of industry and agriculture in Iran, the need for electricity is expanding. There is a shortage of electricity in the big cities of Iran now in the summer. Therefore, the Iranian government has been looking to establish solar power plants to provide electricity to their villages and cities in recent years. At present, the advantages of using clean energy against pollution and the high consumption and environmental costs of fossil fuels have led Iranians to use clean energy and fuel
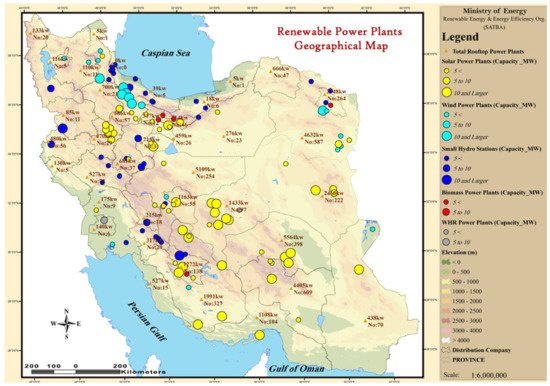
[117,118,119,120,121,122][14][15][16][17][18][19]. The renewable power plants’ geographical map is shown in
Figure 2 [123][20].
Figure 2. Geographical map of renewable power plants
[123][20].
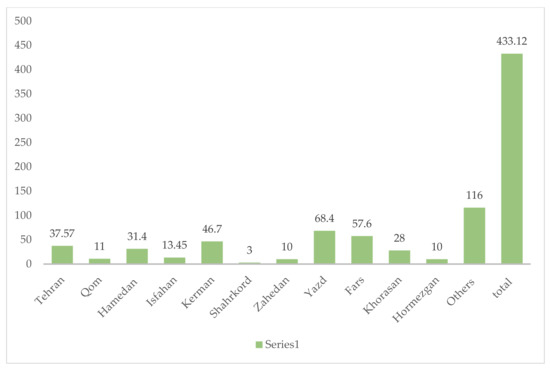
The most significant number of solar power plants are installed in provinces of Kerman (with 4 to 10 MW solar power plants), Yazd (with 5 to 10 MW solar power plants), and Fars (with 7 to 10 MW solar power plants). In recent years, central cities of Iran such as Tehran (about 37.57 MW), Hamedan (about 31.4 MW), and Isfahan (about 13.45 MW) have also designed and built several solar power plants. The amount of power of solar power plants in the provinces of Iran is shown in
Figure 3, where Yazd, Fars, and Kerman provinces with a capacity of 68.5, 98.8, and 54 MW, respectively, are the top provinces producing electricity from energy in Iran
[124][21].
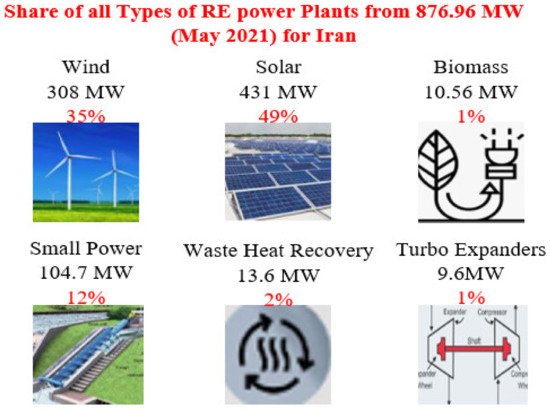
Figure 3. Share of all types of RE power plants
[125][22].
Renewable Energy & Energy Efficiency Organization (SATBA) reported that now 131 renewable power plants on a scale of MW with a total capacity of 876.69 MW have been put into operation. In addition, another 821 MW is under construction. Of these, there are 63 solar power plants with 433 MW and 20 wind power plants with about 308 MW (
Figure 3). The rest of the power plants include small hydropower plants with a total capacity of 104.7 MW, biomass with a total capacity of 10.56 MW, and heat loss recovery from industrial processes with a total capacity of 13.6 MW
[125][22].
As shown in
Figure 4, about 178 million kWh of generated electricity is produced by renewable power plants in June 2021. As it turned out (
Table 1), about 49% of electricity was generated by solar energy
[126,127][23][24]. One of the critical points is that about 4277 thousand tons less CO
2 have been prevented. Moreover, a study of technical and economic assessment of the integrated solar combined cycle power plants in Iran was analyzed by Hosseini et al.
[23][25].
Figure 4. The number of solar power plants in the provinces of Iran
[126][23].
Table 1. Electricity production in June 2021 and the cumulative (until July) in Iran.
Cumulative
(Till July 2021) |
|
June 2021 |
| 6377 |
Generated Electricity from Renewable Energy (RE) (million KWh) |
178 |
| 1811 |
Fossil Fuel Conservation (Million cubic meter natural gas) |
| 0.51 |
Tehran |
Molard |
| 51 |
| 1 |
Arak |
Arak |
1403 |
Water Conservation (million liter) |
39 |
| 4277 |
Prevention CO2 (thousand ton) |
115 |
| 27 |
Prevention of air pollutants (thousand ton) |
0.8 |
Their study showed that increasing steam turbine capacity by 50% and 4% improvement in total efficiency are other advantages of Integrated Solar Combined System with 67 MW solar power plant. In addition, theoretical and technical potential evaluation of solar power generation in Iran was studied by Ghasemi et al.
[128][26]. Their study was about Sistan and Baluchestan provinces, and their results showed that about 14% of the province is suitable for constructing solar power plants.
Electricity generated by solar farms in the cities of Iran is shown in Figure 4. The capacity of large solar farms in Iran is about 433 MW, and the provinces of Yazd, Fars, and Kerman are about 68.4, 57.6, and 46.7 MW of electricity produced by solar farms, respectively.
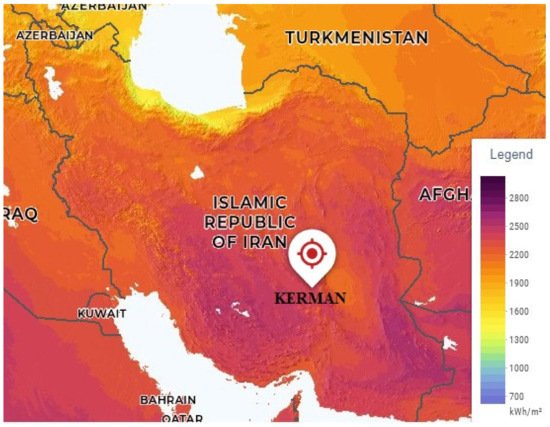
Kerman is the most important city in the southeast of Iran. Due to sunlight on more than 300 days of the year, Kerman province is located in the center of the golden trapezoid of the country’s solar energy, unique natural space. Furthrermore, adequate infrastructure, which is a significant advantage, can make this province a clean energy supply and attract foreign investors
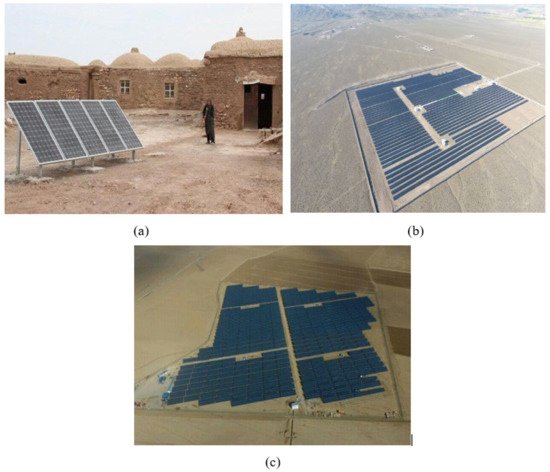
[129,130,131,132][27][28][29][30]. The use of solar plans to meet the needs of Iranian villagers and nomads is increasing. One of the small solar power plants in Kerman can be seen in
Figure 5a
[133][31].
Figure 5. (
a) A small solar plant in Kerman, (
b) an installed PV power plant in Kerman with a 10 MW capacity, and (
c) an installed solar power plant in Hamedan with a capacity of 7 MW
[126][23].
According to the Renewable Energy & Energy Efficiency Organization (SATBA), a 10 MW power plant in Kerman province in Baft was connected to the grid
[134][32]. The power plant is constructed in an area of 20 ha, using specialist and localized equipment by the private sector. It is estimated that by starting this solar plant, 9598 tons of environmental pollutants will be prevented, and 3060 cubic meters of water consumption will be reduced annually. In addition, the power plant will also save 3.95 million cubic meters of natural gas, annually, in Iran’s electricity production
[135,136][33][34]. One of the largest solar power plants in Iran is located in Kerman province (
Figure 5b). Mahan Solar Power Plant is designed to produce 20 megawatts per day. In total, 76,912 solar panels have been installed in this power plant, and about 21,000 bases have been hammered, and the amount of foreign investment in this project is US$27 million. Furthermore, this power plant will be converted to 100 megawatts in the future
[137,138][35][36].
Kerman province has been considered one of Iran’s most proper provinces with the highest solar radiation. Eight solar power plants with a total capacity of 48.7 megawatts have been constructed and are running at the moment. In Kerman province, 926 solar rooftops with a capacity of 8228 kW have been installed
[139][37]. In recent years, much research has been done to evaluate the possibility of electricity generation from solar energy in Kerman province
[140,141,142][38][39][40]. For example, a comprehensive approach to design and improve a solar chimney power plant in Kerman Province was studied by Gholamalizadeh and Mansouri
[143][41]. All large solar power plants in Kerman province are presented in
Table 2.
Table 2. Solar power plants in Kerman province (PV power plant).
| Capacity (MW) |
City |
Solar Plant |
| 100 (Under Construction) |
Bam |
Bam |
| 20 |
Kerman |
Noor Mahan |
| 10 |
Baft |
Baft |
| 1 |
Bardsir |
Arya |
Fars, a province located in the southwest of Iran, has an area of 122,400 km²
[144][42]. The total capacity of renewable and clean power plants in Fars is 84.52 MW, which includes ten solar power plants with a cumulative capacity of 67.6 MW, a biomass power plant with a capacity of 1.065 MW, a wind power plant with a capacity of 0.66 MW, and two hydroelectric power plants with a capacity of 12.25 MW, as well as 331 small scale solar systems (roof) with a cumulative capacity of 2021 kW.
In Fars, there are several solar power plants with a capacity of 10 MW. Moreover, a list of high-power solar power plants in Fars is presented in
Table 3. Renewable energy researchers in Fars are trying to show the people and the government the potential of converting solar energy into electricity
[145,146,147][43][44][45].
Table 3. Solar power plants of Fars province.
| Capacity (MW) |
City |
Solar Plant |
| 20 (Two plants with 10 MW) |
Abadeh |
Abadeh |
| 10 |
Shiraz |
Karno |
| 10 |
Eghlid |
Eghlid |
| 7 |
Hamedan |
Amirkabir |
4 |
Sarvastan |
Sarvastan |
| 10 |
Shiraz |
Lohar |
| 0.25 |
Shiraz |
Shiraz |
In other provinces such as Isfahan, Tehran, Yazd, Hamedan (
Figure 5c), and Khuzestan, a large solar power plant with a maximum capacity of 20 MW has been built.
Table 4 lists several solar power plants in other cities of Iran
[148][46].
Table 4. Installed solar power plants in Iran.
| Capacity (MW) |
City |
Solar Plant |
| 7 |
| Hamedan |
Persian Golf |
| 10 |
Isfahan |
Zarigheh |
| 17 |
Yazd |
Yazd |
| 10 |
Alborz |
Taleghan |
| 10 |
Tehran |
Komord |
| 2 |
Zanjan |
Kohok |
| 7 |
Zanjan |
Abhar |
| 1 |
Isfahan |
Sanat |
| 1 |
Isfahan |
Negar |
| 10 |
Khozestan |
AZIN |
| 5 |
Mashhad |
KHAF |
| 1.5 |
Sharkord |
SIMAN |
Several other researchers across Iran have tried to cover the power consumption of industrial plants by technical and economic studies of various solar power plants
[149,150][47][48]. For example, the techno-economic of PV systems capacity in Shiraz was studied by Yazdani and Yaghoubi
[151][49]. In this analysis, a typical one MW solar plant was made in the software of PVsyst. The economic study displayed that enterprise in a PV system without any particular government help is economically advantageous, as the net present amount and Internal Rate of Return (IRR) were found to be US$1,367,499 and 17.09%, respectively.
A comprehensive study on the applications of different data-driven approaches in the performance modeling of solar units is introduced by Alhuyi Nazari et al.
[152][50]. They are also in other studies on solar energy
[153[51][52],
154], reviews on the applications of multi-criteria decision-making approaches for power plant site selection.
2.1. Case Study (Sirjan City)
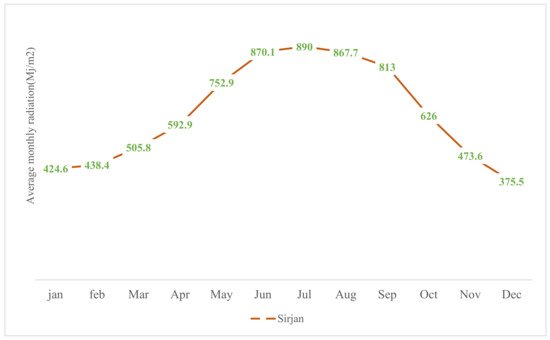
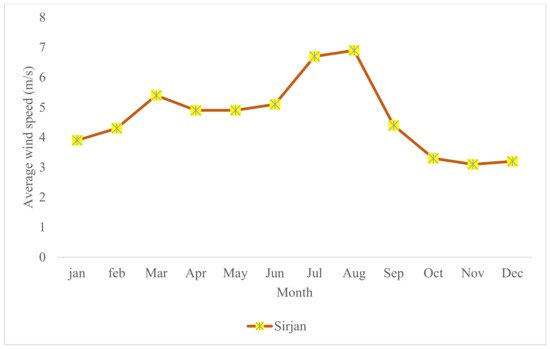
Sirjan is one of the cities of Kerman province, geographically located at 29°6′ N and 58°20′ E, and at 1760 m above sea level. The curves of the solar radiation and wind speed for Sirjan city for each month in 2018 are presented in
Figure 6 and
Figure 7, respectively
[3][53].
Figure 6. Average monthly radiation (MJ/m
2) in Sirjan city
[3][53].
Figure 7. Average wind speed (m/s) in Sirjan city
[3][53].
The following data have been extracted to build a 10 MW-solar power plant in the Balord region of Sirjan. The design location of the solar power plant in Sirjan is shown in Figure 1.
The location must first be examined in terms of solar radiation and wind speed to design a solar power plant. By comparing the amount of wind and the intensity of solar radiation of Sirjan, it has been determined that this city has the potential to invest in the construction of a solar power plant. In this design, 25,000 PV panels with a capacity of 400 watts have been used. About 15 hectares of land are needed to build this solar power plant.
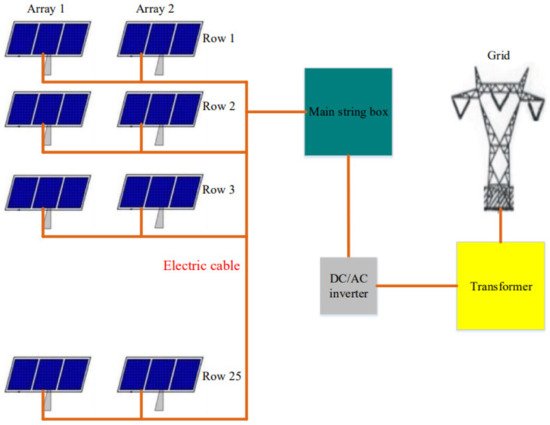
As shown in Figure 8, each array requires 5000 arrays of 50 solar panels. Both arrays are placed next to each other, forming 25 rows in each block. In each block, a 2.5 MW transformer and inverter are used to convert DC to EC.
Figure 8. Layout of a block in 10 MW solar power plant.
2.2. Economic and Technical Study of a 10 MW Power Plant in Sirjan City
In the city of Sirjan, about 1900 to 2000 kWh/m2 solar energy (horizontal global irradiation) is received. The effective irradiance on the solar plant is about 2030 kWh/m2. Therefore, in a 10MW solar power plant in Sirjan, about 20,489 MWh nominal array energy. By calculating of array soloing, module quality, module array mismatch, and inverter loss, this solar power plant can produce 16,047 MWh per year.
To analyze the construction of a 10 MW solar power plant, it is necessary to first extract fixed costs (CAPEX costs) such as land, landscaping, and purchasing equipment. Table 5 shows a 10 MW solar power plant’s fixed cost by examining the Iranian and foreign markets.
Table 5. CAPEX costs of a 10 MW solar power plant.
| Costs |
Total Price (US$) |
| Land |
240,000 |
| Landscaping |
After extracting the fixed costs, about $100,000 is the current cost to build this solar power plant. One of the most important parts is the sale of electricity. At the present time, in the summer, Iran government pays $40.0 per Megawatt.
Considering the 300 sunny days in the city of Sirjan, Table 6 below shows the production capacity of this power plant in each season; according to the sales rate in each season, the annual income of this power plant can be extracted. As shown in Table 6, a 10-megawatt solar power plant sells for about $893,868 a year.
Table 6. Sales cost of a 10 MW solar power plant.
| Season |
Number of Days |
Daily Capacity (MWh) |
Seasonal Capacity (MWh) |
Sales Rate (US$/KWh) |
Sales Cost (US$) |
| Spring |
93 |
66 |
6138 |
0.036 |
220,968 |
| 750,000 |
| Summer |
93 |
80 |
7440 |
0.04 |
297,600 |
| Fall |
90 |
70 |
6300 |
0.036 |
226,800 |
| Winter |
90 |
55 |
4950 |
0.03 |
148,500 |
| Total |
366 |
|
24,828 |
|
893,868 |
The IRR is a measurement utilized in financial analysis to evaluate the profitability of possible investments. IRR is a discount rate that makes the Net Present Value (NPV) of all cash flows equal to zero in a discounted cash flow analysis. The formula and calculation for IRR can be utilized by the following equation:
where
Ct,
C0, and
t are net cash inflow during the period, total initial investment costs, and the number of time periods, respectively.
A preliminary investigation revealed that the cost of purchasing solar panels is about US$10.7 million. Now, by calculating the investment cost and the current cost (such as the cost of power, energy, and maintenance), it is determined that IRR is equal to 21.05. The design information of a 10 MW solar power plant in Sirjan city is given in Table 7.
Table 7. Design information of a 10 MW solar power plant in Sirjan.
| Description |
Unit |
Amount |
| City |
|
Sirjan |
| Longitude |
North |
29°6′ N |
| Construction |
630,000 |
| latitude |
East |
58°20′ E |
Technology, equipment, installation and testing |
10,400,000 |
| Power plant capacity |
Megawatts |
10 |
Facilities |
2,400,000 |
| Area |
square meters |
150,000 |
Unforeseen (10%) |
1,600,000 |
| Pre-operation costs |
120,000 |
| Number of solar panels |
number |
25,000 |
Total |
16,140,000 |
| Dimensions of each panel |
| square meters |
| 2 |
| Cost of purchasing panels |
US$ |
10,700,000 |
| The cost of building a power plant |
US$ |
16,140,000 |
| Purchase price |
US$ |
893,868 |
| IRR |
% |
21.05 |
2.3. Technical Analysis with HOMER
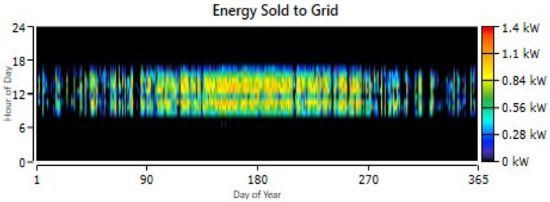
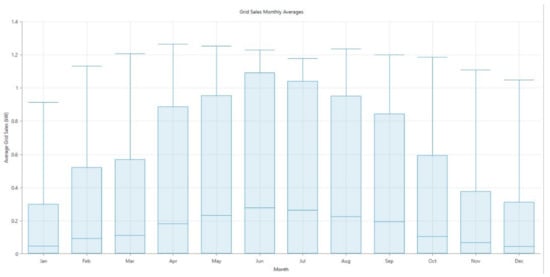
After extracting the costs, this solar system’s technical and economic analysis can be provided using Homer software. Firstly, this design’s discount rate, inflation rate, annual capacity shortage, and project lifetime are 10, 15, 5, and 20, respectively. The amount of electricity production on a daily and monthly basis is shown in Figure 9 and Figure 10. As shown in Figure 9, the highest energy production in this power plant is in spring (starting from the 90th day) and summer (ending on the 270th day). As can be seen in this figure, solar energy production starts at 7 am and continues until 6 pm. Electricity generation in June, July, and August in Sirjan have are the highest, at 1.1, 1.05, and 0.95 KWh, respectively. Furthermore, the average gird sales in different months are shown in Figure 1o.
Figure 9. Daily electricity production in one year in Sirjan.
Figure 10. Monthly electricity production in one year in Sirjan.
