Your browser does not fully support modern features. Please upgrade for a smoother experience.
Please note this is a comparison between Version 2 by Jason Zhu and Version 1 by Christopher Griffin.
Researchers propose a computational framework for quantitatively coalescing transmitter–recipient–virus interactions, pertaining to the genetic system into a hypergraph. Subsequent transmissions of the virus to other individuals lead to the formation of a new genetic system. Our mobile hypergraphs can capture such dynamic changes, equipped with a capacity to decipher how COVID-19 spreads from person to person through close contacts.
- COVID-19
- Genetic
- Statistical
1. Statistical Genetic Physics of COVID-19 Spread
As an infectious disease, COVID-19 shows strong person-to-person transmissibility, whose basic estimated reproductive number is as high as about 2.68 (95% CrI 2.47 to 2.86) [3][1]. Because of this, the efficient and effective control of this disease requires a detailed understanding of the community machinery that mediates transmission and spread. Interpersonal variability has been observed in the pattern and speed at which COVID-19 transmits from person to person in communities. Despite a high number of contacts (372), the first known person-to-person transmission cases did not result in transmission of the virus [50,51][2][3]. In another case, an asymptomatic carrier has been shown to transmit the virus to five family members [21][4]. These findings show that viruses from some carriers are more transmissible than those from others. Indeed, well-controlled epidemiological studies using animal models also documented this phenomenon [51,52][3][5], regarded as being universal in infectious disease contagions. Like the effects they exert on disease severity, genes can also play a critical role in determining interpersonal transmissibility. Conventional genetic analyses can dissect the interpersonal variability of a disease, but they have no power to characterize the genetic mechanisms underlying the interpersonal transmissibility of the disease as a dynamic process.
2. Horizontal Epistasis: An Emerging Concept
Darwin’s evolutionary theory suggests that the phenotype of an individual affects the phenotypes of other individuals in the same community to an extent that drives phenotypic variation and evolution [53,54,55][6][7][8]. Quantitative genetic studies of this phenomenon indicate that the phenotype of one individual is not only determined directly by its own genes but also indirectly by the genes of individuals with whom it co-exists, in an epistatic fashion [56,57,58][9][10][11]. In an association study, Biscarini et al. [59][12] identified a number of loci that exert indirect genetic effects on plumage conditions in laying hens. Genes with indirect genetic effects were also identified to affect size, development, and fitness traits in Arabidopsis [60][13]. Relative to vertical epistasis, described as the effect of the interactions between genes from different genomic locations within the same individual [61][14], researchers define the interaction effects of genes across different individuals as horizontal epistasis. Faced with a viral invasion, a recipient will activate innate and adaptive immune responses through certain genes, e.g., those within the major histocompatibility complex (MHC) locus, to produce specific antibodies that coat viruses and reduce their infection [62[15][16],63], during which the virus will evolve specific strategies, including mutations or methylations, to evade these responses or adapt to the new environment of the recipient [64,65,66][17][18][19]. The pattern and degree of the mutation or the epigenetic alteration of viral genes depend on how they interact with the physiological environment of the recipient. Thus, when this recipient becomes a transmitter, their “personalized” viruses will preferentially attack the next recipient who can provide the essential environment for the viruses to survive. In the case of person-to-person transmission, the viruses serve as a genetic “messenger” that links the transmitter to the recipient unidirectionally and, thus, are regarded as a stimulus that elicits horizontal epistasis. This pattern of interpersonal transmission is essentially the consequence of the joint influences of genes from the transmitters, recipients, and viruses. To systematically characterize the genetic mechanisms underlying the rate and intensity of SARS-CoV-2 spread, researchers need to chart the network of gene interactions among these three parties. In some situations, viruses spread from natural hosts (e.g., animals) to alternative hosts (humans) to form a more complex pandemic network [67][20]. Revealing the mechanisms that lie behind this network includes the characterization of horizontal epistasis among genes from humans, animals, and viruses.
Graph theory has been widely used as a tool to reconstruct gene networks [68,69][21][22]. This approach can only characterize pairwise interactions coded as edges of the graph, with each edge adjacent (connecting) to two nodes. However, the process of person-to-person or animal-to-person transmissions includes genes from more than two genomes and, thus, high-order horizontal interactions are likely to trigger their effects. In the following sections, it is shown that a hypergraph, the generalization of a graph to allow an edge to join more than two nodes [70[23][24],71], can precisely capture how genes from different genomes interact globally with each other to determine the spread of COVID-19.
3. Genetic Hypergraphs
SARS-CoV-2 spreads mainly through person-to-person contacts [1,2[25][26][1][27],3,4], where routes of interpersonal transmission can be retroactively tracked by recording and monitoring contact history [72][28]. A recipient is assumed to be connected to only one transmitter, but a transmitter may have multiple recipients. Let us imagine a spread path as illustrated in Figure 1A, where the first transmitter transforms the virus shared with Recipients 2, 3, 4, and 5, who then become transmitters for subsequent recipients. Now, let us take a step further and assume that researchers can sequence the genomes of these affected individuals, measure their pneumonia-related clinical outcomes, and also screen the genome-wide haploid (epi)genetic alterations of the viruses inhabiting each recipient.
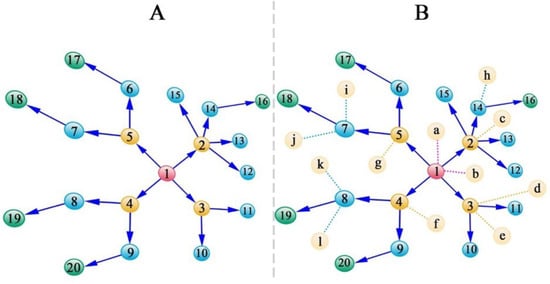
Figure 1. Transmission path of SARS-CoV-2 through contacts. (A) A strategy for sampling transmitters and recipients, the direction of whose transmission is denoted by arrows. (B) A strategy for sampling transmitters and recipients, the direction of whose transmission is denoted by arrows, as well as individuals who are not infected (labeled by letters) even after contact with the transmitters. Numbers in yellow refer to those that transmit the virus to multiple recipients. In a graph, these transmitters are likely to be regarded as hub nodes.
Hypergraphs have been increasingly recognized as a powerful tool to model complex systems, such as cell–cell interactions [71][24] and epidemic propagation [73][29]. Here, researchers develop a genetic version of hypergraphs to model genome–genome interactions. During the SARS-CoV-2 spread, a transmitter passes on the virus to a recipient, forming a small functional triad unit composed of three entities. Researchers argue that such a unit forms a hypergraph in which genes from three genomes represent nodes, pairwise cross-genome interactions define edges, and three-order cross-genome interactions define hyperedges. This interactive unit propagates COVID-19 along reticulate paths to spread into communities. In this sense, the scope of COVID-19 spread can be dissected into a series of dynamically interconnected units. Researchers integrate quantitative genetic theory and hypergraph theory to quantify the pattern and strength of various cross-genome interactions, i.e., horizontal epistasis, displayed in each unit.
Consider a sample of infected individuals from a human population. There are three diploid genotypes at a human single-nucleotide polymorphism (SNP) locus with two alleles and two haploid genotypes at a virus locus. Three transmitter genotypes, three recipient genotypes, and two virus genotypes are randomly combined to form 18 three-way genotype combinations. There is variability in the clinical outcomes of recipients among these combinations. Researchers can partition the genotypic value of a combination for a disease outcome/phenotype, e.g., pneumonia severity, into the following components:
-
Direct main effects of the gene of the recipient on its own phenotype;
-
Indirect main effects of the gene of the transmitter on the phenotype of the recipient;
-
Indirect genetic effect of the virus gene on the phenotype of the recipient;
-
Horizontal two-way epistatic effects between the transmitter gene and recipient gene on the phenotype of the recipient;
-
Horizontal two-way epistatic effects between the virus gene and transmitter gene on the phenotype of the recipient;
-
Horizontal two-way epistatic effects between the virus gene and recipient gene on the phenotype of the recipient;
-
Horizontal three-way epistatic effects among the virus gene, transmitter gene, and recipient gene on the phenotype of the recipient.
Li et al. [74][30] derived a statistical algorithm for estimating and testing each of these effects. Through extensive computer simulation, they further examined the statistical properties of each estimation, which helps researchers design sampling strategies. Researchers model the main effects as nodes, horizontal two-way epistasis effects as edges, and horizontal three-way epistasis effect as a hyperedge into a weighted hypergraph (Figure 2). The difference between such a hypergraph model and the more commonly used graph model lies in its capacity to characterize high-order interactions, i.e., interactions among three or more entities [71][24]. In particular, in the genetic hypergraph, researchers can identify how transmitter–recipient interactions are mediated by SARS-CoV-2.
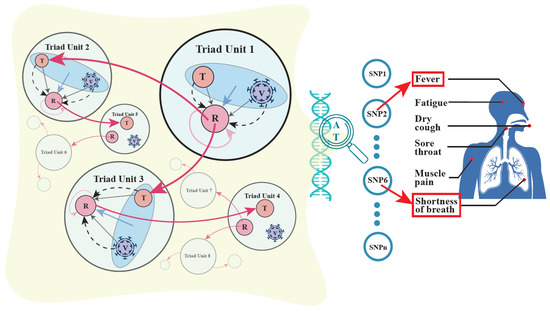
Figure 2. A genome-wide atlas of mobile genetic hypergraphs for COVID-19 spread in human communities. Left panel: Mobile hypergraphs (denoted as 1, 2, 3, …) showing the effects of pairwise and high-order genetic interactions among transmitters (T), recipients (R), and viruses (V). A hypergraph comprises a T-V-R functional triad unit (circled in light blue) that propagates COVID-19 to form an outbreak community. A red cycled arrow from R to R shows the direct genetic effect of R on its own phenotype, a black arrow from V to R shows the indirect genetic effect of the virus on the phenotype of R, and a black arrow from T to R shows the indirect genetic effect of T on the phenotype of R with the aid of the virus as a messenger. The effects of three types of horizontal pairwise epistasis, T × R, R × V, and V × T, on the phenotype of R, are shown by dot curves. Horizontal high-order epistasis is shown by a blue arrow. A unit is linked to the next through an infected person (circled in light red), who serves as a T for the former and an R for the latter. Right Panel: By scanning SNP 1, 2, …, (denoted by open blue circles) throughout the host genome, researchers can identify significant loci (e.g., SNP 2, 6, …) that affect COVID-19 spread and chart a genome-wide atlas of mobile hypergraphs. The model can discern different functions of SNPs, e.g., SNP 2 affects fever, whereas SNP 6 is responsible for the shortness of breath.
If researchers collect the data for the individuals who contacted a transmitter but were not infected (Figure 1B), researchers can develop a binary model to test how genes play a role through hypergraphs in determining whether the recipients are infected. Results from this model would in turn allow us to identify specific genes that would determine the possibility of infection. A hypergraph representation can reflect both the importance of genes triggering such effects and the context dependency, in terms of how this is affected by genes from other entities. From this hypergraph, researchers can also characterize genetic effects, direct or indirect, horizontal two-way or horizontal three-way epistasis, as major determinants of infection.
The estimates of the magnitudes of each of these types of genetic effects may help to design more efficient drugs to control the spread of SARS-CoV-2. If direct genetic effects are significant, a drug should be designed with the capacity to directly target the genes of the recipients. If indirect genetic effects from the transmitters are significant, a drug that targets the transmitters’ genes can decrease or prevent the spread of the virus to other recipients. If indirect genetic effects from SARS-CoV-2 are significant, the viruses should be targeted. If two-way horizontal epistasis between the transmitters and recipients is significant, researchers need to design a drug that can decouple the transmitter–recipient genetic interaction expressed at specific loci. The existence of any three-way horizontal epistasis implies the importance of designing a drug that can destroy transmitter–recipient–virus interactions as a whole. Taken together, while conventional strategies to design vaccines aim at reducing the likelihood and degree of infection, hypergraphs will help gain new insight into the design of vaccines that control not only the infection of coronaviruses but also their spread from transmitters.
4. Mobile Hypergraphs Encapsulated in a Genome-Wide Atlas
Researchers view a transmitter, a recipient, and the viruses that connect them as a functional triad unit. The model proposed above can encode main genetic effects, pairwise epistatic effects, and high-order epistatic interactions among these three entities into a weighted hypergraph. The recipient of this unit may serve as a transmitter to infect another recipient, forming a new unit along with the viruses, and this process repeats until the contagion is controlled. It is expected that the behavior changes from unit to unit because the recipients and viruses vary in their genotypes. Researchers reconstruct a hypergraph for each unit and, therefore, provide a series of dynamically changing hypergraphs, called mobile hypergraphs, in communities (Figure 2). Mobile hypergraphs can trace the topological changes in gene–gene interactions and characterize key players that determine the transmissibility of SARS-CoV-2 from person to person.
By scanning for all SNPs throughout the whole genomes of humans and viruses, researchers can chart a genome-wide atlas of mobile hypergraphs. From the atlas, researchers can identify the hotspots of genetic variants that mediates the rate and extent of coronavirus spread. A system constituted by a transmitter, recipient, and the virus is mediated by 17 types of genetic effects each representing a different aspect of the respective genetic machinery. Thus, this atlas will be illustrated for each type of genetic effect in order to portray a comprehensive picture of the genetic mechanisms underlying COVID-19 spread.
References
- Wu, J.T.; Leung, K.; Leung, G.M. Nowcasting and forecasting the potential domestic and international spread of the 2019-nCoV outbreak originating in Wuhan, China: A modelling study. Lancet 2020, 395, 689–697.
- Ghinai, I.; McPherson, T.D.; Hunter, J.C.; Kirking, H.L.; Christiansen, D.; Joshi, K.; Rubin, R.; Morales-Estrada, S.; Black, S.R.; Pacilli, M. First known person-to-person transmission of severe acute respiratory syndrome coronavirus 2 (SARS-CoV-2) in the USA. Lancet 2020, 395, 1137–1144.
- Anacleto, O.; Cabaleiro, S.; Villanueva, B.; Saura, M.; Houston, R.D.; Woolliams, J.A.; Doeschl-Wilson, A.B. Genetic differences in host infectivity affect disease spread and survival in epidemics. Sci. Rep. 2019, 9, 4924.
- Bai, Y.; Yao, L.; Wei, T.; Tian, F.; Jin, D.Y.; Chen, L.; Wang, M. Presumed asymptomatic carrier transmission of COVID-19. JAMA 2020, 323, 1406–1407.
- van Sluijs, L.; Pijlman, G.P.; Kammenga, J.E. Why do Individuals Differ in Viral Susceptibility? A Story Told by Model Organisms. Viruses 2017, 9, 284.
- Thompson, J.N. The evolution of species interactions. Science 1999, 284, 2116–2118.
- Lawrence, D.; Fiegna, F.; Behrends, V.; Bundy, J.G.; Phillimore, A.B.; Bell, T.; Barraclough, T.G. Species interactions alter evolutionary responses to a novel environment. PLoS Biol. 2012, 10, e1001330.
- Barraclough, T.G. How do species interactions affect evolutionary dynamics across whole communities? Ann. Rev. Ecol. Evol. Syst. 2015, 46, 25–48.
- Santostefano, F.; Wilson, A.J.; Niemelä, P.T.; Dingemanse, N.J. Indirect genetic effects: A key component of the genetic architecture of behaviour. Sci. Rep. 2017, 7, 10235.
- Jiang, L.; Xu, J.; Sang, M.; Zhang, Y.; Ye, M.; Zhang, H.; Wu, B.; Zhu, Y.; Xu, P.; Tai, R.; et al. A drive to driven model of mapping intraspecific interaction networks. iScience 2019, 22, 109–122.
- Fisher, D.N.; McAdam, A.G. Indirect genetic effects clarify how traits can evolve even when fitness does not. Evol. Let. 2019, 3, 4–14.
- Biscarini, F.; Bovenhuis, H.; van der Poel, J.; Rodenburg, T.B.; Jungerius, A.P.; van Arendonk, J.A. Across-line SNP association study for direct and associative effects on feather damage in laying hens. Behav. Genet. 2010, 40, 715–727.
- Mutic, J.J.; Wolf, J.B. Indirect genetic effects from ecological interactions in Arabidopsis thaliana. Mol. Ecol. 2007, 16, 2371–2381.
- Cordell, H. Epistasis: What it means, what it doesn’t mean, and statistical methods to detect it in humans. Hum. Mol. Genet. 2002, 11, 2463–2468.
- Landolfo, S.; De Andrea, M.; Dell’Oste, V.; Gugliesi, F. Intrinsic host restriction factors of human cytomegalovirus replication and mechanisms of viral escape. World J. Virol. 2016, 5, 87–96.
- Denzin, L.K.; Khan, A.A.; Virdis, F.; Wilks, J.; Kane, M.; Beilinson, H.A.; Dikiy, S.; Case, L.K.; Roopenian, D.; Witkowski, M. Neutralizing antibody responses to viral infections are linked to the non-classical MHC class II gene H2-Ob. Immunity 2017, 47, 310.
- Zhang, Y.-Z.; Holmes, E.C. A genomic perspective on the origin and emergence of SARS-CoV-2. Cell 2020, 181, 223–227.
- Domingo-Calap, P. Viral evolution and immune responses. J. Clin. Microbiol. Biochem. Technol. 2019, 5, 013–018.
- Xue, K.S.; Bloom, J.B. Linking influenza virus evolution within and between human hosts. Virus Evol. 2020, 6, veaa010.
- Parrish, C.R.; Holmes, E.C.; Morens, D.M.; Park, E.C.; Burke, D.S.; Calisher, C.H.; Laughlin, C.A.; Saif, L.J.; Daszak, P. Cross-species virus transmission and the emergence of new epidemic diseases. Microbiol. Mol. Biol. Rev. 2008, 72, 457–470.
- Pavlopoulos, G.A.; Secrier, M.; Moschopoulos, C.N.; Soldatos, T.G.; Kossida, S.; Aerts, J.; Schneider, R.; Bagos, P.G. Using graph theory to analyze biological networks. BioData Min. 2011, 4, 10.
- Anholt, R.R.H. Evolution of epistatic networks and the genetic basis of innate behaviors. Trends Genet. 2020, 36, 24–29.
- Bretto, A. Hypergraph Theory: An Introduction; Springer: New York, NY, USA, 2013.
- Klamt, S.; Haus, U.-U.; Theis, F. Hypergraphs and cellular networks. PLoS Comput. Biol. 2009, 5, e1000385.
- Dong, E.; Du, H.; Gardner, L. An interactive web-based dashboard to track COVID-19 in real time. Lancet Infect. Dis. 2020, 20, 533–534.
- Li, Q.; Guan, X.; Wu, P.; Wang, X.; Zhou, L.; Tong, Y.; Ren, R.; Leung, K.S.M.; Lau, E.H.Y.; Wong, J.Y.; et al. Early transmission dynamics in Wuhan, China, of novel coronavirus-infected pneumonia. N. Engl. J. Med. 2020, 382, 1199–1207.
- Heymann, D.L.; Shindo, N. COVID-19: What is next for public health? Lancet 2020, 395, 542–545.
- Li, H.; Wang, Y.; Ji, M.; Pei, F.; Zhao, Q.; Zhou, Y.; Hong, Y.; Han, S.; Wang, J.; Wang, Q.; et al. Transmission Routes Analysis of SARS-CoV-2: A Systematic Review and Case Report. Front. Cell Dev. Biol. 2020, 8, 618.
- Bodó, Á.; Katona, G.Y.; Simon, P.L. SIS Epidemic Propagation on Hypergraphs. Bull. Math. Biol. 2016, 78, 713–735.
- Li, Y.; Berg, A.; Chang, M.N.; Du, P.; Ahn, K.; Mauger, D.; Liao, D.; Wu, R. A statistical model for genetic mapping of viral infection by integrating epidemiological behavior. Stat. Appl. Genet. Mol. Biol. 2009, 8, 38.
More